Your Data Storyteller

20 posts

Your Data Storyteller banner
Your Data Storyteller

Your Data Storyteller

@dataviz

I love storytelling |📊 Passionate about turning raw data into visual stories | | Helping insights come to life one chart at a time! | 1X Hackathon winner!

Lagos, NIGERIA 参加日 Ekim 2024
125 フォロー中153 フォロワー
Your Data Storyteller がリツイート
Biokpo || PowerBI Developer
Biokpo || PowerBI Developer@BiokpoAmachree·
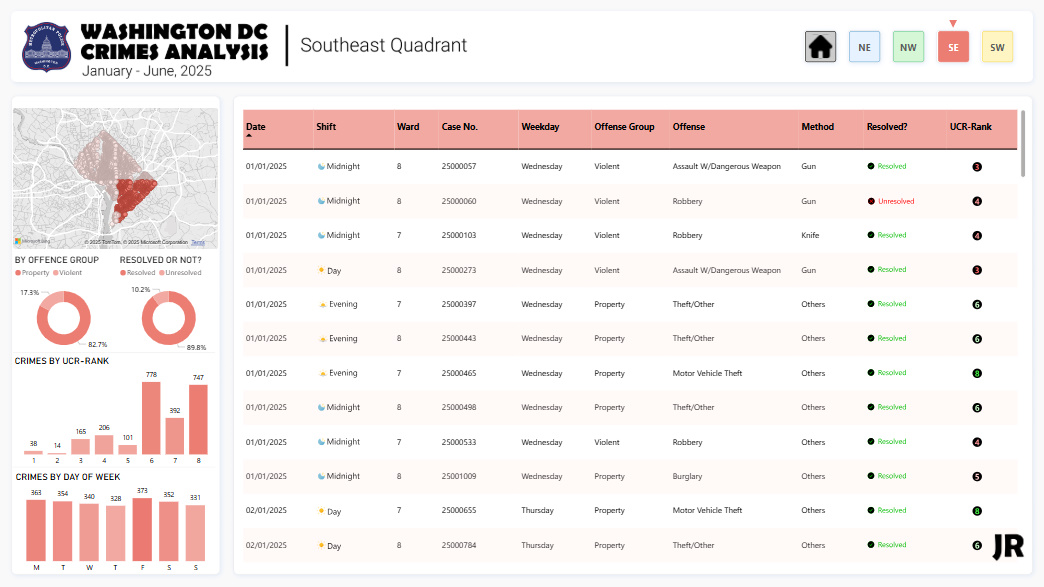
One of the PowerBI project with students @ ESanalysis. 
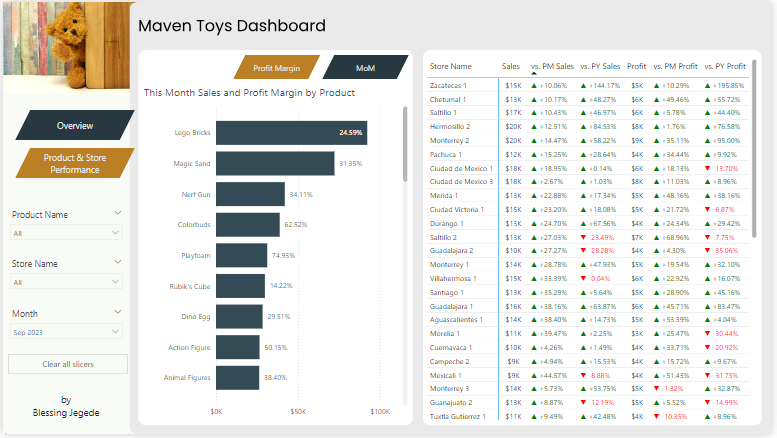
Writing DAX and structuring Dashboard is only hard when you learn the wrong way. To join the next cohort contact @edwige_songong
GIF
Biokpo || PowerBI Developer@BiokpoAmachree

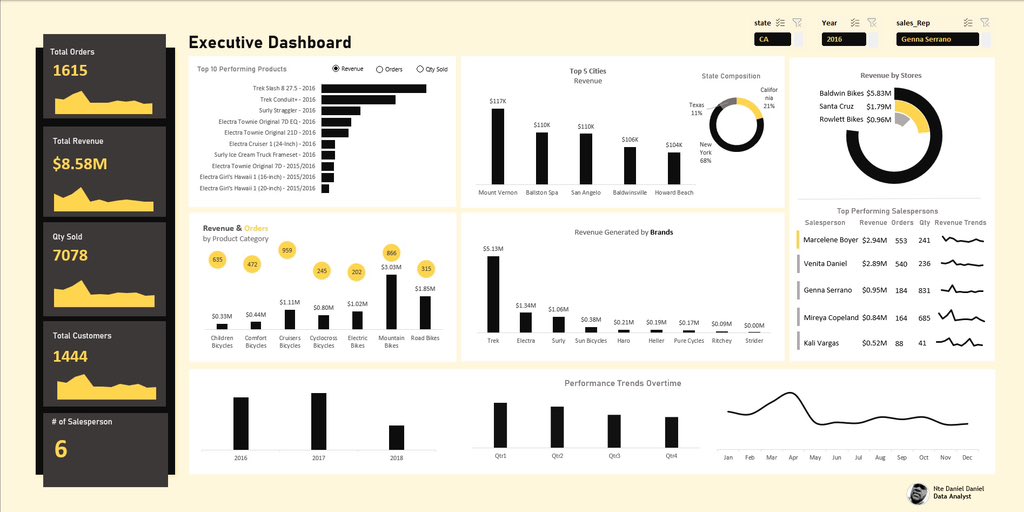
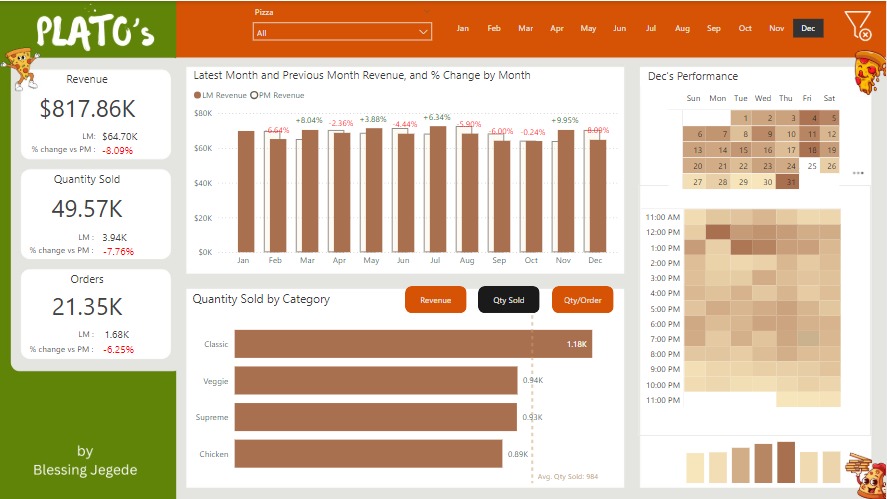
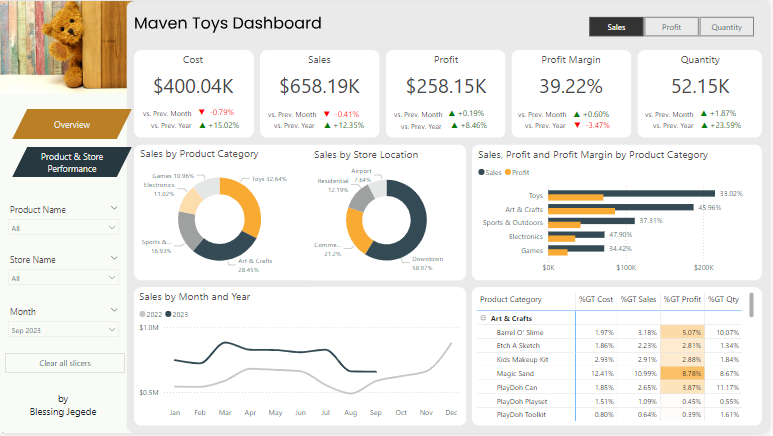
I teach my students how to design and get used to white backgrounds because it’s clean, professional, easy to read, and puts your visuals in the spotlight. Master clarity before creativity. #Datafam #Dashboarddesign

English
5
12
88
3.1K
Your Data Storyteller がリツイート
Prosper Nnamudi
Prosper Nnamudi@Prospy77723566·
Decided to recreate @ObohX excel project visualization using excel All I can say is that Excel is really underestimated for real #Excel
Prosper Nnamudi tweet media
English
5
12
80
2.6K
Your Data Storyteller がリツイート
Jude Raji | Senior BI Analyst
Hi #DataFam, this month I decided to look into crimes in Washington D.C. DC is divided into four quadrants, and that’s the perspective I chose. Here's what I found: - The Northwest quadrant accounts for nearly half of all reported crimes. - Theft-related offenses dominate citywide. - Most crimes occur during evening hours. Here's the interactive Power BI dashboard: lnkd.in/e2PXqqAJ I made a LinkedIn post too: tinyurl.com/4jvunuy8 This is 6/12 of my #OneDashboardaMonth challenge. Feedback is welcome.
Jude Raji | Senior BI Analyst tweet mediaJude Raji | Senior BI Analyst tweet mediaJude Raji | Senior BI Analyst tweet media
English
11
9
41
2.1K
Your Data Storyteller がリツイート
Matt AI 🤖
Matt AI 🤖@TheMattAnalysis·
Hey #DataFam Just finished building one of my favorite dashboards yet and this time, I did it differently. I wanted to build something different this time. Not sales. Not finance Just something more visual, fun, and personal. Interact here👇 app.powerbi.com/view?r=eyJrIjo… #PowerBI
Matt AI 🤖 tweet mediaMatt AI 🤖 tweet mediaMatt AI 🤖 tweet media
English
39
47
307
14.7K
Your Data Storyteller がリツイート
Jude Raji | Senior BI Analyst
I've been getting some questions in my DM lately. Here’s what #TheFirst30 is: - You’ll master common data analysis tools. - You’ll write actual SQL queries. - You’ll build and share dashboards. - You’ll get one short lesson in your inbox every day. It’s everything you need to get started and build real skills, delivered one day at a time. So, in essence, when we launch, you'll get one short lesson in your inbox every day over the course of 30 days. To sign up: thefirst30.xyz
English
8
15
39
2.7K
Your Data Storyteller
Your Data Storyteller@dataviz·
@yabaleftonline For real, you can't win against your kids. You can't push them away even if you aren't happy with whatever they decide to do.
English
0
0
1
192
YabaLeftOnline
YabaLeftOnline@yabaleftonline·
2Baba and his woman Natasha visit his mom.
English
66
39
372
36K
Your Data Storyteller
Your Data Storyteller@dataviz·
@bricklinkgh @DabereNnamani The major problem with the chart is that you used a continuous x axis. This gives the illusion that the sleep happened throughout the period. Use a discrete x-axis. Also, a column chart might be better than line in this case too.
English
1
0
0
20
Cromwell
Cromwell@theo_cromwell·
@DabereNnamani That should total hours of sleep time over the 25 days period. Is there a better way to communicate that please?
English
3
0
2
282
Your Data Storyteller がリツイート
Jessica Ayodele
Jessica Ayodele@jessica_xls·
25 Data Analyst Projects ideas for your portfolio + Datasets. A thread🧵 Grocery Retail 🛍️🛒 1. Grocery Demand Forecasting Using Sales Data  2. Market Basket Analysis 3. Customer Loyalty Trend Analysis 4. Customer Segmentation Analysis
English
12
170
894
61K
Your Data Storyteller
Your Data Storyteller@dataviz·
@Abidemi__xx Okay, what kind of research, if you don't mind me asking? I'll love it if you're specific, I was a quantity surveying student
English
1
0
0
61
Abidemi✨
Abidemi✨@Abidemi__xx·
@dataviz Research analysis relating to construction sectors
English
1
0
0
17
Your Data Storyteller
Your Data Storyteller@dataviz·
@Rita_tyna Is it okay to tweak your client's data, build a report then add it in your portfolio? Yeah, tweak it so it's almost unrecognizable but of course the column names are the same.
English
1
1
3
607
Your Data Storyteller
Your Data Storyteller@dataviz·
@Ezinne_Jubilee I do not settle for general instructions, I ask specific questions. Even after asking specific questions, I recap what was discussed, then ask for confirmation again. These tips have helped me gain stakeholders' trust.
English
1
0
1
31
Your Data Storyteller
Your Data Storyteller@dataviz·
I learned an amazing technique this week—how to display all negative values on one side and positives on another, in Power BI charts. It was an insightful analyzing the data to uncover insights. Feeling proud of how it turned out! 😍 Explore in Power BI: app.powerbi.com/view?r=eyJrIjo…
Your Data Storyteller tweet media
English
1
1
8
347
Tina Okonkwo
Tina Okonkwo@Rita_tyna·
I have never regretted being a tutor - It gives me so much joy to see the work of my students. Look at these projects of @dataviz one of the students in my last cohort. It's so beautiful to see the growth. If you are looking for a data analyst - Please reach out to @dataviz
Tina Okonkwo tweet mediaTina Okonkwo tweet mediaTina Okonkwo tweet media
English
5
8
74
3.2K
Your Data Storyteller がリツイート
Ezekiel
Ezekiel@ezekiel_aleke·
8 KPI Dashboard Templates:
Ezekiel tweet media
English
4
223
1.2K
90.5K