@ckhead@antoine_fabri Because it lets you work with any DBMS and there's nothing else like it in #rstats. Does this SQL interface even exists in JS or python? I doubt it (even if I am not sure).
#rstats with dplyr:
You can:
mtcars |> summarize(across(everything(), mean), .by = c(vs, am))
You can:
mtcars |> group_by(vs, am) |> summarize_all(mean, .groups = "drop")
You can't
mtcars |> summarize_all(mean, .by = c(vs, am))
I don't like this at all
@VarugheseDeepak@rstatstweet@lostgps I don't think gt has a grid graphic output. you probably talking about webshot export but it does not resize accordingly to available space.
@DavidGohel At least there is hope! Right now I am using a combination of officedown + captioner to get by, but hoping this would become easier. Any idea when this Quarto release is supposed to happen?
In Quarto, is it now possible to work with figure/table captions for Word documents and to automatically update and reference the figure/table numbers? If yes, links to references or examples would be appreciated. Thank you! #rstats
Suppose, in a #QuartoPub document, using #rStats I have a list of length G, each item in this list is a flextable - I need to use flextable as opposed to kable, to allow for output to docx.
G is unknown apriori, but will be at least 1.
Is there any way to create a (1/2)
@dtoher This won't work for now. Captions/crossref are not available yet in Quarto for Word, it applies to flextable, gt, etc. It does not work as there is no way to send this caption to quarto yet (in R Markdown or with usual R, not an issue).
sequence of tables with associated labels and captions that could be worked out dynamically/parsed?
Manually, this can be done really easily (creating new labels etc) and knowing when to stop, but is there a way of automating this? (2/2)
Does anyone know what is happening with the #rstats CRAN updates? It seems that since Saturday, all packages that are submitted for an update are stuck in the 'pretest' folder.
I can't thank @DavidGohel enough for the absolutely brilliant #rstats officer package. In my real job in a very constrained environment, I am working with R 3.8 (lots of pkgs not avail) & 5 year old RStudio ver. officer provides the publishing engine I need. Thanks David!!
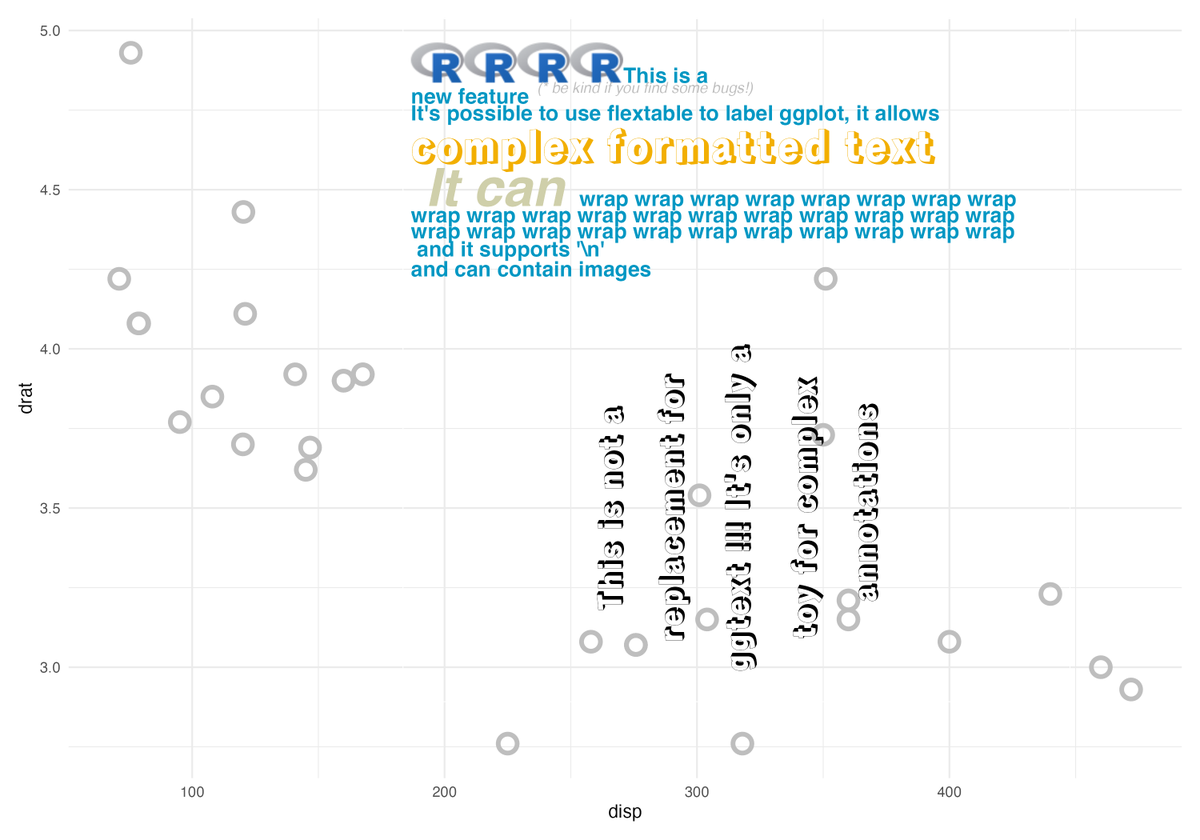
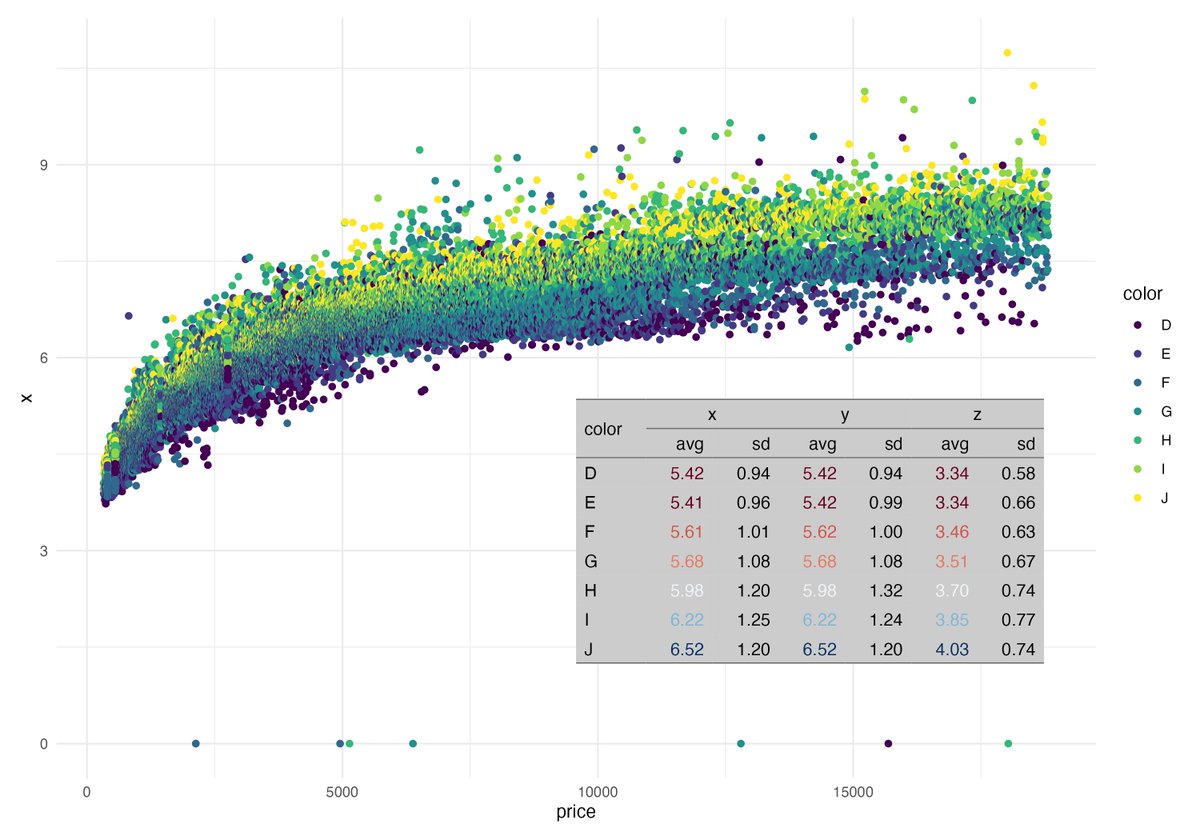
#rstats funny side effect of having a 'grid graphics' output with #flextable - it can be used to add complex labels on #ggplot with 'patchwork' (code: gist.github.com/davidgohel/681…, you may have to change the fonts if not avail. on your machine)
@IsabellaGhement@thomas_mock@lostgps Thank you Isabella. It's working with quarto now (captions were the issue). not yet on CRAN... Quarto team is going to work on captions/docx, we'll adapt if necessary :) I don't think officedown has any reason to exist in quarto universe.
@DavidGohel@thomas_mock@lostgps Wow! This looks so nice, David!
Just wondering - do you have any plans for integrating some of your other fabulous R packages (e.g., officer, officedown) with Quarto? Last I checked, they didn’t seem to work with Quarto.
It's Friday. Let's show off a new feature of #rstats flextable @lostgps and I developed. We have now a "grid graphic" output🥳, it works very well with ggplot2, cowplot and patchwork (only on GitHub for now).
Code available here: gist.github.com/davidgohel/eae…
🚨big project launch🚨
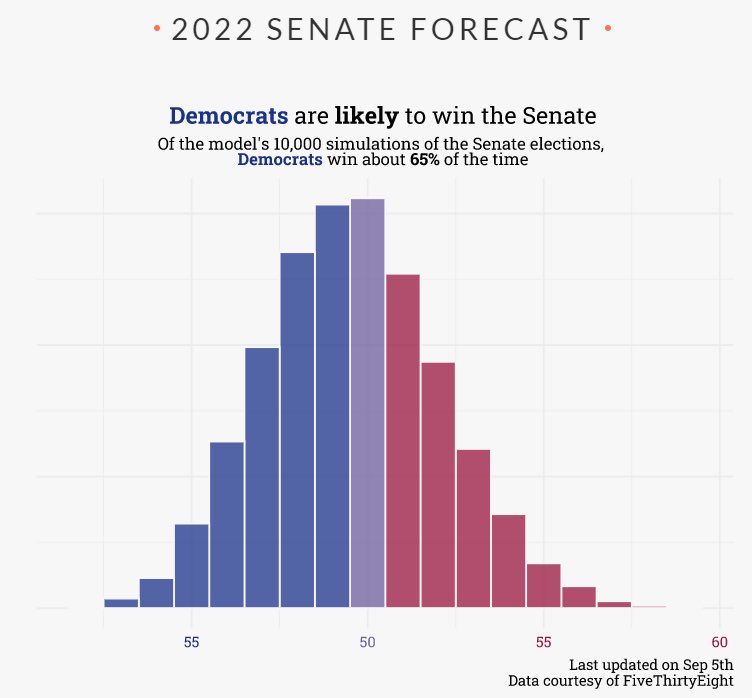
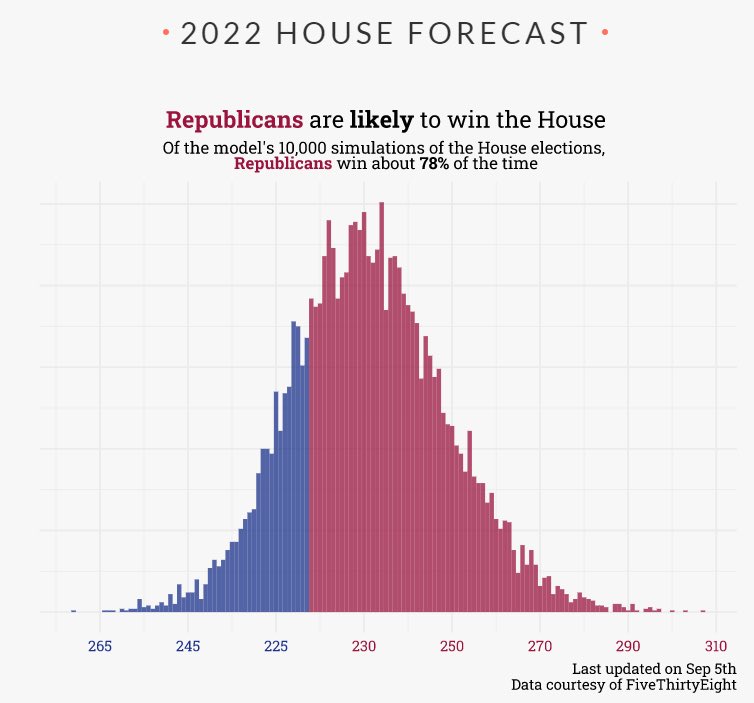
today I’m launching my 2022 midterms forecast! As of today, Democrats are favored to keep the senate and Republicans are favored to flip the house - more deets below but you can find the full forecasts here:
thedatadiary.net/senate/thedatadiary.net/house/
#rstats I'm looking for examples of using #quartopub to generate powerpoint slides. Something that goes a bit beyond just the basics, e.g., showing code and output on the same slide, tabsets, etc.