Epic Charting

18.8K posts

Epic Charting banner
Epic Charting

Epic Charting

@EpicCharting

Technical Trader ✏️📚 || Opinions on daily price action 📈|| Not financial advice || Focusing on ES, NQ and Mega Caps|| Channels, Fibs & Pivots||Personal Diary

Financial Markets 가입일 Eylül 2020
111 팔로잉2.1K 팔로워
고정된 트윗
Epic Charting
Epic Charting@EpicCharting·
🧵 Thread on what i use when analyzing the market:🧵📝✏️ - To start i try to limit indicators to a bare minimum. Price is king and indicators for the most part clog the mind and most are lagging. -
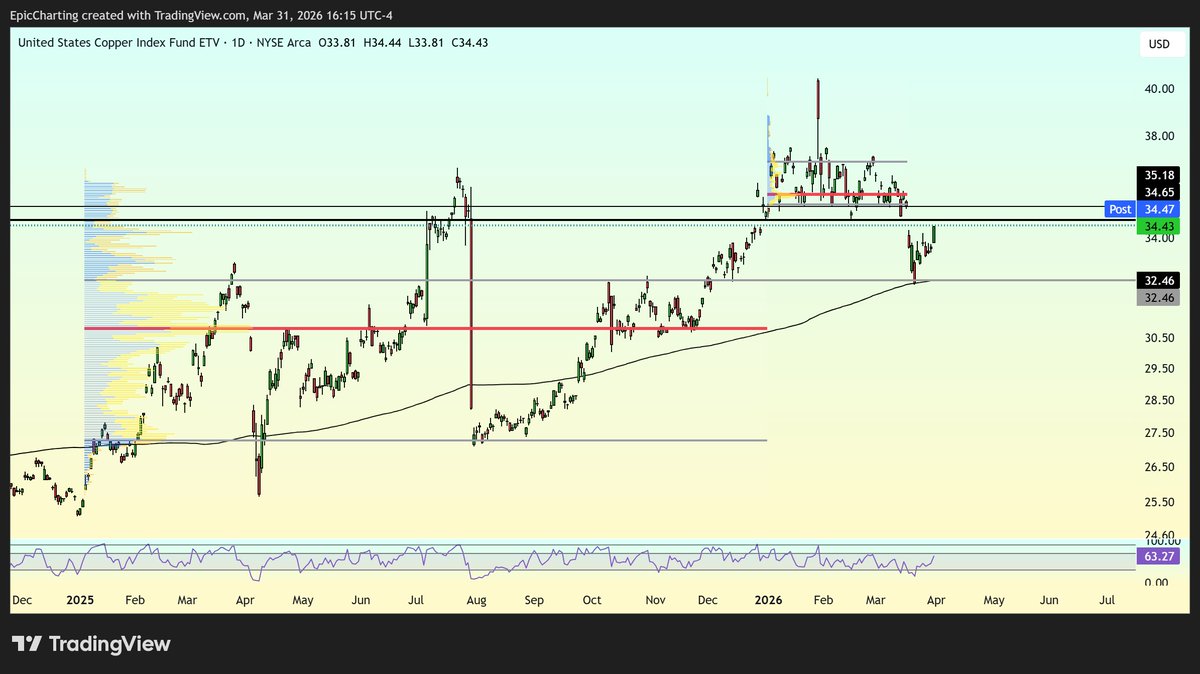
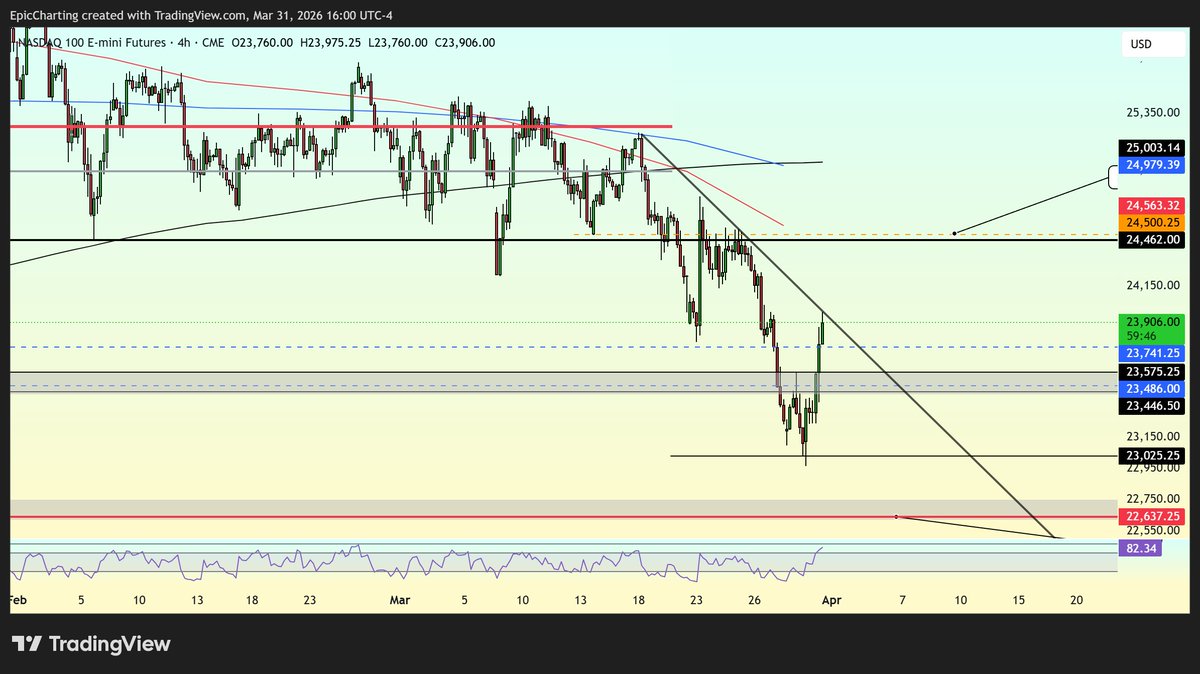
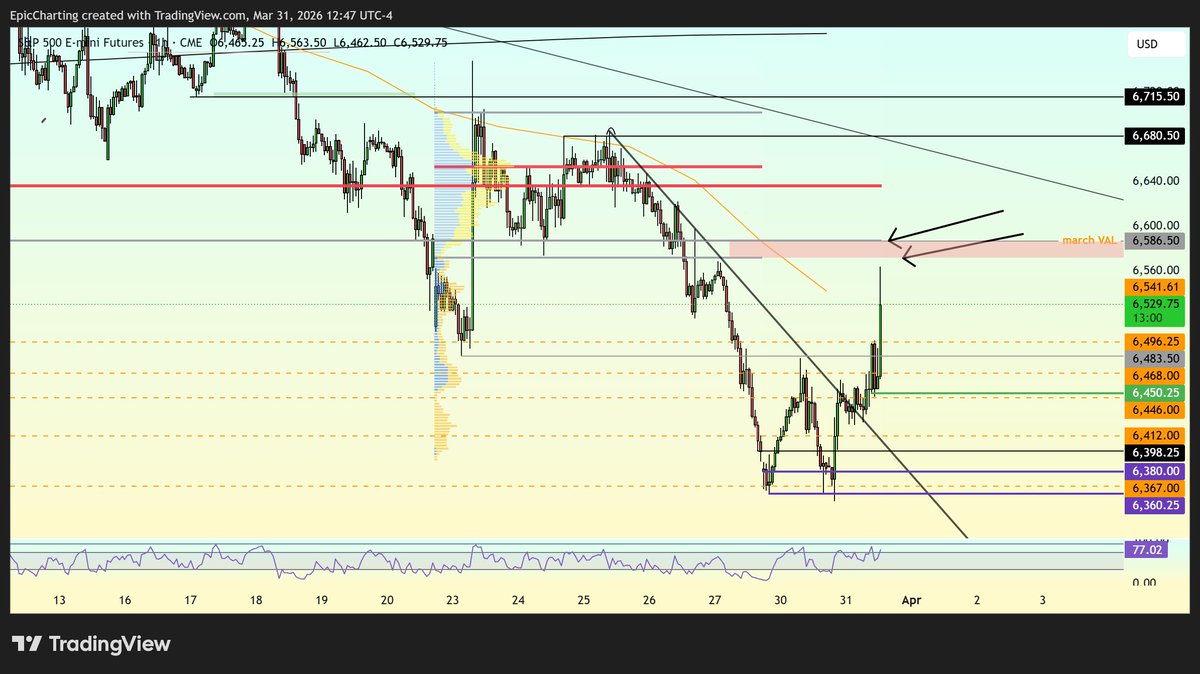
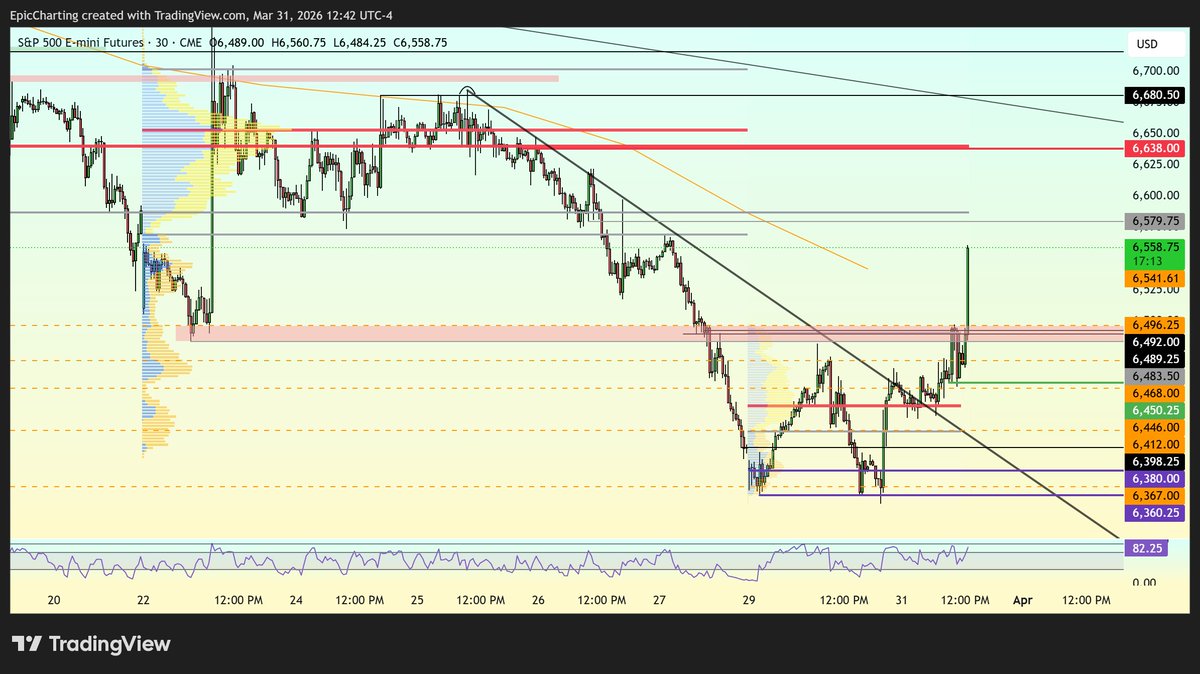
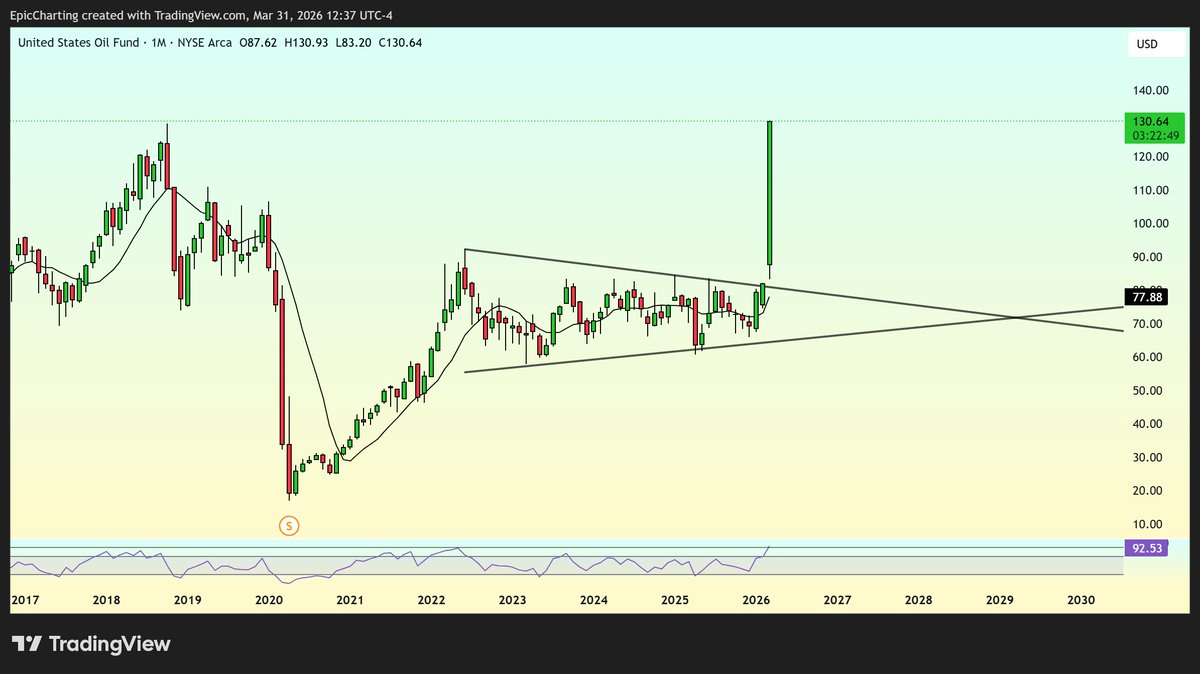
For support and resistance I use a combination of Channels, pattern formations (triangles, flags etc) and horizontal pivots. -I do use fibonacci, sometimes as an actual s/r but most times just to gauge retracements. To see if we are in a "normal" pullback. -And as far as actual "indicators" i use the rsi, 50,100,200 MAs, and short term 8 and 21emas. -When drawing channels most people anchor at the extremes i.e to major swing highs on one side and two major swing lows on the other side. While this is the correct way alot of the time, there are many times it isn't because the second swing high might just be a deviation. (More on this later). -
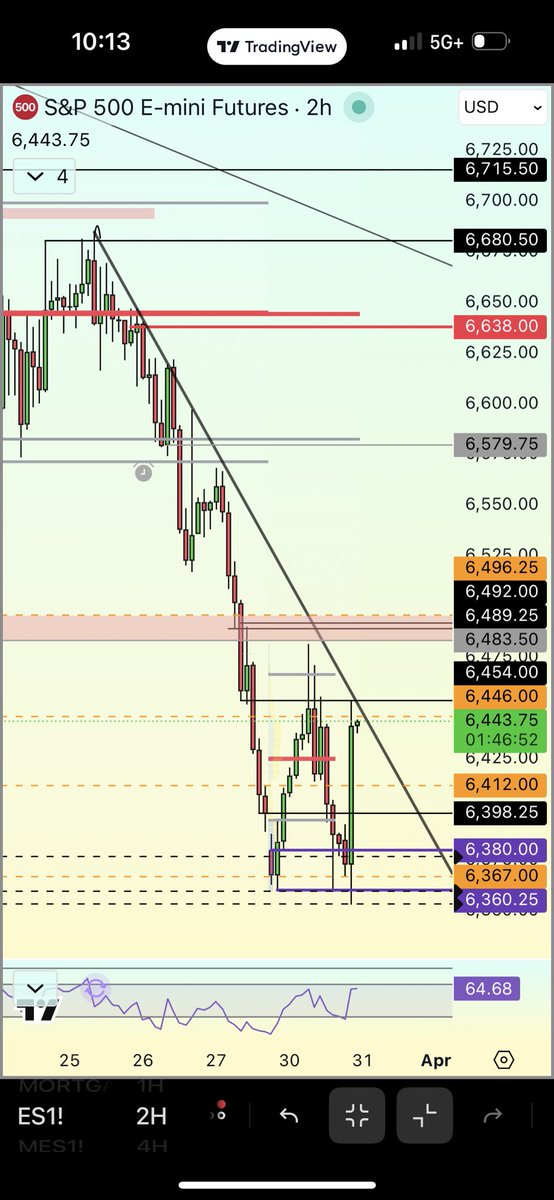
The way i derive my pivot levels is multifaceted. I typically start on the yearly chart and see if there are any yealy lows or highs of note, they usually act as a support or resistance. Next are key monthly pivots, highs or lows of important months. How do i deem it important? Well again that requires a longer thread but for starters i want that level to have generated a strong market reaction in the past. If theres an open and or close on back to back monthly candles at the same price to me that is a powerful level. When i zoom lower down to daily levels to me deviations are everything. Remember all deviations are liquidity grabs BELOW or ABOVE the "actual" level, so its important to try to identify whats the s/r level and whats the deviation point. -As far as fibs are concerned depending on the time frame of the fib i might actually trade it but typically i use it just for measuring purposes. -The 8 and 21 emas are super powerful particularly in TRENDING markets like weve had the last 2 months. So many tickers simply have rode the 8 ema while some have rode the 21ema. I use it to gauge trend, u can use it as an s/r as well. -The higher timeframe moving averages are basically useless on a day to day basis unless we are actually testing them mid day but they can also be used to gauge strength and trend from a much higher timeframe. $SPY $QQQ $ES $NQ $ARKK $TSLA $MSFT $AAPL $NVDA $AMD $AMZN #StockMarket #education
English
10
5
44
34.2K
Epic Charting 리트윗함
Goshawk Trades
Goshawk Trades@GoshawkTrades·
Druckenmiller used to throw up once or twice a week from the anxiety. This is the raw reality of trading. Watch the full clip:
English
9
68
533
40.8K
Epic Charting
Epic Charting@EpicCharting·
$SPY First daily close above 8ema since feb 26.
English
1
0
1
156
Epic Charting
Epic Charting@EpicCharting·
$CPER held 200ma and 2025 VAH
Epic Charting tweet media
Eesti
0
0
0
89
Epic Charting
Epic Charting@EpicCharting·
$HG $CPER . Copper weekly next leg up incoming, .618 from the lows. 200ma. previous breakout retest. send it.
Epic Charting tweet media
English
1
0
0
142
Adam Mancini
Adam Mancini@AdamMancini4·
Absolutely incredible follow through on last nights 6360 Failed Breakdown in #ES_F, given in yesterday's 4pm newsletter. I warned at 8am to just hold runners today with targets being 6467 (hit), 6490 (hit), 6524 (hit). +195 points now. Bonus slate are 6575, 6592. Same supports
Adam Mancini@AdamMancini4

Mid day chop time in #ES_F now, just hold runner. Long trigger was the 6360 (Sunday/Monday low) Failed Breakdown 830pm last eve. Targets were 6467 (hit), 6490 (hit), 6524 (not yet). Supports were 6447 posted (held to the tick 1hr ago), 6413-15. 6447 remains weak, watch traps

English
10
5
137
30.9K
Epic Charting
Epic Charting@EpicCharting·
$ES D8ema. last weeks VAL and march VAL above. Stay nimble peoples $SPY $QQQ
Epic Charting tweet media
English
0
0
0
506
Epic Charting 리트윗함
FinancialJuice
FinancialJuice@financialjuice·
Iran's President Pezeshkian: We're ready to end war, but want guarantees.
English
55
96
417
166.9K
Adam Mancini
Adam Mancini@AdamMancini4·
@ILGHomeLoans Its a strong correlation now but won't be this strong when the war ends. Usually they're very loosely or often not correlated at all
English
1
0
11
649
Adam Mancini
Adam Mancini@AdamMancini4·
We are running the targets. Readers know I trade 1 setup: The Failed Breakdown. We got it 830pm last evening when we swept the 6360 shelf, trapped shorts, and recovered in #ES_F Today's targets were 6467 (hit), 6490 (hit). 6524 stretch target. Just ride your runner as posted 8am
Adam Mancini@AdamMancini4

Little to do now but ride runners. Per 4pm newsletter, our #ES_F long setup last eve was the Failed Breakdown of 6360 (down to 6353). We 6360 at 830pm, recovered, and ripped. Targets were 6447 (hit), 6467 (hit). Next up are 6490, 6524. No supports of interest until 6415, 6385

English
14
4
131
41.1K
Epic Charting 리트윗함
Epic Charting
Epic Charting@EpicCharting·
$ES #ES_F Remember, markets dont move linearly and punish the masses. We cud easily see a vicious rally this week which doesnt mean lows are in. See 2022. Stay nimble. Throw your opinions out the window. $SPY $QQQ
English
0
1
6
536
Epic Charting
Epic Charting@EpicCharting·
@AdamMancini4 ye thats true altho sometimes trapping the late longs there can be good too
English
2
0
1
162
Adam Mancini
Adam Mancini@AdamMancini4·
@EpicCharting Its the closest setup for sure, but it would've been ideal for bulls if we didn't make that new high before doing it. Starts to get a little asymmetrical now
English
3
1
12
819
Epic Charting
Epic Charting@EpicCharting·
$ES Wallstreet headline pumps us back to the downtrend. $SPY
Epic Charting tweet media
Epic Charting@EpicCharting

$ES #ES_F This short term downtrend needs to break with a 6485 reclaim to shift some short term momentum to the bulls. $SPY

English
0
0
4
677