Logan Paul explica por qué ahora está coleccionando en silencio.
“Hace 5 años hablaba mucho de coleccionar Pokémon, pero entonces me di cuenta de algo…”
“Si hablo abiertamente sobre algo y el mercado se dispara y quiero más de ello, básicamente estoy pujando en mi contra porque ahora todos están cobrando entre 1,5 y 2 veces más de lo que cobraban porque yo conté la historia”.
“Así que he estado coleccionando en silencio porque soy muy consciente de que si les digo que me encantan los dinosaurios y que he gastado 1.000.000 de dólares en ellos, tendré que gastar 2.000.000 para conseguir lo mismo”.
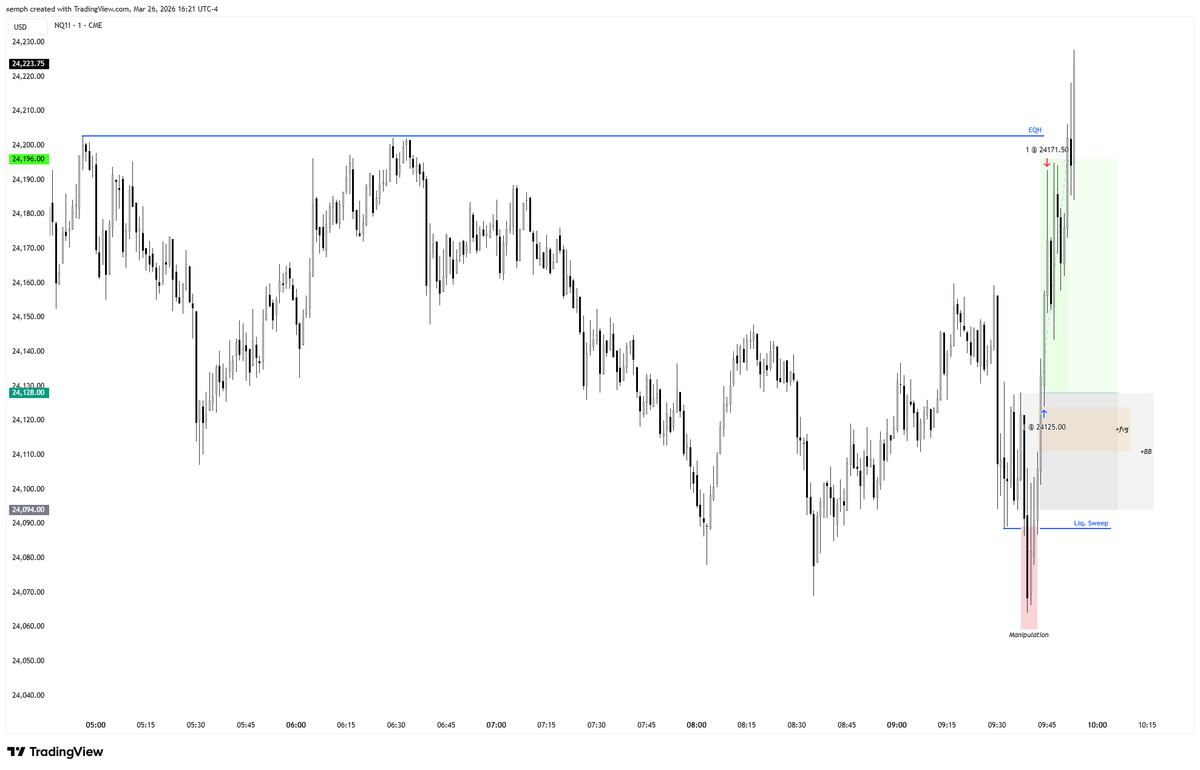
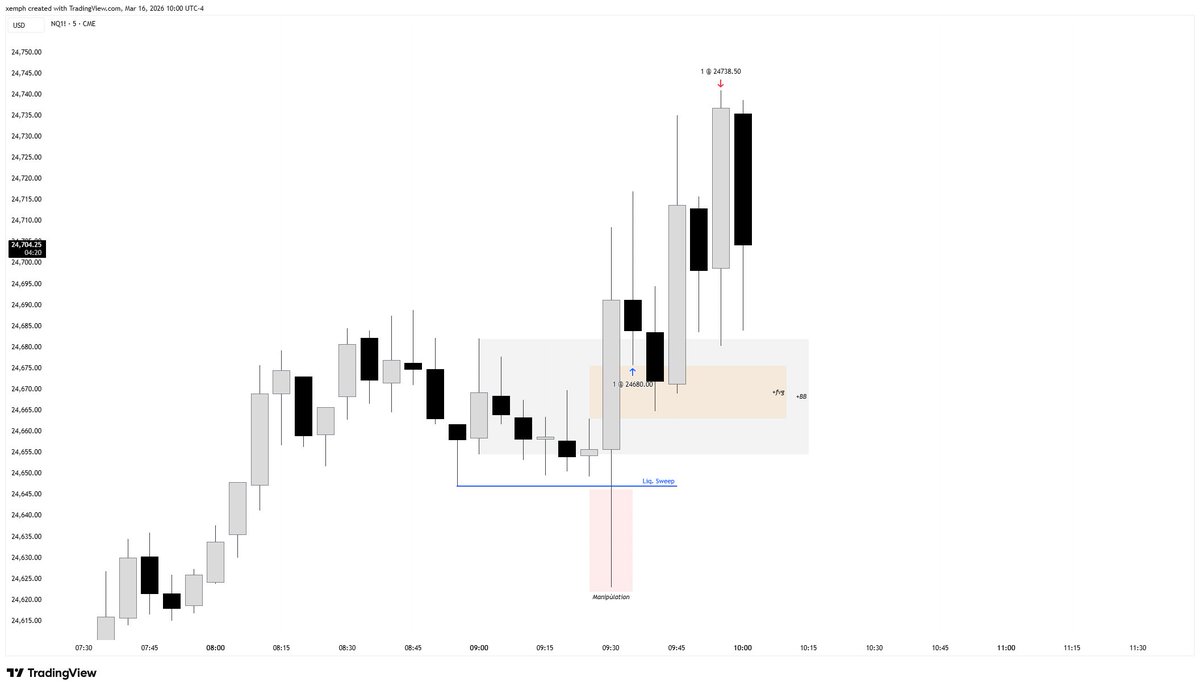
@jasmiquiztli In this case, time acts more as contextual framing than as a PD array. Seeing the open sweep liquidity and then sharply reverse in the opposite direction, right at the open, which is the key element, gives me confidence.
$NQ April 1 2026
9:30 Manipulation leading into a liquidity sweep.
1-minute breaker formed.
Entered at market with 1 contract (no limit order), with a plan to add another contract if price retested the breaker.
Calling it a day, -1R during London +3.4R during NY.
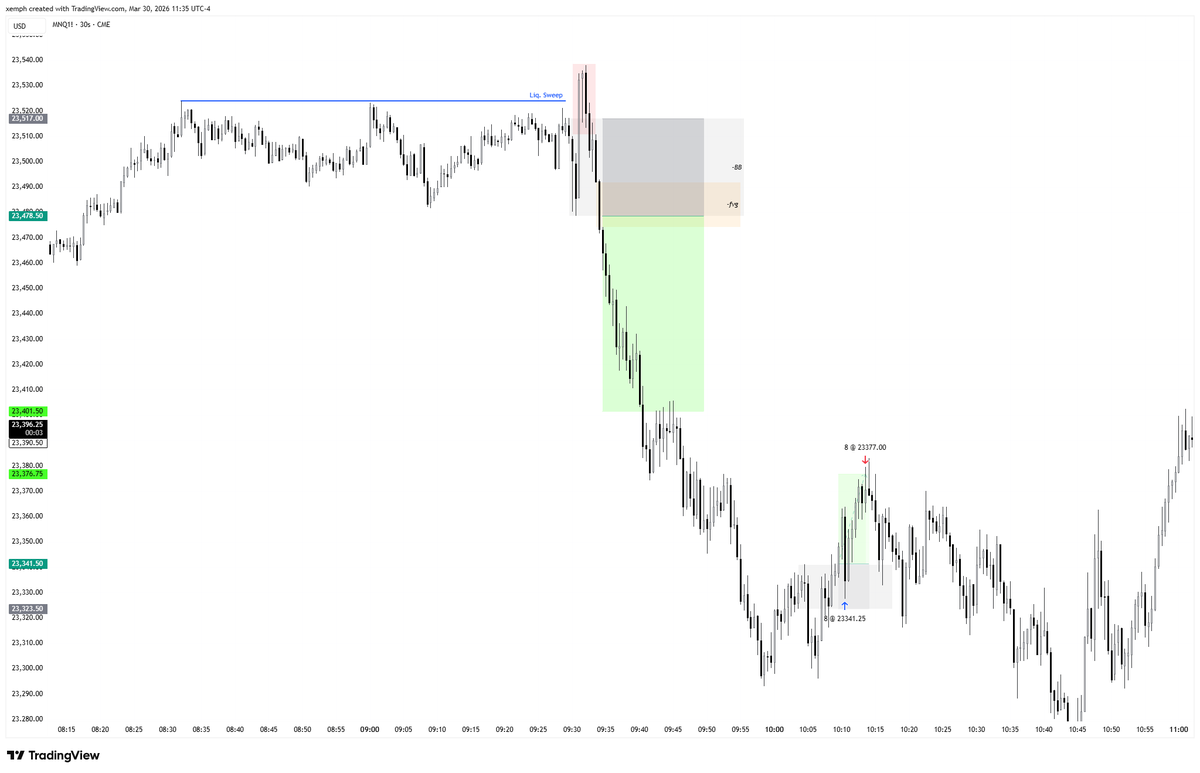
$NQ Mar. 30 2026
Textbook open, highs taken first, followed by a move lower.
Skipped the initial setup due to no retest, but caught a cheeky long later during the @TheLabLive stream.
Good start of the week.
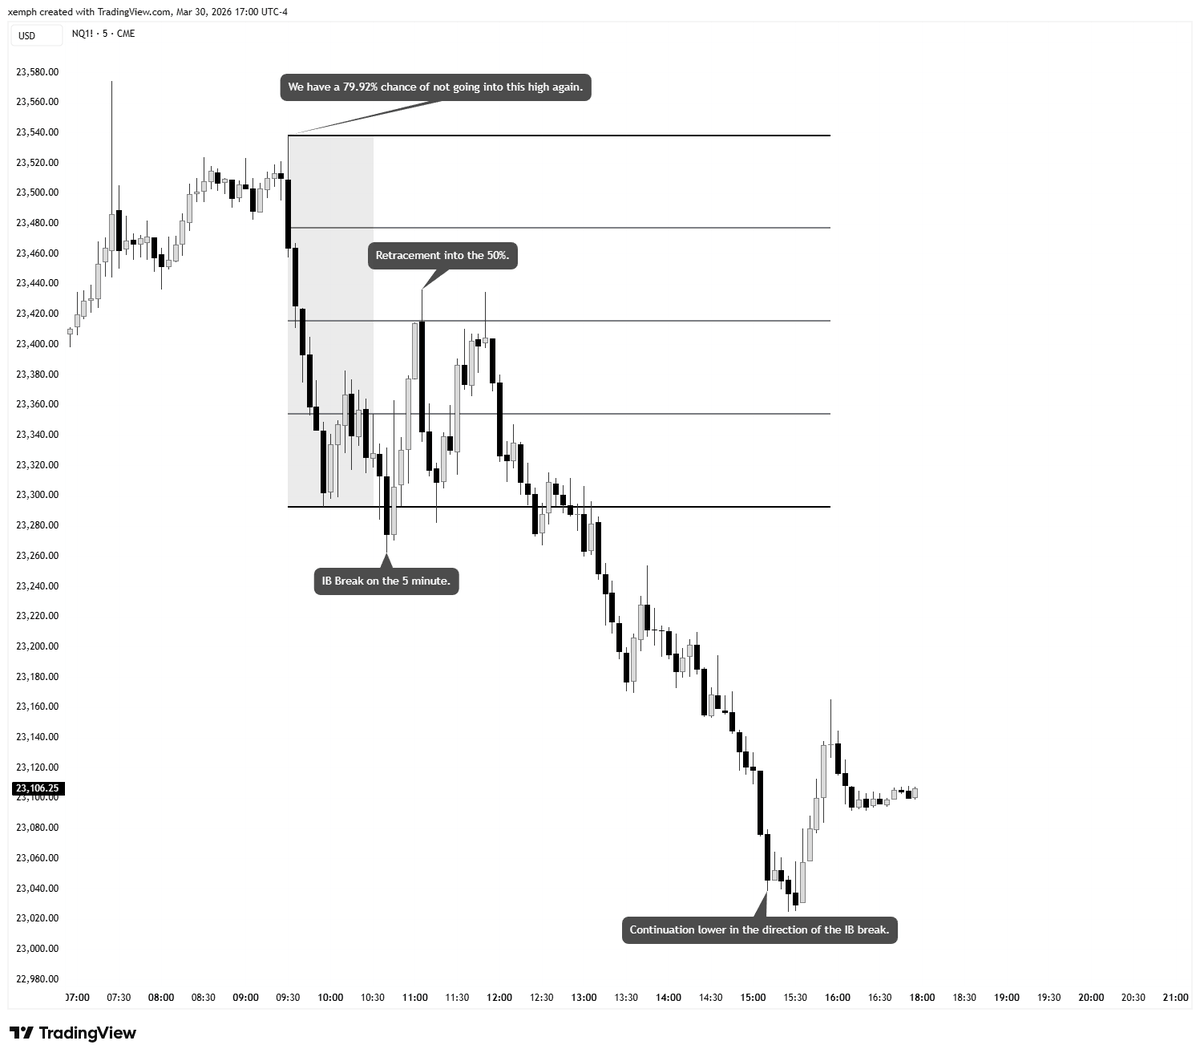
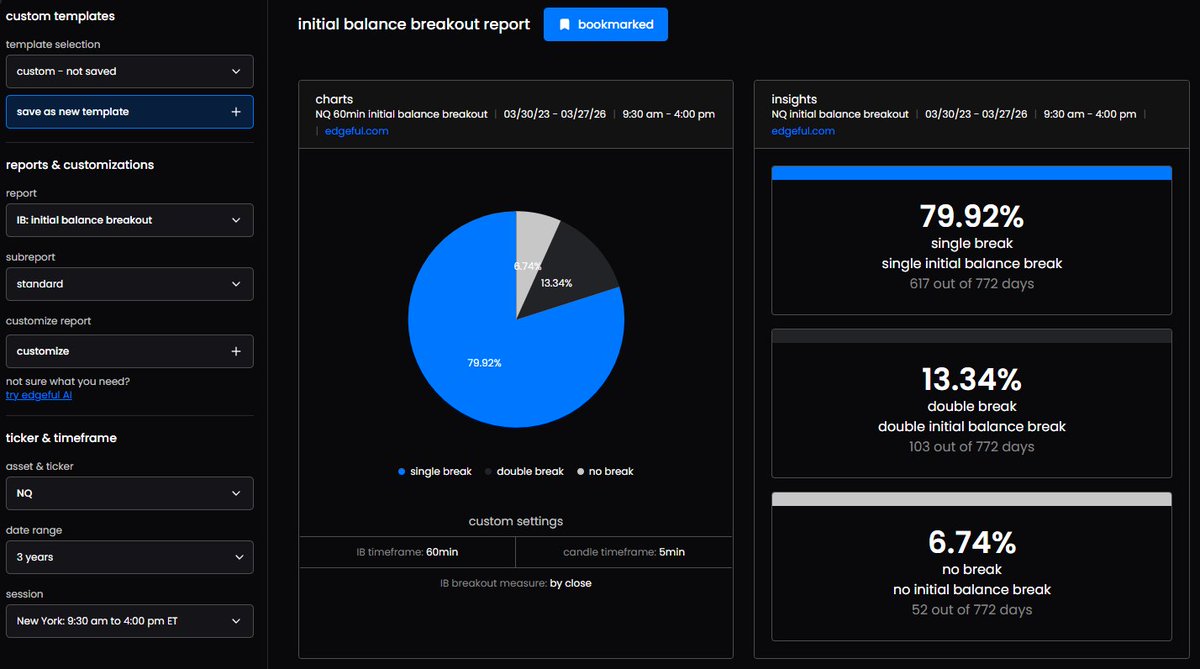
3 years. One pattern keeps repeating, and it’s backed by data from @edgeful:
When the Initial Balance breaks in one direction, it rarely breaks the other side.
That’s why the 25% and 50% retracement levels within the IB are such high-probability entry zones.
Price pulls back into those levels… and the original direction takes control.
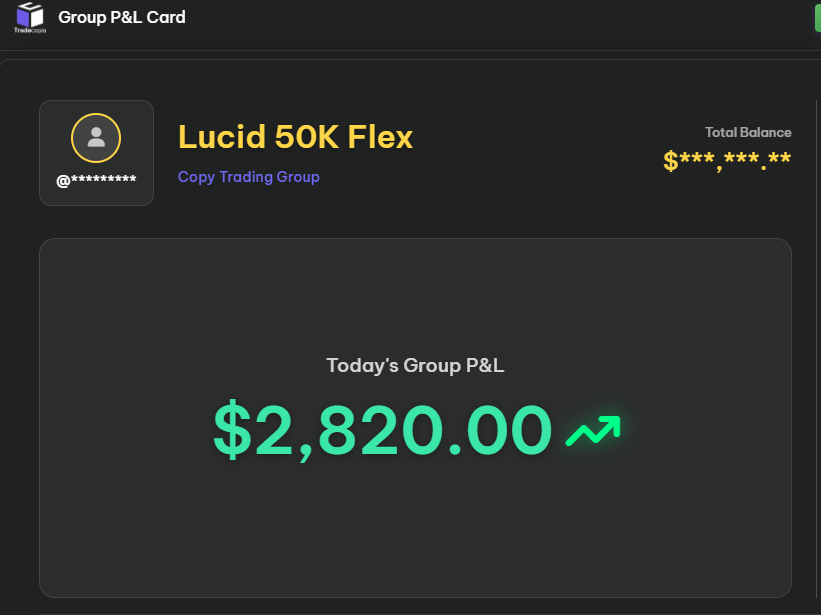
Today on $NQ was a perfect example, clean tap into the 50%, followed by continuation in the direction of the IB break.
Another advantage of this approach is the depth of data behind it, you can combine it with the breakout report and other stats to build a much clearer, more contextual view of the setup.
Tomorrow marks the start of @TheLabLive I’ll be live at 8:00 AM EST.
From now on, expect many more streams from me during the London Session and NY AM, trading live and breaking down the markets together.
youtube.com/watch?v=1SWu0p…
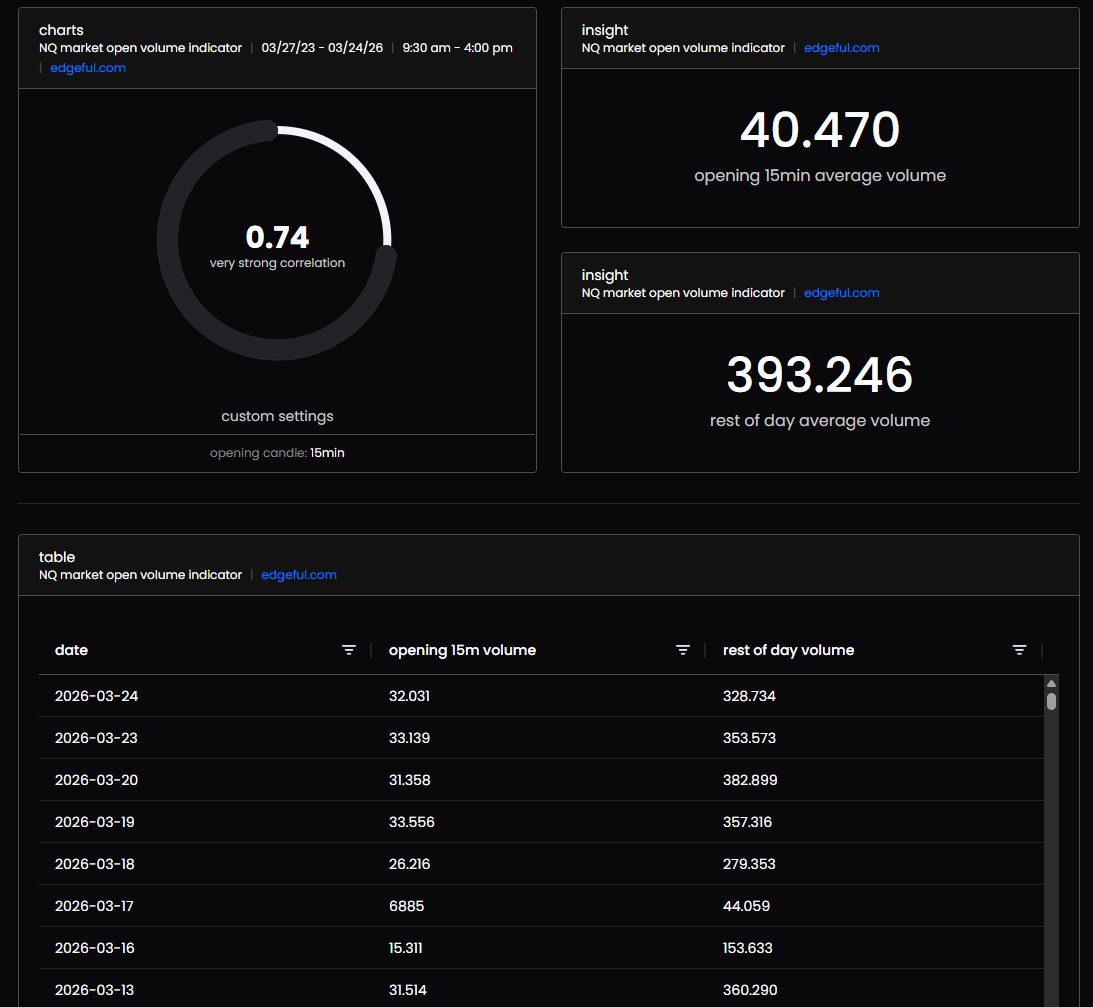
The first 15 minutes of trading tells you everything about the rest of the day.
Check the volume of the first 15-minute candle (9:30–9:45 AM ET) and compare it to the historical average for your ticker.
Significantly above average → expect a directional day
Significantly below average → expect chop, false breakouts, and stop hunts
@edgeful market open volume report gives you the exact average to compare against.
Know the environment before you size up. if volume is low, reduce size or sit out entirely.
Introducing The Lab Live 🧪
The entire team coming to you live on YouTube, every week.
Subscribe: @thelablive" target="_blank" rel="nofollow noopener">youtube.com/@thelablive
OFFICIALLY a mechanical and aerospace engineer.
surreal feeling.
for those of you who don’t know me, i’ve been pursuing a degree in mechanical and aerospace engineering while simultaneously building trading into my full time career.
four years of nonstop grinding. a lot of stressful nights and plenty of moments where quitting felt easier, but in the end it was worth it.
we made it happen.
now onto the next chapter of my life.
officially trading full time.