Aladeen 리트윗함
Aladeen
5.8K posts


@vedikabaisa @lilcosmicowgirl Cool down lady, he is just pulling some strings and doesnt dress the way you think its normal in your mind.
English


Aladeen 리트윗함

She exposed the reality of minorities in Pakistan, showing how restricted their freedom is, and how people teach their children from childhood to hate minorities.
English
Aladeen 리트윗함

A "Muslim" woman from 'Saudi Arabia' arrived in Germany and embraced Atheism.
Upon discovering her newfound beliefs, her brother enlisted the services of a 'hitman' on the dark web to 'eliminate' her. 😢
This is the reality of 'Islam'. 😑
Pseudo Prophet@Pseudo_Prophet_
Muslim girls gang up and beat a white female student in Europe. 🙄 Nothing happened to them, 😶 but the white girl was suspended for complaining about it. 😩
English

The Mughals brought language, food, architecture, music, art and syncretism to India. And they brought Narendra Modi’s party to power economist.com/asia/2026/04/1…
English
Pakistan being a radical country destroys evidence of IVC and its temples let alone claiming it.
Lahore and in many cities in Pakistan has some ancient temples and shrines which are used as dumpyards leave alone cherishing its historical significance.
Dan Qayyum@DanQayyum
This desert in Pakistan was once a river valley. Four thousand years ago people built civilisations here that were among the most advanced on earth. Every single major Indus Valley site sits on Pakistani soil. Mohenjo-daro. Harappa. Mehrgarh. Taxila. Pakistan's birth certificate, written four thousand years before the country had a name. Great work by @TDCPOfficial
English
Aladeen 리트윗함

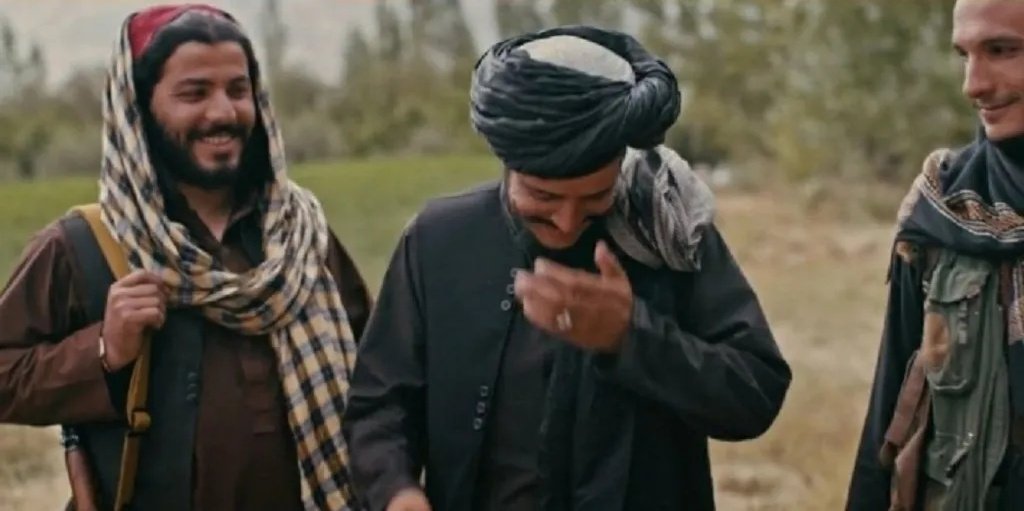
He can wear whatever he likes, while she is buried in a black tent, stripped of choice and reduced to a statue.
Wahabi culture is a curse on humanity, and its poison has rotted our Indus region for far too long.

English
Aladeen 리트윗함

When a computer tracks the Indian classical dancer in this video, it picks up perfect circles, triangles, and curves in every movement. There are exactly 108 of them. All 108 were written into a manual over 2,000 years ago.
That manual is the Natya Shastra. Six thousand verses, written somewhere around 200 BCE. It describes 108 specific dance movements for Bharatanatyam, one of the oldest dance forms in India. Each movement spells out three things: where your hands go, what angle your body holds, and the exact path your legs trace. Roughly 150 step combinations grow out of those 108 base movements. A trained dancer spends years learning 70 to 80 of them.
Watch the dancer's legs in the video. The bent-knee squat creates a diamond shape. Palms together make a triangle. When researchers plotted these positions in three dimensions this year, they found the moving body carves out twisted spirals and bowl-shaped curves, the kind of shapes you see in an engineering textbook, not a dance studio. Every limb holds a specific angle and moves a measured distance.
The rhythm is math too. A 7-beat song gets filled with dance steps of 3 and 4. Scale that to 35 beats and the groups of 3 and 4 repeat five times. Choreographers work out these splits in their heads while performing live. All 108 movements are also carved into the stone walls of a 12th-century temple in Tamil Nadu called Chidambaram, many panels still carrying the original Sanskrit description next to them. A choreography textbook in granite, still legible after 900 years.
A 2013 study put 25 people on a walkway rigged with motion-capture cameras. Every human stride has two parts: when your foot is on the ground and when it swings forward. The ratio between those two parts came out to 1.620. The golden ratio is 1.618. Your foot lifts off at 61.8% of every step you take, and it has done this your entire life. A Bharatanatyam dancer takes that same built-in proportion and amplifies it across 108 movements, each one tracing shapes that were set down in writing over 2,000 years before the tracking software in this video existed.
Massimo@Rainmaker1973
Sacred Geometry in dance forms
English
Aladeen 리트윗함

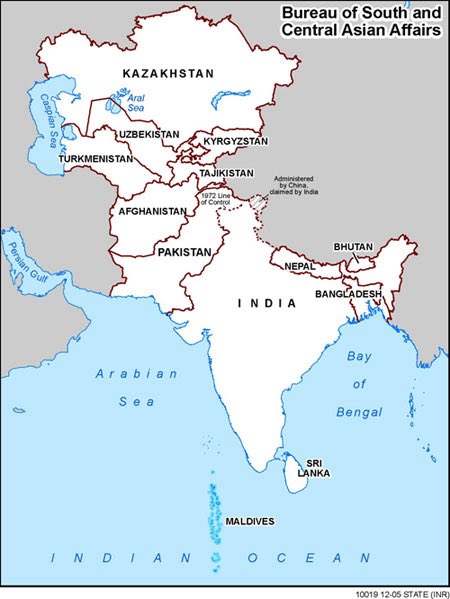
If there were no #Pakistan in this region, believe me, there would be no borders between Central and South Asia. a peaceful region where an Indian could go to #Kazakhstan in his own car without a visa, and I would be able to go to Delhi. Pakistan is the cancer of the region.
English
Aladeen 리트윗함
After the TCS incident, there would be increased scrutiny over Muslim candidates across the country. Recruiters would double-check the backgrounds of Muslim candidates, maybe sometimes even preferring Hindu candidates over Muslims, just to be on the safe side.
But who is to be blamed for this? The only people responsible for this oncoming prejudice against Muslims are the 7 Muslims arrested for sexual abuse, coercion and forced conversion of Hindus working in TCS.
The fact that so many Muslims were working at an IT firm and had the audacity to run a scandal, doing forced conversions, shows that there is no systemic oppression against Muslims in India.
The victims here are the Hindus. Projecting this incident as some sort of Muslim victimhood is treacherous and gaslighting of the highest order.
Yes, there is Islamophobia, but the reason behind Islamophobia are people like these 7 Muslims who were running this forced conversion scandal at TCS.
English
First Mad King and now Mad Knight ...world has gone back to middle ages.
Polymarket@Polymarket
JUST IN: Uganda’s military chief demands $1 billion from Turkey & “the most beautiful woman in that country for a wife,” threatens to close embassy if demands not met.
English
Aladeen 리트윗함

@IndianTechGuide Instead of building sports complex just building a cricket stadium.....atleast Bihar is ahead in this built an entire sports complex at Nalanda.
English

🚨 Bengaluru is getting a massive cricket stadium with a capacity of 80,000 at Suryanagara 4th Phase, Anekal, Bengaluru.
Bids were invited for construction costing 943.46 crore.
For context, Ahmedabad's Modi Stadium was built for under 800 crore.
Designs 👇️


English
Aladeen 리트윗함

When re-entering Earth at over 25,000 miles per hour, this is what Artemis astronauts would have seen and experienced. As their heat shield burns and protects them from the searing heat due to friction with Earth’s atmosphere (this a real footage from Artemis I).
Iromidayo1@Dayoforchrist
@samofolabi Unrelated, but why are people saying that the Artemis II crew’s re-entry to Earth is the most challenging part of the mission?
English
And he got huge balls too.
sammm ☆@onlysammms
somebody on instagram said anant kinda looks like sydney sweeney and i can't unsee it now 😭😭😭😭
English
Aladeen 리트윗함

Ok I am getting tired of this. I wish Pakistan well with the talks but FFS, enough of the Pak nationalism (and Indian alarm). Iceland hosted really important US-Soviet talks in the Cold War. It didn’t change its status. It’s a venue, not a redrawing of the world map.
English
@Rustum_0 Thats Why Al-Khwarizmi translated entire Indian Scientific and Mathematics books and packaged it as Golden age of Islam.
storyofmathematics.com/islamic_alkhwa…
English

“The Hindus believe that there is no nation like theirs, no kings like theirs, no religion like theirs, no science like theirs.”
— Al-Biruni, ca. 1030 CE.
India Plus@india_plus_
🚨Former chairman ISRO S Somanath said science came from Vedas but it was repackaged as western discoveries.🔥🔥 follow @india_plus_
English