Sabitlenmiş Tweet
Mickey
1.6K posts


Mickey
@0xMickey
I don’t follow meta ∿ I rotate it Narrative aware Momentum bends to my entries
Katılım Mayıs 2025
75 Takip Edilen576 Takipçiler


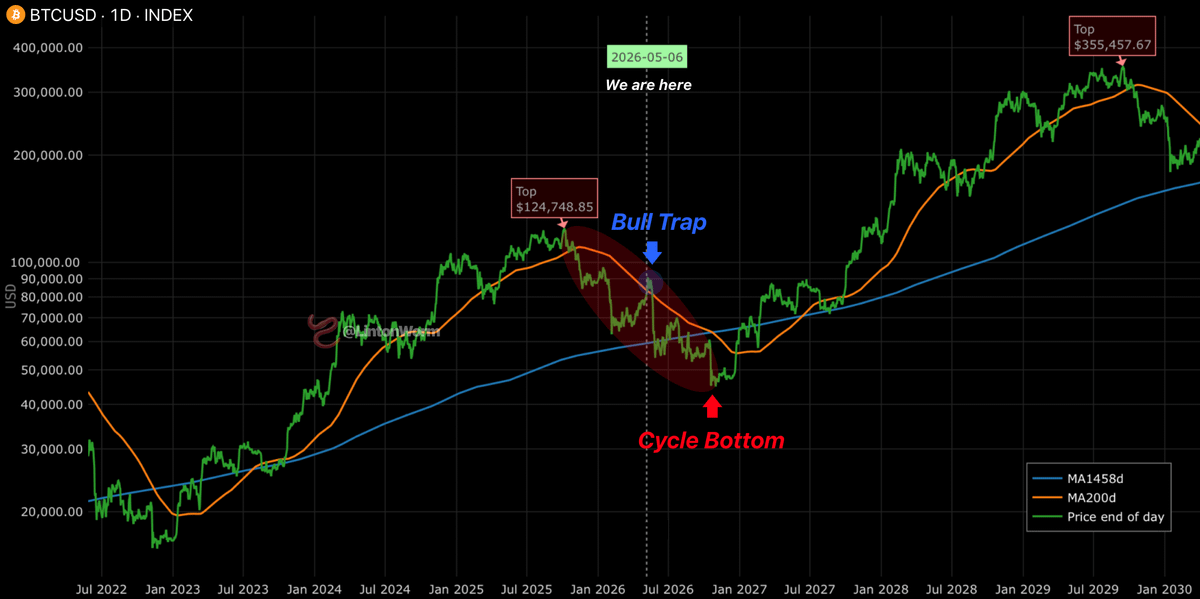
🚨 THIS IS THE FINAL BITCOIN BULL TRAP
Top printed at $124.7k, currently testing the 200DMA from below as resistance
The 4-year MA (1458d) sits at $55-60k - that's where every prior cycle bottom touched before mark-up
If the previous cycle analogy holds, one more bull trap rejection here, then flush into the $45-50k zone by Q4 2026, then the next leg toward $355k by 2029
Patience > panic, the bottom hasn't printed yet
Traders in our TG community already have some interesting setups for upcoming week, come check it out while they are still free:
t.me/TRACE_ACCESS_B…
English
Mickey retweetledi

🚨 $BTC HEATMAP UPDATE (3D) - SHORT SQUEEZE FUEL LOADED
Heatmap structure: $81.5-82k yellow short wall above, $77.8-78k yellow long magnet below, price pinned in between at $81k
The real tell isn't the heatmap alone - it's that 65% of open interest is short positioned with $61B in OI
Daily RSI at 71.5 is stretched but not extreme yet, and the 200 EMA at $82.2k is the gate that hasn't been reclaimed since the October top
Two scenarios: clean break above $82.2k -> 200 EMA reclaim triggers a squeeze through thin air toward $84-85k, OR rejection -> sweep $77.8k longs and reset to $76k support
I called the $80k reclaim setup last week and the structure played out exactly as expected
Follow + notifs on, I will keep you updated
English

🚨 99% OF PEOPLE WILL MISS THIS BITCOIN BOTTOM
1. Selling climax -> Complete
2. Support test -> Complete
3. Previous Support Retest -> In Progress
We are perfectly following Wyckoff Accumulation Schematic so far
Support Test in Phase B and Spring (Bottom) are next
Invalidation = $87k breakout
Follow + notifs on, I will keep you updated
English
Mickey retweetledi
🚨 S&P 500 CRASH INCOMING
$SPX printed textbook Megaphone Pattern fakeout
5-move impulse wave complete and momentum is fading now
I would expect price to return to pattern range soon
Follow + notifs on, I will keep you updated
English
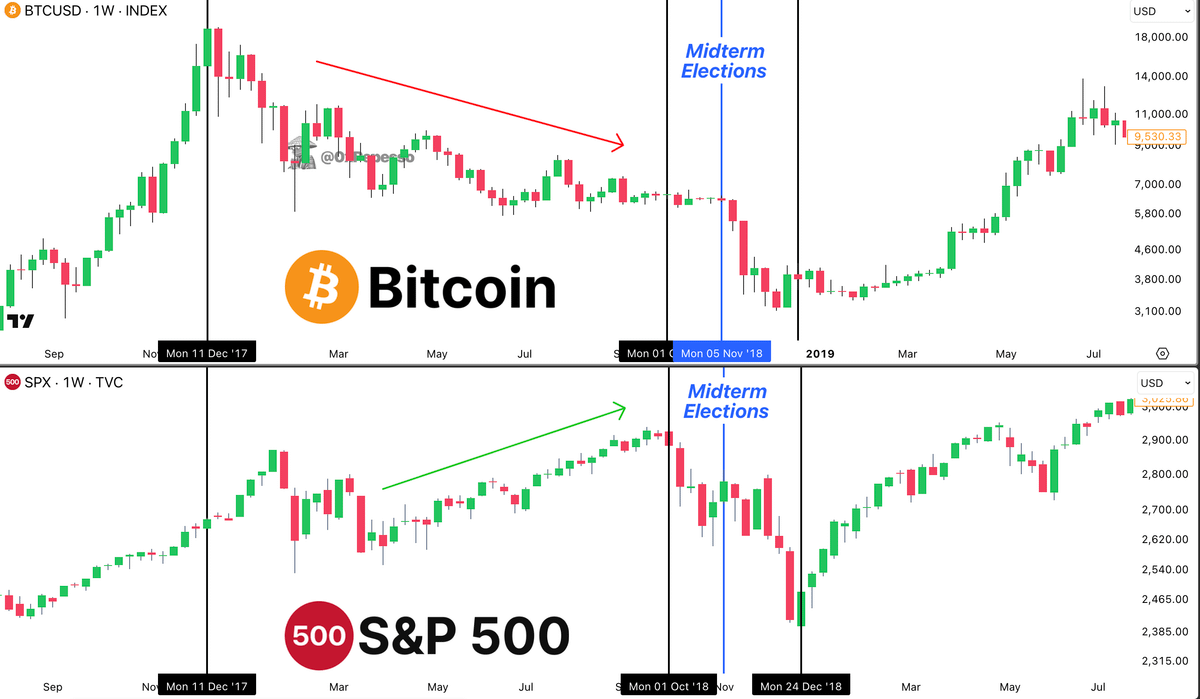
🚨 HOW CAN BITCOIN FALL TO $50k WHILE STOCKS PRINTING ATH?
Look at the chart, exact same scenario printed in 2018:
1. It was a bear market year for BTC
2. Stocks were climbing higher and higher while BTC was printing lower highs
3. Major crash around midterm elections
I would expect SPX/Gold to break lower soon and recession trade to kick in
Then, BTC may dump WITH equities short term as a risk asset and decouple on the way up once capital rotation finishes
Remember, I was the only one publicly calling the exact bottom at $16,000 three years ago and the top at $126,000 in October
Follow + notifs on, I will keep you updated
Pepesso@0xPepesso
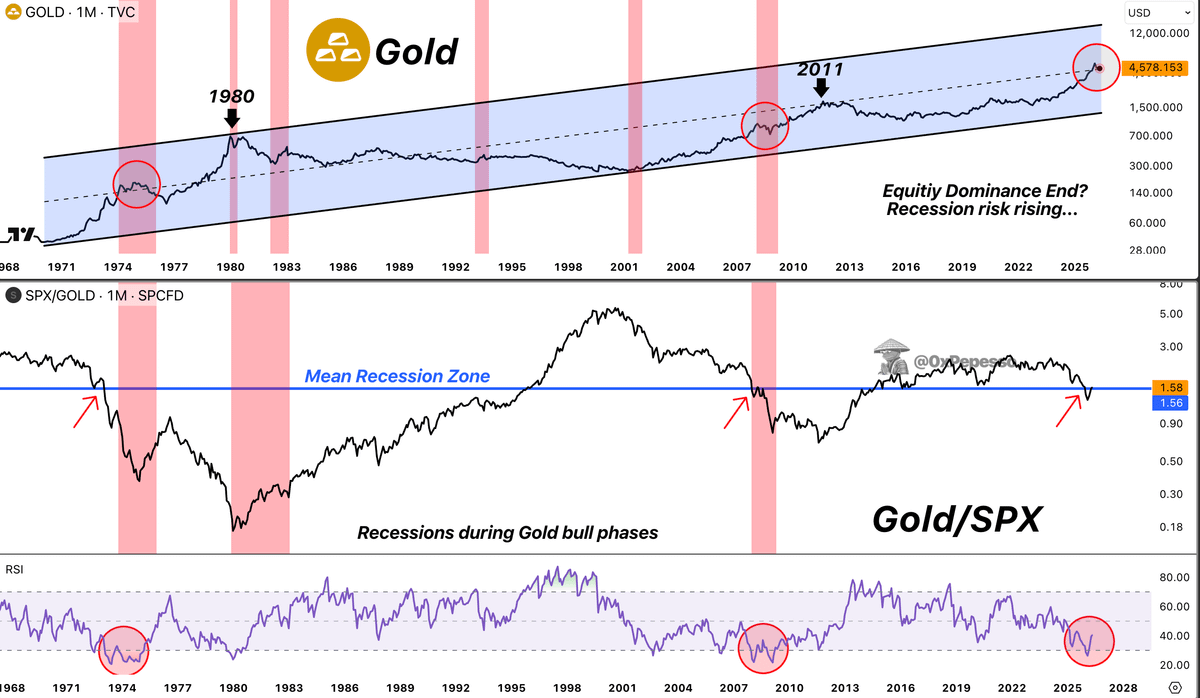
🚨 SPX/GOLD JUST HIT THE MEAN REVERSION ZONE Bitcoin will feel it first because major market shifts started exactly from this zone Look at the macro setup: > SPX/Gold ratio at 1.56 - exactly where every major regime change started > 1973, 2008, today - same level, same divergence > Each prior touch killed equity dominance and rotated capital into hard assets This is the chart that decides what crypto does next As you may know, BTC behaves like both a risk asset AND a hard asset - which side wins depends on macro Two scenarios from here: 1. Mean reversion holds -> equities lose leadership -> capital floods into gold first, then BTC catches the second-leg rotation as the "digital hard asset" trade. This is the bullish case nobody is pricing in 2. SPX/Gold breaks lower -> recession trade kicks in -> BTC dumps WITH equities short term as a risk asset, then decouples on the way up once capital rotation finishes The midterm year correction historically resolves with one final leg lower before the rotation completes If history rhymes, BTC sees its real bear market low alongside the equity flush, then runs with gold into 2027-28 Remember, I was the only one publicly calling the exact bottom at $16,000 three years ago and the top at $126,000 in October Follow + notifs on, I will keep you updated
English
🚨 BITCOIN IS PERFECTLY REPEATING 2022 SCENARIO
Look at the side-by-side weekly chart:
2022: cycle top -> MA ribbon flipped resistance -> bull trap rejection at EMA50/100 -> final flush to $15.5k bottom
2026: cycle top at $126k -> MA ribbon flipped resistance -> currently testing EMA50/100 from below at $80.8k
The setup, the structure and the moving averages are aligned exactly the same way
Last cycle the bull trap rejection at the MA cluster triggered a 60% drop into the actual bottom
If the analogy holds, the projected target sits in the $40k-50k zone by Q4 2026
Two scenarios from here:
1. Reject from EMA50/100 confluence around $81-83k -> repeat the 2022 leg -> flush into $40-50k zone
2. Weekly close above the EMA200 -> invalidates the analogy -> bear market structure breaks
Invalidation is clean: a weekly close above $90k flips the entire bear thesis
Traders in our TG community already have some interesting setups for upcoming week, come check it out while they are still free:
t.me/TRACE_ACCESS_B…
Pepesso@0xPepesso
🚨 BTC IS FORMING A TEXTBOOK BEAR FLAG ON THE DAILY Look at the structure since the February flush: 1. Sharp impulse down from $98k to $60k 2. Rising channel grinding back into the MA ribbon 3. Price testing the 100/200 EMA confluence right now at $78.5k That's the exact anatomy of a bear flag - aggressive drop, slow rising consolidation, retest of broken support from below Pay attention to MA ribbon overhead: flat 200DMA acting as resistance, classic bear market behavior I see two scenarios here: 1. Reject from the EMA cluster and lose the channel low -> measured move targets $50-55k 2. Break above the 200DMA with a daily close -> flag invalidates and we get a potential squeeze toward $85-88k As for me, the lower-probability play is the breakout Bear flags resolve to the downside ~70% of the time historically, and BTC has zero macro tailwind right now to flip the script Remember, I was the only one publicly calling the exact bottom at $16,000 three years ago and the top at $126,000 in October Follow + notifs on, I will keep you updated
English
Mickey retweetledi

Mickey retweetledi

🚨 S&P 500 IS WALKING STRAIGHT INTO A WYCKOFF TRAP
This is one of the oldest market structure models in history. And right now the S&P 500 is playing it out perfectly
Preliminary Supply. Buying Climax. Upthrust. Post-Distribution
Every phase has printed exactly where the model predicted
We are now entering the Weakness phase - and if the structure holds, the target sits at 4,180
The market just hit new all-time highs while oil is above $120 and geopolitical risk is at decade highs
That's not strength. That's the last trap before the drop
NOTIFS ON!
NoName@WhaleNoName
🚨 MY PREDICTIONS FOR THE NEXT 3 YEARS 🚨 2026: 1. BTC drops to $52,000 2. S&P falls to 5,800 3. Oil stays above $110 for two quarters 4. First G7 country enters technical recession 5. Fed Chair transition triggers the most volatile quarter in a decade 2027: 1. Fed pivots - 3 cuts in 12 months 2. BTC bottoms in Q1, doubles by Q4 3. Dollar reserve currency debate hits mainstream media 4. Real estate crashes in at least 2 major US cities 5. People who accumulated in 2026 go completely silent on social media 2028: 1. BTC crosses $280,000 2. S&P pushes to 9,500 3. Fed balance sheet hits $12 trillion 4. AI boom starts showing up in actual GDP numbers 5. The people who bought in 2026 will be the new 2017 legends Bookmark this Come back in 2028
English
🚨 BTC IS PRINTING THE EXACT SAME BULL TRAP
Look at the structure on the daily:
> January 2026: rallied into $99k zone, printed bull trap, flushed to $60k
> Now: rallied into $80.6k zone and testing the same supply level, setup is identical
The $80.6k zone matters because that was the breakdown level from the January flush
Resistance flips to support, then back to resistance - textbook bear market behavior
Two scenarios from here:
1. Reject from $80.6k cleanly -> repeat the January playbook -> measured move targets the $61k support zone again
2. Daily close above $81k -> flips the level back to support -> squeeze toward $84-86k opens up
Invalidation is simple: a clean daily close above $81k-82k kills the bull trap thesis entirely
I called the January top at $99k before it printed, and I'm calling this one before it confirms
Follow + notifs on, I'll signal the moment the rejection prints
English
🚨 $BTC 24H HEATMAP UPDATE
Below: $77.9-78k - dense long liq cluster, fresh from yesterday's chasers
Above: $79.7k + $80.5-81k + $82.2k - three layered short clusters stacked
The shorts are the bigger fuel pile this time
If we lose $77.9k first, longs flush hard but the next bounce may squeeze through ALL three short layers
If we hold and reclaim $79.5k, the squeeze targets ~$81k
My lean is sweep $77.9k longs first to bait the bears, then rip through the short ladder
Watch the reaction at $79.5k - that's the trigger
Traders in our free TG community already have some interesting setups for upcoming week, come check them out:
t.me/TRACE_ACCESS_B…
English
🚨 $BTC HEATMAP UPDATE (24h)
Two fresh liquidation magnets framing the price right now:
Resistance: $80.5-81k - dominant short liquidity, the main magnet above
Support: $77.8-78.2k - dense long liquidations, sitting literally 1% below price
Both walls within 3% range = stop hunt setup of the week
This is exactly what algos LOVE - sweep one side, reverse, sweep the other
As you may know, the market always hunts the freshest pile first
This is where patience pays: don't trade the middle, fade the sweeps
Follow + notifs on, I will keep you updated
English
🚨 $BTC LIQUIDATION MAP UPDATE
Below - $6.8B in long liquidations
Above - $2.6B in short liquidations
3 : 1 imbalance is the tell
Biggest long cluster sits at $77-78k with $300M stacked literally 1% below price
Shorts above thin out above $82.5k - basically no liquidity past that
As you may know, market always sweeps the bigger pool first
The path of least resistance is down
Follow + notifs on, I will keep you updated
English
🚨 $BTC IS FORMING A TEXTBOOK BEAR FLAG
Flat 200DMA overhead = classic bear market resistance
Sharp drop from $98k to $60k -> rising channel grind -> now retesting the 100/200 EMA confluence at $78.5k from below
Two scenarios:
1. Reject from EMA cluster -> lose channel low -> measured move targets $50-55k
2. Daily close above 200DMA -> flag invalidates -> squeeze toward $85-88k
Bear flags resolve down ~70% of the time and BTC has zero macro tailwind right now to flip it
I called the $16k bottom 3 years ago and the $126k top in October
Gain real edge in trading by joining a free community of people who live and breathe crypto:
t.me/TRACE_ACCESS_B…
Linton Worm (🍏,🪱)@LintonWorm
🚨 THIS IS THE MOST IMPORTANT ZONE FOR $BTC > Unfilled CME gap sitting at $80-82k from the February crash > Volume profile shows a massive low-volume node above current price > Price grinding right into both at the same time This is the exact spot smart money fills before the next leg Two scenarios from here: 1. Gap fills around $81k -> bull trap rejection -> flush back through the volume void into $66-68k support fast 2. Clean break above $82k with volume -> invalidates the trap, $85-88k retest opens up As for me, scenario 1 is more likely as $BTC still doesn't have enough macro tailwind for powerful breakout I've called exact bottom at $16,000 three years ago and the top at $126,000 in October Follow + notifs on, I will keep you updated
English
🚨 SPX/GOLD JUST HIT THE MEAN REVERSION ZONE
Bitcoin will feel it first because major market shifts started exactly from this zone
Look at the macro setup:
> SPX/Gold ratio at 1.56 - exactly where every major regime change started
> 1973, 2008, today - same level, same divergence
> Each prior touch killed equity dominance and rotated capital into hard assets
This is the chart that decides what crypto does next
As you may know, BTC behaves like both a risk asset AND a hard asset - which side wins depends on macro
Two scenarios from here:
1. Mean reversion holds -> equities lose leadership -> capital floods into gold first, then BTC catches the second-leg rotation as the "digital hard asset" trade. This is the bullish case nobody is pricing in
2. SPX/Gold breaks lower -> recession trade kicks in -> BTC dumps WITH equities short term as a risk asset, then decouples on the way up once capital rotation finishes
The midterm year correction historically resolves with one final leg lower before the rotation completes
If history rhymes, BTC sees its real bear market low alongside the equity flush, then runs with gold into 2027-28
Remember, I was the only one publicly calling the exact bottom at $16,000 three years ago and the top at $126,000 in October
Follow + notifs on, I will keep you updated
English
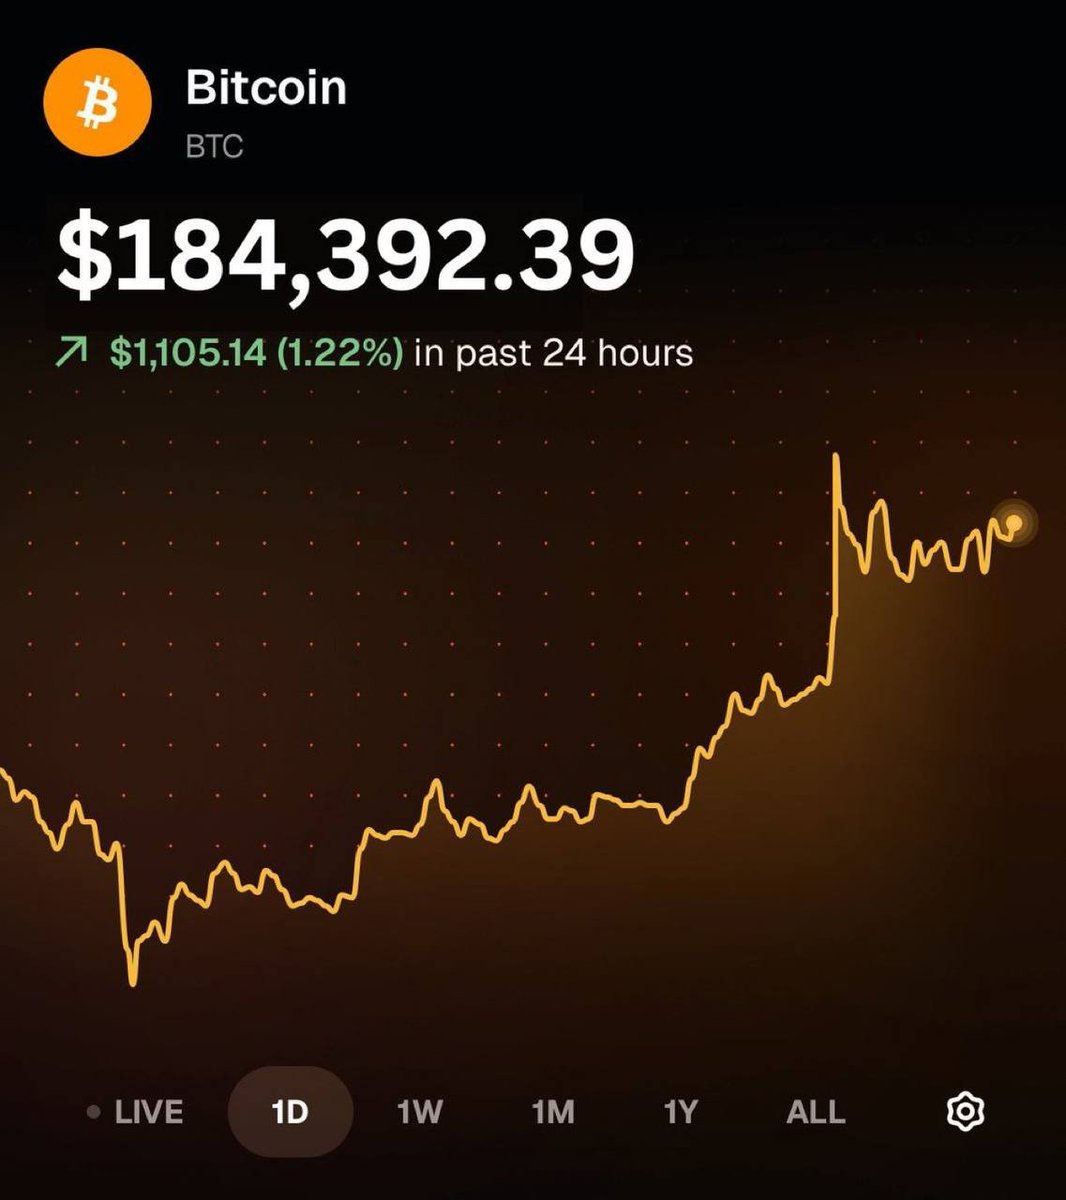
IMAGINE THIS:
You wake up and see BTC at $180,000
What do you do?
P.S. I’d instantly dump my bags
NoName@WhaleNoName
🚨 MY PREDICTIONS FOR THE NEXT 3 YEARS 🚨 2026: 1. BTC drops to $52,000 2. S&P falls to 5,800 3. Oil stays above $110 for two quarters 4. First G7 country enters technical recession 5. Fed Chair transition triggers the most volatile quarter in a decade 2027: 1. Fed pivots - 3 cuts in 12 months 2. BTC bottoms in Q1, doubles by Q4 3. Dollar reserve currency debate hits mainstream media 4. Real estate crashes in at least 2 major US cities 5. People who accumulated in 2026 go completely silent on social media 2028: 1. BTC crosses $280,000 2. S&P pushes to 9,500 3. Fed balance sheet hits $12 trillion 4. AI boom starts showing up in actual GDP numbers 5. The people who bought in 2026 will be the new 2017 legends Bookmark this Come back in 2028
English
Mickey retweetledi
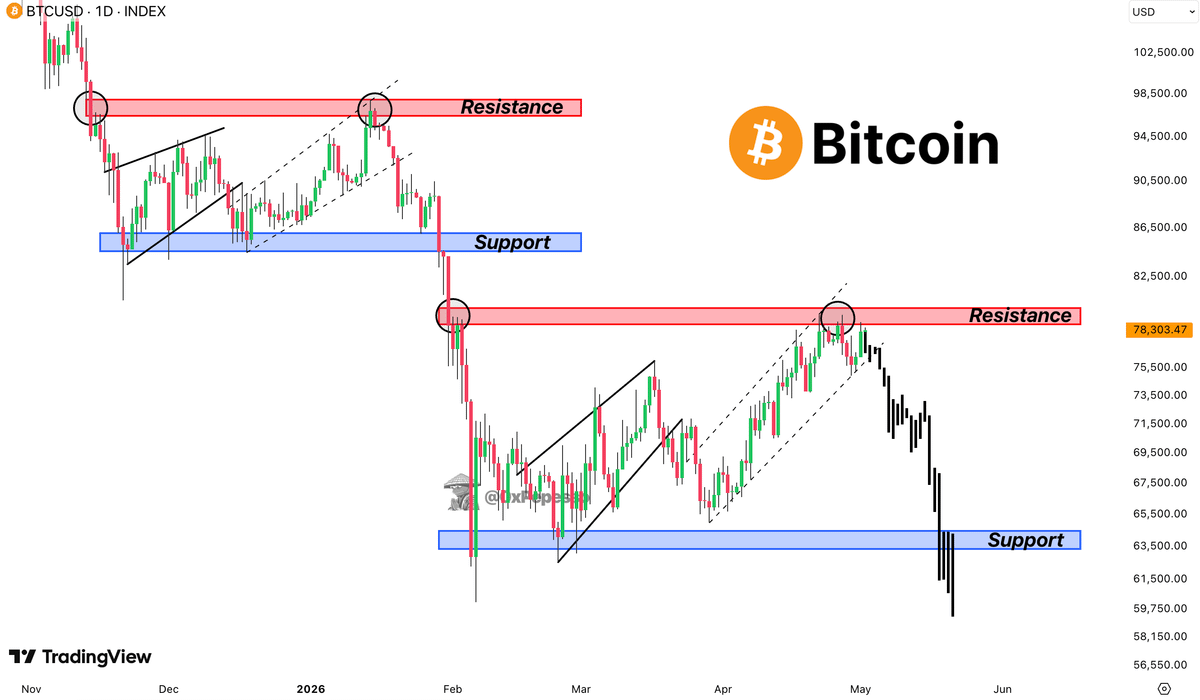
🚨 BTC PERFECTLY FOLLOWING BULL TRAP I'VE CALLED LAST WEEK
Same range structure, second time in 5 months:
Bull Trap 1: $97k rejection -> $60k flush
Bull Trap 2: $80k rejection -> currently fading
I flagged this exact Bitcoin setup when price was still grinding at $72k, look at quoted chart
Two scenarios from here:
Hold $78k mid-range -> another fakeout rally before the real break, buys time
Lose $78k -> measured move repeat targets $63-65k support, lose that and $55k opens up
Remember, I was the only one publicly calling the exact bottom at $16,000 three years ago and the top at $126,000 in October
Follow + notifs on, I will keep you updated
English