Sabitlenmiş Tweet
ColleNC
64.5K posts


You are comparing apples and oranges bud.
Take a look at this chart and tell me if you think we look like we are in 2018 and 2022?
Or if we look like we are in 2016 and 2020?
You think I’m being an ass commenting on your posts but I am honestly trying to help you.
All of these fundamental market charts all line up with staggering confluence, and it’s all centred around business cycle.
This chart makes it painfully clear we are not in the same style bear market that we have typically seen… and this cycle is still ongoing.
So you cannot just look at previous cycles and assume the same outcome.
This is a totally different setup and ignoring it is unwise mate.
Chart this yourself and see what you think 🤝

English

$BTC
2018 bear market had 5 relief rallies before the final bottom.
Average size: +50%. Average duration: 27 days.
2022 bear market had 5 relief rallies before the final bottom.
Average size: +34%. Average duration: 30 days.
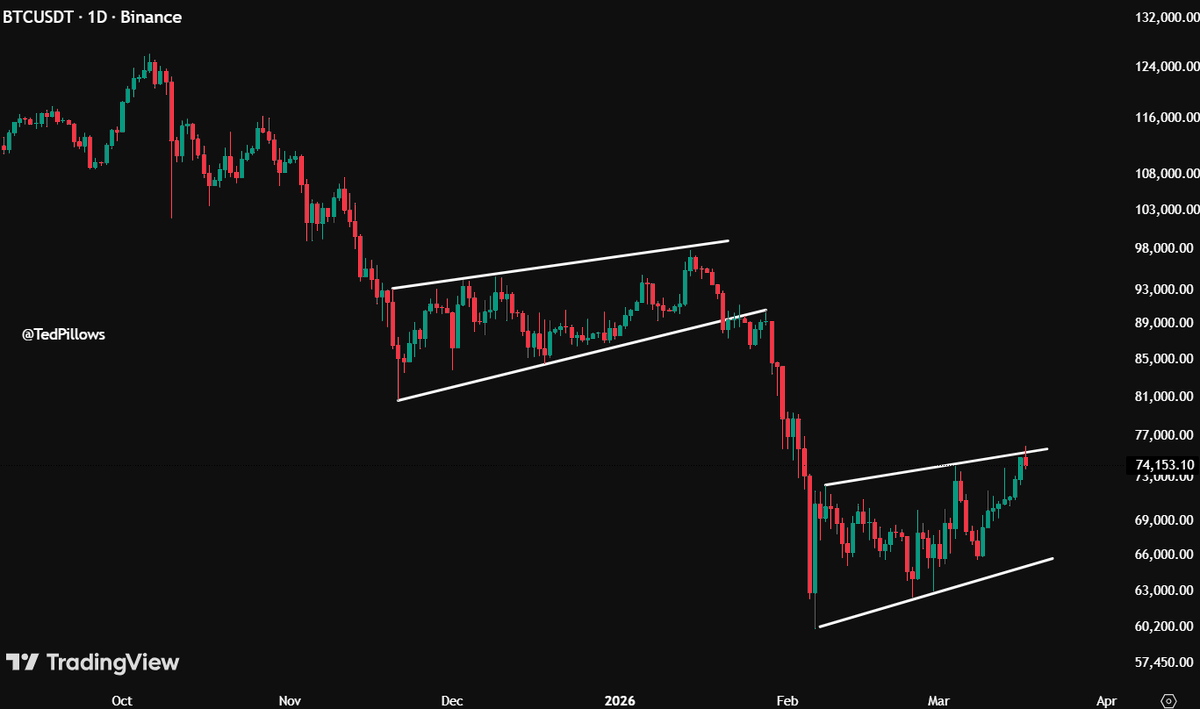
2026 bear market has had 2 so far.
Average size: +24%. Average duration: 47 days.
Notice the pattern. Each cycle the rallies got weaker and slower.
That likely means for the rest of this bear, we get more sideways chops and boring ranges as the volatility on the way to the bottom reduces.
But interestingly, both bears had 5 before they were bottomed.
Now to see if history repeats.. 🪬

English

#Bitcoin
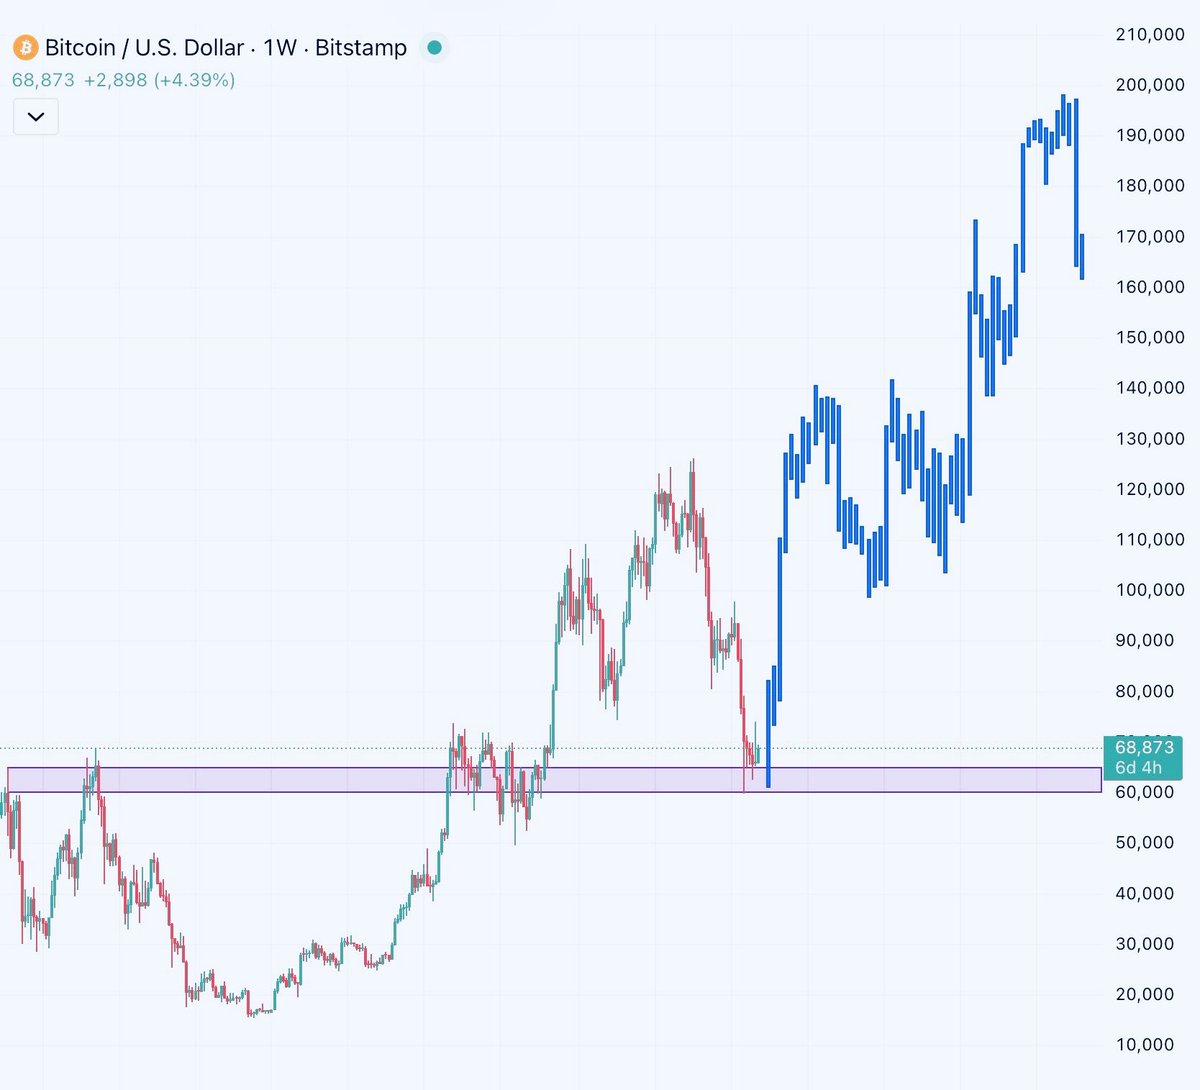
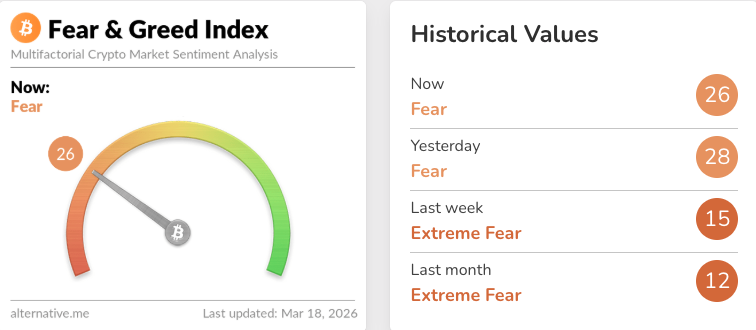
Price reached the green support band a month ago,
a level historically associated with cycle lows.
Is this cycle bottom already behind us,
or could another leg down still unfold this year?

English

FACTS: Binance Founder CZ says
"if you sold the dip, you need to unfollow the weak minds, and follow right people."


English
@rektfencer @thejbullmarket My god you guys are the worst accounts in this space.
Literal braindead slop.
“NO OnE Is ReADY FoR WHaT Is CoMInG”
Who tf follows this shit.
English

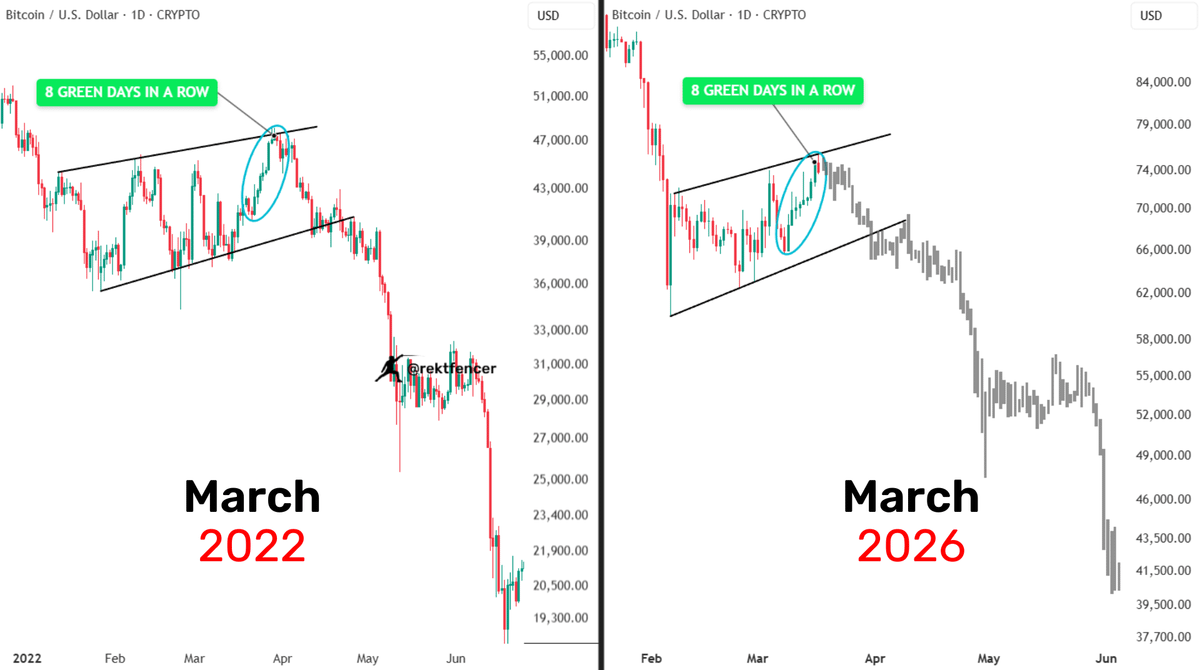
Bitcoin just printed 8 consecutive green daily candles.
Looks exactly like March 2022.
The next crash will be the most painful one.
You aren't ready for what's coming.
English


@Ze3k7 It’s a very good thing that the majority discount this and believe in the 4 year cycle.
English
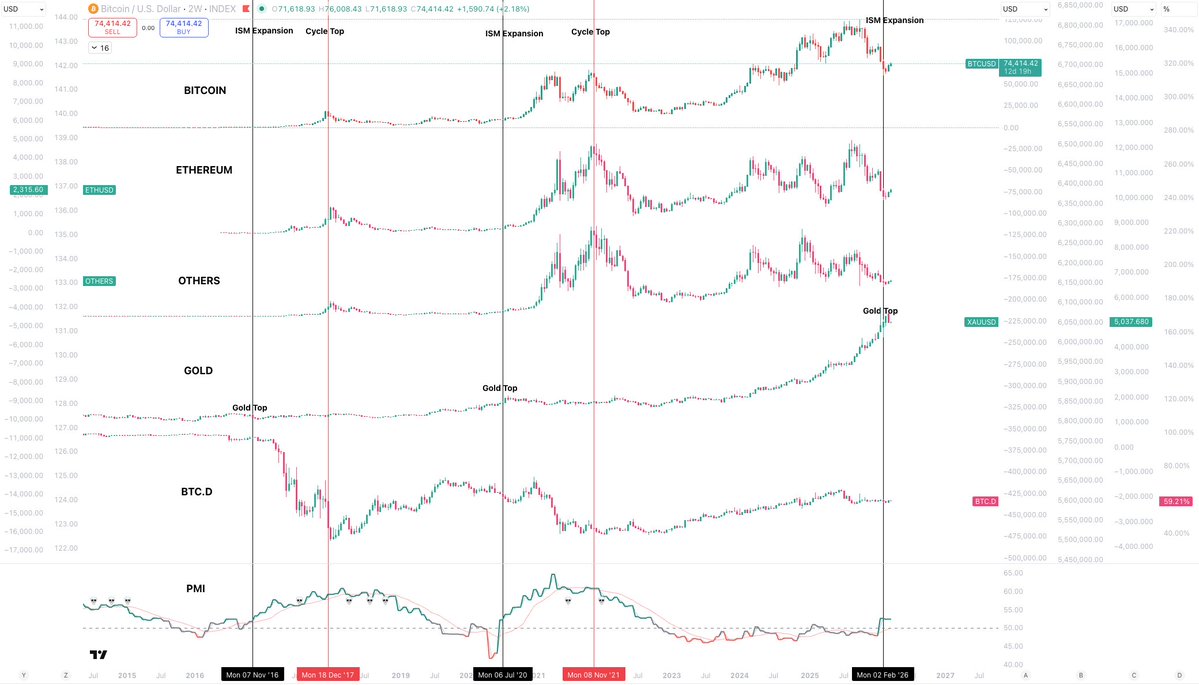
This cycle IS different.
And this is the only chart you need to understand that.
The 4 year cycle has NOTHING other than two sample sizes to provide itself validation.
It is rooted in nothing other than time.
Whereas the business cycle has every single major market chart providing it confluence.
Every single cycle has been the same, and it is not about time...
It is about the macro and business cycle.
This chart makes it clear as day.
1. Gold runs during economic contraction(uncertainty)
2. Gold tops when ISM breaks into expansion(certainty)
3. Risk assets enter their true bull cycle
4. BTC.D begins its end of cycle downtrend
Every single one of these fundamental charts lines up...
And that is because the cycle is actually governed by the business and economic cycle, that is inherently linked to actual economic and liquidity performance.
The reason next to no one can see this is they are totally consumed by the Bitcoin chart, and the 4 year cycle.
Because we have never had a cycle like this, that has been lengthened due to the longest ever business cycle contraction...
No one can fathom this outcome.
Humans have a very hard time believing in something that has not happened before, and they will always side with something that has happened.
And this will be the exact reason so many will be caught offsides here...
Because we are not heading lower.
I welcome any and all bears to debate me on this, to provide a counter thesis to this...
But I know they won't because you can't.
Why do you think this was the weakest cycle so far?
Why did almost no alts break higher?
Why has Gold gone on its largest run ever?
Because the business cycle contracted for the longest time ever.
Everything you need to understand this is right in front of you.
English
@TedPillows Don’t be so sure, bro)) The market isn’t that simple. We’re about to go where no one expects. We’re going up - hard - so fast that no one will have time to get in.
English