
@R ƎVO⅃ UTION
1.5K posts


Bitcoin dumped to $77K for a reason.
History is repeating itself. Everything is going exactly as I predicted:
$82K resistance rejected as expected.
Now BTC is following the same path:
$77K → $73K → $68K → $71K → $60K
Next stops:
→ $70K in days
→ Market cycle bottom in autumn
Remember, I was the only one publicly calling the exact bottom at $16,000 three years ago and the top at $126,000 in October.
If you missed those calls, don’t worry. I’ll call the next one too.
Turn notifications on. If you’re not following yet, you’ll understand why that was a mistake later.
Alex Mason 👁△@AlexMasonCrypto
🚨 READ THIS CAREFULLY Everyone thinks Bitcoin is breaking out. The chart says something completely different. Bitcoin is now forming a Wyckoff accumulation pattern. Most traders see accumulation and think the danger is over. That’s exactly how they get trapped. Bitcoin has already completed the first major reaction after the local high near $82.5K. That is the Relief Rally phase. And historically, this stage is followed by downside. But the setup is not that simple: - Drop toward $60K (finished) - Secondary Test formation (completed) - Bounce back above $75K (done) - Re-sweep of the lows (next) - Cycle bottom formation (coming) That’s how accumulation works. It doesn’t reward people who chase every bounce. It rewards people who understand the structure. Most traders only think in one direction: “BTC is pumping. Bottom is in.” Wrong. Real accumulation is messy. It shakes out early buyers. It traps breakout traders. It forces people to sell the bottom twice. That’s why my main focus is still the same: A potential <$50K bottom. Not because Bitcoin is dead. Because this is where the real accumulation phase can finish. For the record, I was the only one publicly calling the exact bottom at $16,000 three years ago and the top at $126,000 in October. If you missed those calls, don’t worry. I’ll call the next one too. Turn notifications on. If you’re not following yet, you’ll understand why that was a mistake later.
English


@Katalizatror88 @hun_darlin nem tudom, nekem bejön ez a laza európai stílus. mennyivel jobb a közhangulat, mint a kommunista orbán uralma alatt, nem?
Magyar

@hun_darlin Kíváncsi vagyok a feministák és liberáltak mikor unják meg az MP-re élvezést.
Magyar

@cryptofergani omg, i'm also bullish on crypto (btc) but this type of bullshit is too much for me. sorry
English

BILLIONAIRE TIM DRAPER SAID:
TRILLIONS ARE ABOUT TO FLOW INTO BITCOIN, AND USD WILL NO LONGER BE ACCEPTED, AND IT WILL DIE
“BITCOIN IS GOING TO HIT $10,000,000”
HE KNOWS WHAT'S COMING 🚀
English

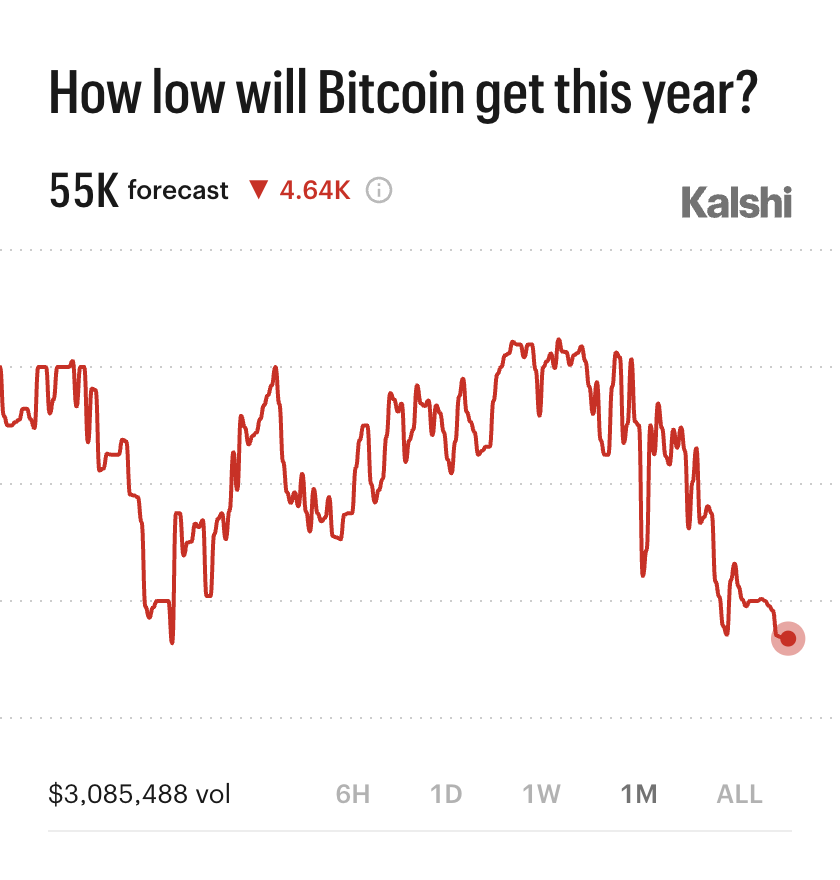
BREAKING: Our traders forecast Bitcoin will crash to $55,000 this year

English
@pointux kopirnyón és a kattosokon kívül ki akarja ezek után orbit újra miniszterelnöknek?
Magyar


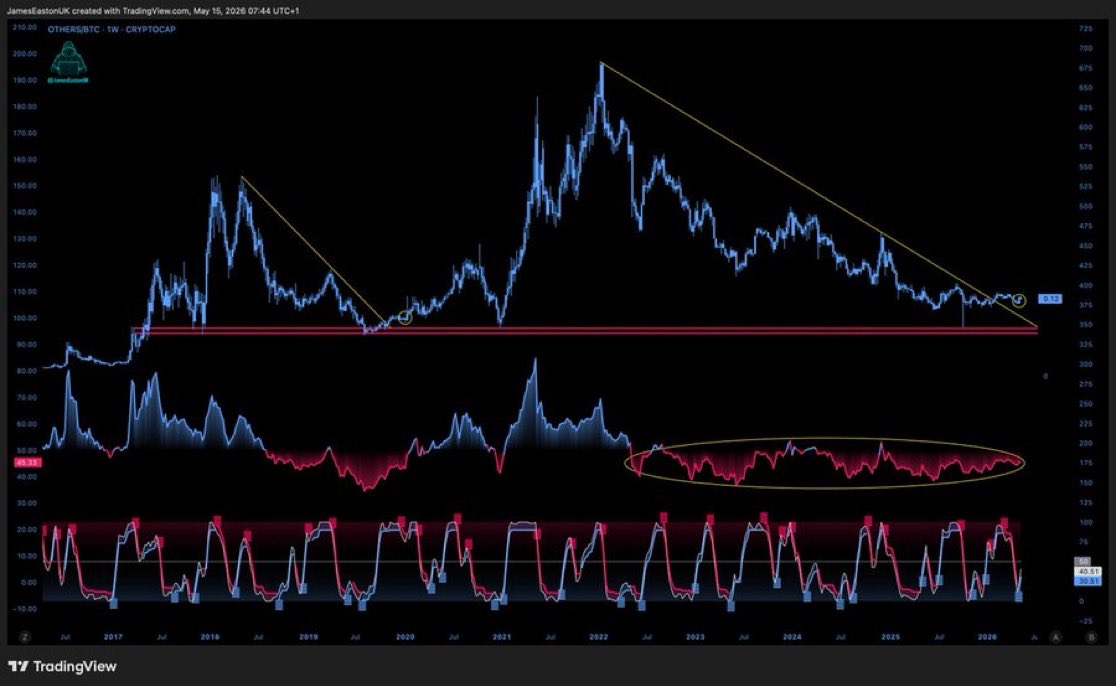
Bitcoin just broke a 14-year support.
For the first time in history.
2014 → 2018 → 2022 → 2026
Every cycle, this line held.
Until now.
This is the signal that the capitulation phase has begun.
For the record, I was the only one publicly calling the exact bottom at $16,000 three years ago and the top at $126,000 in October.
If you missed those calls, don’t worry. I’ll call the next one too.
Turn notifications on. If you’re not following yet, you’ll understand why that was a mistake later.
Kalshi Crypto@Kalshi_Crypto
BREAKING: Our traders forecast Bitcoin will crash to $55,000 this year
English
@darth_orban_ Vektor Orban is a fckn bastard. Hope he goes to prison
English

INSIDER INFO:
Viktor Orbán still uses the security detail assigned to him and travels everywhere in a CONVOY WITH SIRENS BLARING.
English
@grishcorb Akkor már 1 millióan sincsenek, mivel 2.2 volt a vásárolt, duplán számolt és hazudott számokkal együtt is
Magyar

@0xChiefy no one ever knows where the btc price going, but now you're going to tell us what a genius👏
English

Bitcoin is now in the $78,000–$82,000 resistance zone.
Most traders still think this is the start of a new bull run.
But next week, resistance will flip into bearish support, and $BTC will dump back to $60,000.
I perfectly predicted the Bitcoin bottom in 2022 and the top in 2025.
The same cycle structure is forming again in 2026.
Follow now and turn notifications on before it’s too late.
English
@GordonGekko exactly. chit-chat everywhere about the lower prices, recession and collapse. this is the best counter-indicator
English


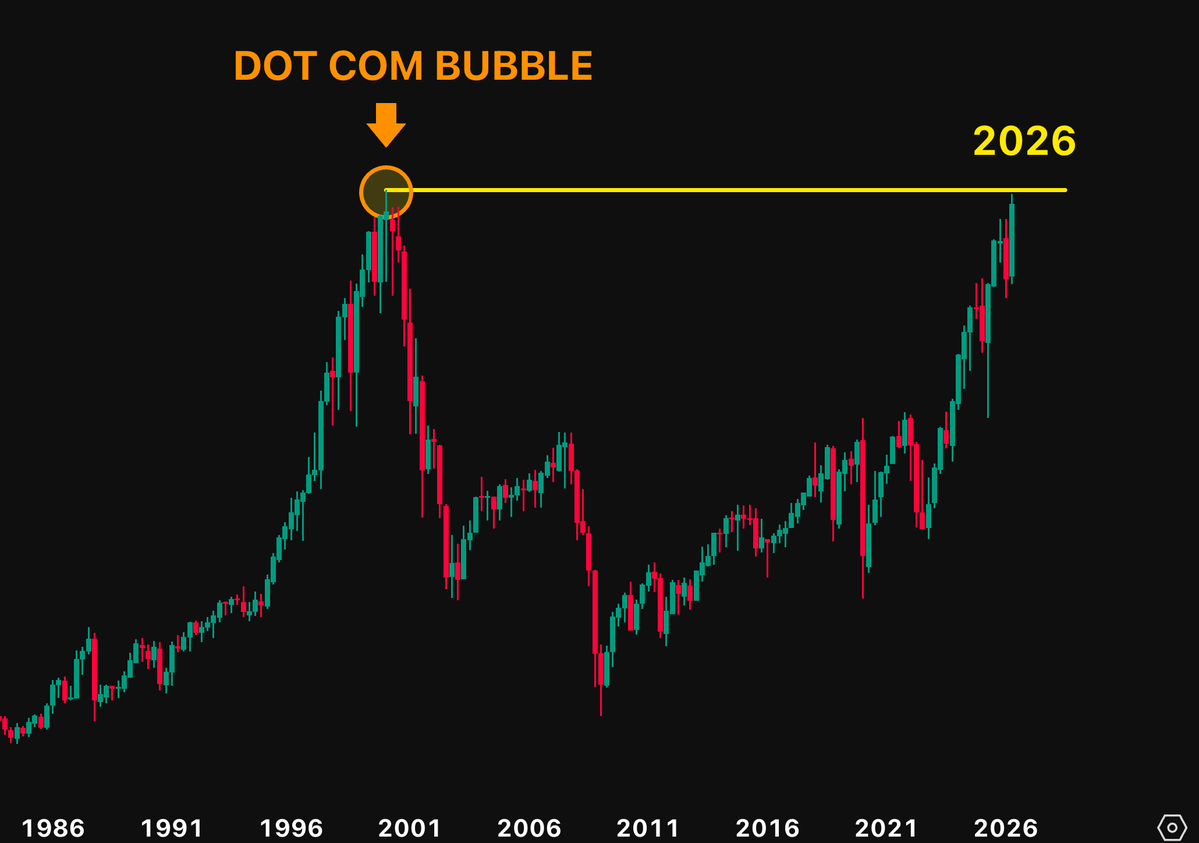
This is NOT good
S&P 500 vs M2: most overvalued since 2000 dot-com bubble
Reflection🪩@0xReflection
HISTORY IS ABOUT TO REPEAT In 1929, a statistician named Roger Babson stood in front of Wall Street and warned them the crash was coming. They laughed Bankers, traders, financial press - all of them. 49 days later, the crash hit. The same Wall Street that had laughed at him was suddenly broke. Babson wasn't lucky. He had identified a 5-stage pattern that appears before every major financial collapse Same 5 signals. Same sequence. Different decade. The pattern showed up before: 1929 1987 2000 2008 Every time, the people who ignored it lost everything. 2026 isn't different. 4 out of those 5 stages have already triggered.
English

Bitcoin dumped to $78K for a reason.
History is repeating itself, everything going exactly as I predicted:
Resistance at $82K rejected as expected, now $BTC dumps like this:
$78K → $61K → $47K → $55K → $41K
Next stops:
→ $70K in days
→ $41K by June
I called the $126k top in October 2025 and $15k bottom in November 2022.
If you missed those calls, don't worry. I'll call the next one too.
Follow now. I'll update you as this dump plays out.
Kabuki🔴@kabukistory
Everyone celebrating Bitcoin at $80K right now No one's asking what happens at $82K $82K is a powerful psychological mark. Won't break that easy. Next stops: → $70K in days → $40K by June Bookmark this chart - you'll come back to it next week
English
@AlexMasonCrypto oh boy, you clearly don't understand market psychology, or you're deliberately misleading people
English
Everything is going exactly as I told you.
$82K has been hit.
The bull trap is over.
Bitcoin is entering the phase where cycle bottoms form.
For the record, I was the only one publicly calling the exact bottom at $16,000 three years ago and the top at $126,000 in October.
If you missed those calls, don’t worry. I’ll call the next one too.
Turn notifications on. If you’re not following yet, you’ll understand why that was a mistake later.
Alex Mason 👁△@AlexMasonCrypto
🚨 READ THIS CAREFULLY Everyone thinks Bitcoin is breaking out. The chart says something completely different. Bitcoin is now forming a Wyckoff accumulation pattern. Most traders see accumulation and think the danger is over. That’s exactly how they get trapped. Bitcoin has already completed the first major reaction after the local high near $82.5K. That is the Relief Rally phase. And historically, this stage is followed by downside. But the setup is not that simple: - Drop toward $60K (finished) - Secondary Test formation (completed) - Bounce back above $75K (done) - Re-sweep of the lows (next) - Cycle bottom formation (coming) That’s how accumulation works. It doesn’t reward people who chase every bounce. It rewards people who understand the structure. Most traders only think in one direction: “BTC is pumping. Bottom is in.” Wrong. Real accumulation is messy. It shakes out early buyers. It traps breakout traders. It forces people to sell the bottom twice. That’s why my main focus is still the same: A potential <$50K bottom. Not because Bitcoin is dead. Because this is where the real accumulation phase can finish. For the record, I was the only one publicly calling the exact bottom at $16,000 three years ago and the top at $126,000 in October. If you missed those calls, don’t worry. I’ll call the next one too. Turn notifications on. If you’re not following yet, you’ll understand why that was a mistake later.
English
@splendid_pete rùzsribit egy hete láttam ciprusi reptéren. le volt lakva, mint egy albán taxi. hajdu peti pedig fent ült a Budapestre tartó járaton, a családjával. lehet valami titkos fidernyák találkozó volt a szigeten. idk
Magyar
@marta54794 @MatyasiAnna @MagyarNemzetOn Mondjuk legalább tud valamit előkészíteni. A fityesznek nem volt ilyen minisztere. Meg is látszik a kórházakon.
Magyar

@MatyasiAnna @MagyarNemzetOn Azért, mert egy kényszeres hazudozó, pszichiáteri eset! Az egészségügyi minisztere már készíti elő mindkettőjük számára a zárt osztályt.
Magyar

Magyar Péter nem tud leállni az alázó stílussal: most Orbán Viktor volt sajtófőnökével szólalkozott össze
Magyar
@MatyasiAnna @MagyarNemzetOn Csak szólok, hogy a Pétert 3.5 millió ember választotta. Ma ez a szám bőven 4 m felett van. A Fidesznek soha nem volt még csak 2.5 millió valódi szavazója sem.
Ezt csak infóként
Magyar

@MagyarNemzetOn Elképesztő! Én nem értem, hogy miért nem hagyja abba ezt a mocsok stílusát. De, talán így jobban megismerik a választói, bár amilyen elvakultak lehet, hogy mégsem.
Magyar