Altitude coin

4.3K posts

Altitude coin banner
Altitude coin

Altitude coin

@AltitudeCoin

Connect with the limitless energy of the creator! Exploring fresh perspectives on financial and digital markets! Join me on this journey...

In a place that feels right! Katılım Aralık 2016
98 Takip Edilen192 Takipçiler
Altitude coin retweetledi
Chiefy
Chiefy@0xChiefy·
No one is prepared for this Bitcoin scenario. 
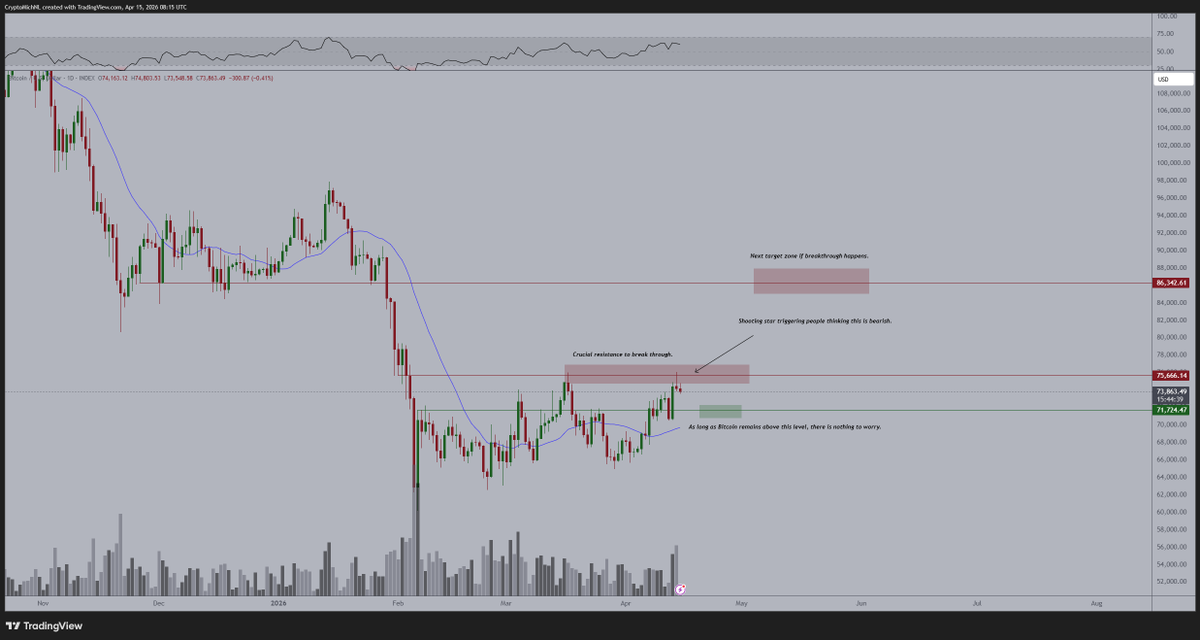
We're stuck in the longest and final Bull Trap right now. The correction phase starts next week, and $BTC will dump to $51,000 in 12 days. I called the exact Bitcoin bottom in 2022 and the exact top in 2025. Now I’m watching the same setup unfold in 2026. Follow and turn notifications on. Don’t miss the next move.
English
61
40
241
26.7K
Altitude coin retweetledi
Crypto Lens
Crypto Lens@crypto_lens_·
Bitcoin is now perfectly mirroring this pattern. If this pattern confirms, $BTC will dump to $38,000 within 12 days. Position accordingly.
English
10
7
42
2.3K
Altitude coin retweetledi
Aaron Dishner
Aaron Dishner@MooninPapa·
BTC is setting up a very bearish weekend. The daily candle is working on a second TBT bearish divergence, RSI has already undercut the recent pullback lows, and a close inside the TBO cloud would open the door for more downside. OBV and volume are still holding up, but the support fan break and wide CME gaps across BTC, ETH, and SOL keep risk skewed lower. ETH printed its first meaningful TBO breakdown in months and is losing support across the daily structure. ETHBTC is also confirming another TBO breakdown, while stablecoin dominance is pushing above the fast line and threatening the top of the cloud. If stablecoin dominance reaches the 10.5%-10.6% zone, that would be very bearish confirmation for the broader crypto market. Alt breadth still looks weak. BTC dominance printed a TBT bearish divergence cluster, but with stablecoin dominance rising, that points to capital leaving crypto instead of rotating into alts. TOTALES, OTHERS, TOTALE50, and TOTALE100 are all showing more weakness, with smaller caps already breaking support and OBV turning bearish in several places. TradFi added to the pressure: DXY is moving back into its gap zone, the U.S. 10-year yield spiked, USDJPY is pressing the top of the cloud, the euro broke down on the 4H, and U.S. equities finally pulled back after overbought streaks. Oil jumped, gold dropped hard back into strong bearish mode, silver printed a major TBO close long after a huge candle, and copper confirmed the risk-off read. FF is the only bullish chart I’m watching closely today. Most other names, including ZEC, SUI, TON, XRP, ICP, ALGO, MORPHO, MON, 2Z, BNB, SOL, and TAO, still look vulnerable unless bulls can reclaim momentum fast. 00:00 Intro and BTC daily warning 00:25 BTC bearish divergence, RSI, OBV, cloud, CME gaps 02:15 ETH TBO breakdown, support fan, bear flag, ETHBTC 04:13 Stablecoin dominance and BTC dominance signals 06:43 Total market cap and alt breadth weakness 09:25 TradFi: DXY, bonds, USDJPY, euro, equities, VIX, China 13:07 Oil, gold, silver, and copper 15:20 TBT, TBO, Journal, Kraken, Toobit, and viewer requests 17:36 FF and crypto watchlist breakdown 23:15 Weekend risk, stablecoin dominance, and closing thoughts
English
8
6
58
2.8K
Altitude coin retweetledi
Kabuki🔴
Kabuki🔴@kabukistory·
This Bitcoin chart has perfectly predicted the current Bull Trap to $79K. We’re exactly halfway through the bear cycle, and $BTC will dump to ~$41,000. History is repeating itself, everything going exactly as I predicted: $79K → $71K → $48K → $55K → $41K Next stops: → $70K in days → $41K in June I called the $126k top in October 2025 and $15k bottom in November 2022. If you missed those calls, don't worry. I'll call the next one too. Follow now. I'll update you as this dump plays out.
Kabuki🔴@kabukistory

Bitcoin is now perfectly following the Bear Cycle channel. History is repeating itself, everything going according to my plan: The $BTC pattern for 2026 is simple: $82K → $71K → $48K → $55K → $41K Next targets: → $72K in days → $41K by June I called the $15k bottom in November 2022 and $126k top in October 2025. If you missed those calls, don't worry. I'll call the next one too. Follow now. I'll update you as this dump plays out.

English
24
40
183
37.1K
Altitude coin retweetledi
Tony Research
Tony Research@TonyResearch_·
🚨 DON’T LET THE MARKET FOOL YOU! The price of $BTC is not sitting still for no reason! 200 MA has always been a major resistance level during bear markets Yes, there were moments when price briefly broke above it to trap the crowd - only to fall back lower and print new lows BUT DON’T GET DECEIVED Now take a close look at the Fibonacci retracement: - 0.5 and 0.618 have always acted as key resistance zones. - But the strongest resistance levels are 0.786 and 0.86 ( if you want, I’ll make a full video explaining why later) As I said before, I still expect lower Bitcoin prices EVERYTHING IS GOING ACCORDING TO MY PLAN. DON’T WORRY TURN ON NOTIFICATIONS, FOLLOW ME, AND BOOKMARK THIS
Tony Research@TonyResearch_

🚨 BULL TRAP $BTC ENDING! NEXT LEG DOWN LOADING... $126K → $81K → $97K → $62K → $85K +/- → $43K THE BITCOIN CYCLE BOTTOM WILL LOOK EXACTLY LIKE THIS EVERYTHING IS GOING ACCORDING TO MY PLAN, DON’T WORRY TURN ON NOTIFS, FOLLOW & BOOKMARK!

English
40
46
227
90.7K
Altitude coin retweetledi
Nonzee
Nonzee@0xNonceSense·
$BTC FOLLOW THE SAME SCRIPT EVERY CYCLE Every. Single. Time. - Minimum 350 days of pain - Bottom doesn't form before MA350 gets touched - Price always falls further than the crowd thinks possible Here's the problem. $BTC is still holding around $80K while the 350-day MA sits near $47K, completely untouched. That gap doesn't stay open. It never has. Everyone is celebrating strength too early. The real flush comes when confidence gets too crowded, and right now the market is acting like the bottom is already in. It's not. When $BTC finally tags the 350-day MA, that's the moment I flip aggressively bullish. Not before. When the next move becomes clear, I’ll post it here first. Turn notifications on. Most people will follow me too late.
Nonzee@0xNonceSense

$BTC just did exactly what I warned about. $83,000 reached. Then price pulled back. The bull trap is done. Every move higher keeps getting sold. Now the next phase begins. Just to remind you, I was the only one who called the exact $15,768 bottom three years ago and the $126,162 top. When the next move becomes clear, I’ll post it here first. Follow and turn notifications on.

English
24
28
149
35.6K
Altitude coin retweetledi
Doctor Profit 🇨🇭
Doctor Profit 🇨🇭@DrProfitCrypto·
I was bullish all the way from 16k to 120k Sold everything at 120k and shorted Said 60k is next when BTC was at 120k At 60k I said 79-85k is coming next And this ladies, is the local top (80-85k) The big crash towards 50k and lower soon
English
661
358
5.7K
697.5K
Altitude coin retweetledi
philarekt
philarekt@philarekt·
$BTC HEATMAP UPDATE (24H) Called it again $81,000 liquidity swept clean Exactly as the map showed Now price is sitting between two fresh clusters $83,000 above, $80,000 below One of them gets hunted next Already know which one Follow me - update incoming when it moves
philarekt@philarekt

$BTC HEATMAP UPDATE (24H) $80,500 liquidity just got swept clean Called it, played out exactly as mapped Now look what's sitting right above and below $81,000 - massive cluster, untouched $80,000 - equally heavy, still loaded Price is sitting right between them One of these gets hunted next Follow me - update incoming when it moves

English
14
4
31
14.4K
Altitude coin retweetledi
bee🐝
bee🐝@0xbeehive·
$BTC HAS THREE RULES IN A BEAR MARKET It's easy: Rule 1 - Bear market lasts minimum 350 days Rule 2 - The bottom never forms without touching MA 350 Rule 3 - Price always drops further than anyone expect Good news: By the timeline we're already 65% through the bear cycle But the price is still at $80,000. And the 350-day moving average is at $47,000 - completely untouched Not worried though. There are too many things working against this bullish moment right now. The flush is coming. It always does When MA 350 gets tagged - that's when I'll be the loudest bull in the room FOLLOW + NOTIFS ON!
Kalshi Crypto@Kalshi_Crypto

JUST IN: Michael Saylor hints at buying more Bitcoin

English
103
171
1K
308.3K
Altitude coin retweetledi
Aaron Dishner
Aaron Dishner@MooninPapa·
I think May and June could be brutal for crypto, and in this video I walk through exactly why I still believe BTC could push all the way down to $38,555 before this bear market leg is done. The core of the argument comes from the crypto calendar and how the last real bottom years behaved, especially when you compare monthly closes with the full wick-to-wick volatility inside those candles. I break down what those historical averages imply for BTC first, then apply the same lens to ETH and the broader market. The important point is not just that monthly closes could be red. It is that the intramonth volatility can get much uglier than the close alone suggests, which is why a move that looks manageable on paper can still feel like a bloodbath in real time. I also zoom out to TOTALES and the smaller-cap market to show how deep the damage could go if the same kind of bear-market behavior repeats. That is where the opportunity comes in too. If this forecast is even directionally right, the next two months could create some of the best accumulation windows of the cycle, but only for people who stay patient, think probabilistically, and avoid pretending projections are guarantees. The biggest takeaway is that this is a forecast, not a certainty. July has historically looked stronger, but I do not treat that as proof the full bottom is in. Right now I am using the best historical data we have to map the downside, prepare for volatility, and think ahead instead of reacting after the damage is already done. Crypto Calendar: calendar.thebettertraders.com Chapters: 00:00 Bitcoin to $38,555 by June? 01:48 BTC May and June historical forecast 03:19 Bitcoin volatility and lower wick projections 06:40 June could be even worse for BTC 10:47 Why this data comes from The Better Traders Club 12:34 Ethereum May and June forecast 15:30 ETH volatility and the $1,000 target 20:02 What TOTALES shows about the whole crypto market 23:29 TOTALES May and June downside projections 27:04 TOTALES vs TOTALLY50 vs TOTALLY100 explained 31:39 TOTALLY50 forecast and mid-cap risk 34:51 TOTALLY100 forecast and smaller-cap risk 36:21 Why July could bring a bounce 37:40 These are projections, not guarantees 40:02 How traders should prepare 41:48 Trading volatility and final thoughts 🎲 Play Moonin Papa BINGO with today's video: bingo.thebettertraders.com 💹 Take Your Trading to the Next Level! 💰 Sign up & Trade on Kraken 👉 invite.kraken.com/JDNW/n2vjiyla 🥇 Toobit: $15k Bonus 👉 go.coinbureau.com/aarontoobit 🥈 TBO indicator: identify trends early, confirm breakouts, and maximize profits by staying in the trend 👉 thebettertraders.com/TBO 📚 Learn Proven Crypto Strategies: Master bot trading, scalping, day trading, and swing trading with our courses: thebettertraders.com 🌐 Stay Connected: Follow me for market updates and insights across platforms: linktree.com/aarondishner
English
45
26
202
17.6K
Altitude coin retweetledi
Michaël van de Poppe
Michaël van de Poppe@CryptoMichNL·
I expect #Bitcoin to continue its bounce towards $93-95K. That's where the first rally, after the end of the bear market, goes to: the 50-Week MA. I do think that we've peaked in December '24 and that we've finished the bear market in February '26. I don't think we'll see a full blown #Altcoin strength, but I do expect money to rotate back into the assets that were doing great prior to the recent massive correction. Those bets remain relatively the same: AI <> #Crypto and some outliers.
English
88
31
540
68.2K
Altitude coin retweetledi
Sweep
Sweep@0xSweep·
Altcoins aren't coming back and it has nothing to do with macro. The industry has been dying for 6 years and this cycle was the final distribution The bubble wasn't in price, it was in valuation. Every number you've seen this cycle was a lie and the total crypto market cap at $4T was an illusion Actual capital that entered was a small fraction of that, and everything above it was locked supply multiplied by a last trade the team controlled When people compared crypto to silver, gold, or equity market caps this cycle, they were comparing real capital to numbers that never existed A $2B market cap on 5% float isn't $2B of value. It's $100M of traded float and $1.9B of team inventory waiting to sell on your head Stack that across thousands of tokens and the cycle wide market cap was mostly fake Every alt ran the same four stage extraction at different speeds, and once you see the structure you can't unsee it across everything you're holding It starts with the locked supply launch. Teams control 70-90% through multisigs while circulating float sits at 5-15%, and the FDV gets published as market cap so the valuation looks real to anyone who doesn't look twice Then comes mark price manufacturing. Thin spot books mean small buys move price hundreds of percent, MMs provide liquidity through loan and option deals while the team controls inventory, and CEXs list on the team's schedule instead of the market's Short recruitment is where the extraction starts targeting the traders who correctly identify the setup They run P/S analysis, see the overvaluation and short into engineered resistance. Funding flips negative, every 8 hours shorts pay longs, and the team collects funding from the traders they baited in Being right gets you liquidated $RAVE compressed all four into 7 days. Most alts stretched them across 18-24 months so the pattern was invisible in real time, which is why retail kept calling it a bull market while insiders ran the same play in slow motion This is why the drawdowns don't bounce. Old bear markets were drawdowns on real assets waiting for capital to return This cycle was distribution on fake market caps, and the capital that was supposed to hold price up was always team inventory, and it's already sold into every rally you bought The protocols that survive will be the ones with high float at launch, vesting already completed, real revenue distributed to holders, and no MM loan deals The industry didn't fail. The model worked exactly as designed, you just weren't the one it was designed for The market cap numbers were always lies. Retail just needed a 7 day example to finally see it Good to see the bubble pop. Up only from here
English
88
42
379
66.6K
Altitude coin retweetledi
Alex Mason 👁△
Alex Mason 👁△@AlexMasonCrypto·
🚨 SOMETHING VERY STRANGE IS HAPPENING The stock market keeps pushing to new all-time highs. But nobody is paying attention to what’s actually happening. OpenAI and Anthropic are now worth $2.1T. That’s 10% of the entire Nasdaq. Numbers don’t lie: - $400B burned per year - $50B in actual revenue The biggest AI players are losing tens of billions per year. Not listed. Not profitable. And still being priced higher. The playbook: - Big players funding each other - Partnerships that look good on paper - Revenue that never leaves the system This has happened before. 2000: Companies with no profits. Massive valuations. Narratives driving everything Then reality hit. Nasdaq collapsed -80%. You’re watching it happen in real time: the final sign of mania. Companies rebrand as “AI”… and reprice instantly. This is no longer investing. It’s a bubble detached from reality. They break. Remember, I’ve predicted all the market tops and bottoms for the last 15 years, including the exact Bitcoin bottom at $16,000 three years ago and the top at $126,000 in October. If you missed those calls, don’t worry. I’ll call the next one too. Turn notifications on. If you’re not following yet, you’ll understand why that was a mistake later.
English
102
306
1.7K
320.8K
Altitude coin retweetledi
philarekt
philarekt@philarekt·
$BTC HEATMAP UPDATE Long liquidity cluster we flagged on Friday is now getting swept $78K tap → ~$700M shorts wiped Now price rotating down into $74–75K pool → 193,527 traders liquidated, ~$305M gone Textbook flow Up → farm shorts Down → farm longs Degens keep donating to MMs and CEXs like clockwork Next: Below $74K = more longs stacked → cascade risk Above $76–77K = less fuel unless rebuilt If $74K cracks → quick move into lower liquidity (fast drop) If holds → chop or relief bounce No one knows the exact low But liquidity below > above right now Follow + notis on i will keep you updated
English
13
21
52
20.7K
Altitude coin retweetledi
CryptoReviewing
CryptoReviewing@CryptoReviewing·
This is shocking. On Monday, $BTC pumped from $70,000 towards $75,000 liquidating $472M shorts! Then yesterday, $BTC pumped to $78,000 liquidating another $669M shorts!!! And now today, $BTC has dumped to $76,000 liquidating $254M longs!!! That's $2.4B liquidations in Crypto in the past 5 days alone!!! Now, $78,000 - $81,000 has sizable liquidity above that could be swept next. However, $72,000 - $75,000 has roughly 2x larger liquidation clusters stacked up, making this the 'higher probability' zone we could visit next. Bulls and Bears are getting rekt.
English
28
47
339
120.8K
Altitude coin retweetledi
Michaël van de Poppe
Michaël van de Poppe@CryptoMichNL·
The markets are preparing for a short squeeze on #Bitcoin. The markets have rallied to $75,000 and rejected there. A 'shooting star' was made on the daily timeframe, and people freaked out. However, that's not the only indicator that we should be looking at. The funding rate is negative. This means people are overleveraged short while we're attacking resistance. Open interest has increased significantly over the last few days, indicating that more people are looking to short $BTC in this region. Clearly, that works on the first test of resistance, as traders will likely take profits in that zone. However, the markets are testing this for the third time now. There's significantly greater potential for the markets to break higher now vs. the previous test, and if they do, it's very likely that $85-88K is the next resistance zone to be tested. Why wouldn't you worry about that Shooting Star? The markets are making higher lows and higher highs on the lower timeframes, indicating sustained interest in the asset. In that light, as long as $BTC remains above $72K, I wouldn't be worried, and I'd rather be looking for longs vs. shorts.
Michaël van de Poppe tweet media
English
38
48
301
30.1K
Altitude coin retweetledi
Against Wall Street
Against Wall Street@aganstwallst·
Bitcoin’s replaying the 2022 crash playbook step by step Check out this video, the moves are literally identical! Bitcoin is stuck in the loop 😱 This is a trap. Don’t fall for it 🎯 $BTC $MSTR $ETH
English
120
204
1.6K
344.4K
Altitude coin retweetledi
Michaël van de Poppe
Michaël van de Poppe@CryptoMichNL·
Casual monday morning drop on the markets, taking all the liquidity beneath the lows for $BTC. It's all depending on how this daily is going to unfold. If $65K can sustain as support, I think that we'll roll this over towards a test of higher ranges after Iran <> USA find themselves into calmer areas tomorrow. If not, retest of the lows at $60K seems to be possible.
Michaël van de Poppe tweet media
English
77
45
218
24.7K
Altitude coin retweetledi
Michaël van de Poppe
Michaël van de Poppe@CryptoMichNL·
The $BTC dominance seems to be breaking down. It's making a lower high, and therefore, a continuation of this trend is likely to expect. I stlil stand by the thesis that it's more of an $ETH bull market already than a Bitcoin bull market, so I would expect Ethereum to continue pacing upwards.
Michaël van de Poppe tweet media
English
90
49
347
25.6K