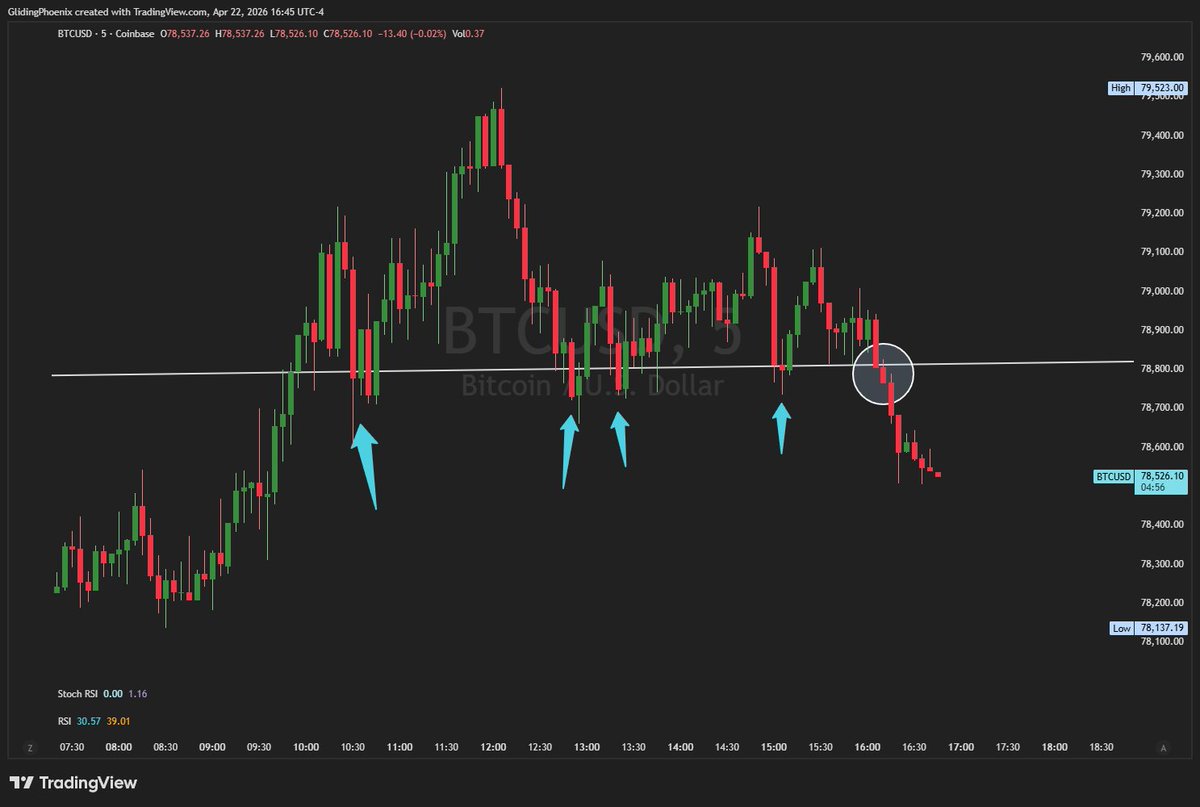
@RemoteNavigator Would love ur opinion on BTC. it got thrashed after hours
English
ANTRADE722
419 posts

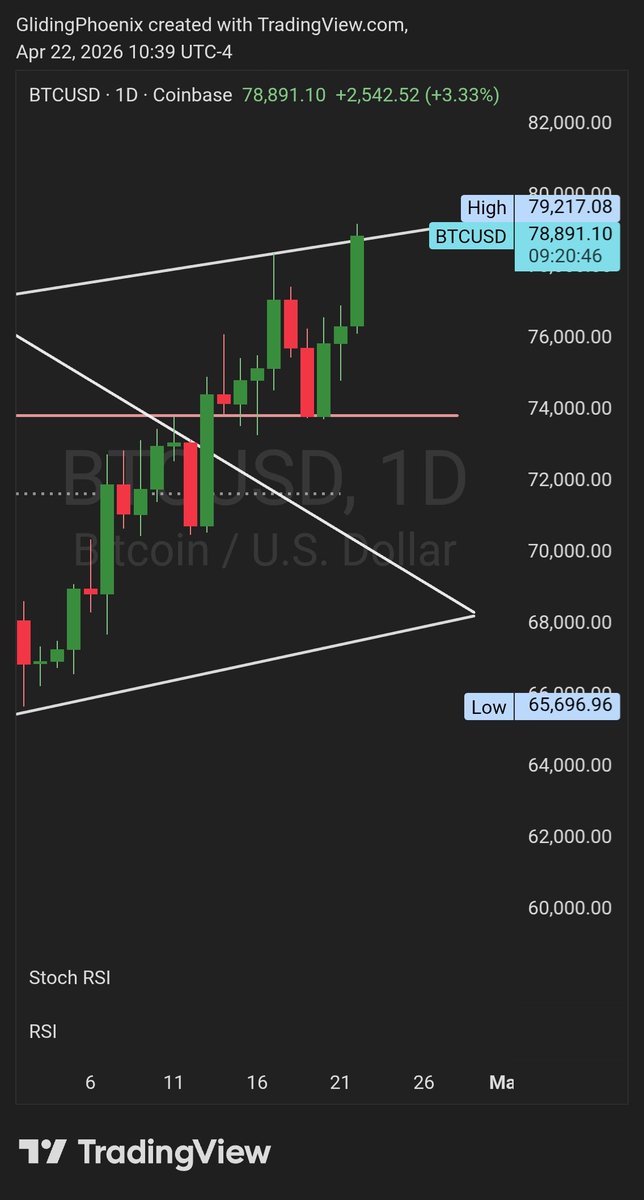
$BTC is closing in on a test of the $78.6k area and based on what we are seeing in pre-market, we could see that test happen in the coming hours. Do you think $BTC will reject here, or break through and push above $80k?

$BTC exploding higher here, now $77.5k. I had been saying for months that $73.8k was the key level and after reclaiming it, we saw a perfect back test and bounce. That was a structure confirmation for me. Next we need to see the short-term channel top which currently sits at $78.6k broken. That level now aligns perfectly with the block of three candles in early February.

JPMorgan has said that investors should buy the dip as a "rebound is likely."

Are We About To See a Market Correction? 📉 The recent "melt-up" in precious metals was met with plenty of scepticism, and Friday’s price action proved why. The nature of that dump was violent, a classic liquidity flush that saw Gold lose 9%, Silver plummet 26%, and Palladium shed 16% in a single session. With the traditional markets closed for the weekend, the panic has migrated to the only venue still open: Crypto. The result? $BTC has aggressively tagged $75k, while $ETH and $SOL saw moves of -17% intra-day, with $ETH slicing as low as $2,250. When the only open exit is the crypto market, you start to see where the real fear lies. Looking at the S&P 500, a correction here wouldn't just be "not unusual", it would be historically due. Market corrections (-10% or more) happen on average once a year, and we are currently riding a 9-month winning streak. The index is now up a staggering +43% from the Liberation Day lows of April 2025. Yet, if you even whisper the word "pullback" right now, you get a funny look. And don't get me started on small caps. Seeing dozens of tickers up +50% or more YTD in just one month is the definition of euphoria. But none of that necessarily means the market must pull back now or that the euphoria can't continue. So today, I am going to ignore the noise and focus strictly on the $SPY and $QQQ charts to see if there are any warning lights or structural breakdowns. $SPY: The Wedge Breakdown After squeezing toward the end of a tightening range, $SPY had a decision to make: break out the top side or break down below support, the very support that has held since the Liberation Day lows. - The Pivot: On Tuesday, Jan 20, it gapped below. It worked its way back toward the wedge bottom but was rejected on Wednesday. - The $BTC Parallel: For anyone who followed my $BTC coverage, we saw exactly the same thing: lose the channel, try to get back in, and reject a couple of times. That has led to a dramatic collapse since for $BTC, so we will see if the parallel continues. - The "Line in the Sand": Despite breaking below the channel, $SPY is still holding its EMA50 on the daily. This parallels a number of charts I have been sharing lately (like $ONDS), where the EMA50 is the final defence. $SPY: The Multi-Year View Zooming out, $SPY has been hanging out at the top of a multi-year channel (8 years), attempting to break it for weeks. However, despite 14 weeks of popping above it, we haven't seen a single confirmation (back-to-back higher closes above). $SPY: What to watch We need a bounce and close above the recent support line, around ~$700 (7,000 on the S&P 500). However, unless the channel top at ~$712 is decisively broken, we may just be delaying the inevitable. - The Correction Target: If we break down, there is a clear upsloping support level currently sitting at ~$635, which would likely provide the "floor" around $640–$650 if a full correction plays out. $QQQ: Same Same The $QQQ story is the same. Price broke below the support line going back to the April lows. Interestingly, $QQQ jumped back above the level on Tuesday but failed to confirm on Wednesday. Like the $SPY, it is currently resting on the EMA50. This is a "Line in the Sand" for me. Mega Caps: The Driving Force Mega caps have been the weak link lately. Even with decent earnings, $AAPL and $TSLA struggled for momentum, while $MSFT got absolutely crushed on poor guidance. - The Saving Grace? All eyes are on $GOOG. They report this Wednesday, Feb 4. If their earnings are excellent and demonstrate real returns from AI investments, it could swing the entire index back to green. It is a "must-watch" event for the week. The Question The indexes have been riding high for months with signs of clear euphoria. With key levels starting to come under stress, is the market about to get a dose of reality, or does this bull market have more to give in the short-term? You know the levels to watch.
$SHOP $120 Call for $7.00 Dca on pullbacks! Sounds fun to give plays on X!📊
$SHOP $120 Call for $7.00 Dca on pullbacks! Sounds fun to give plays on X!📊
$SHOP $120 Call for $7.00 Dca on pullbacks! Sounds fun to give plays on X!📊
$SHOP $120 Call for $7.00 Dca on pullbacks! Sounds fun to give plays on X!📊