@NoLimitGains Eh in 2008 people had ARMS and no equity. Even if some people are forced to sell due to life changes, they have real equity in their bomes. You really think the market is that fragile?
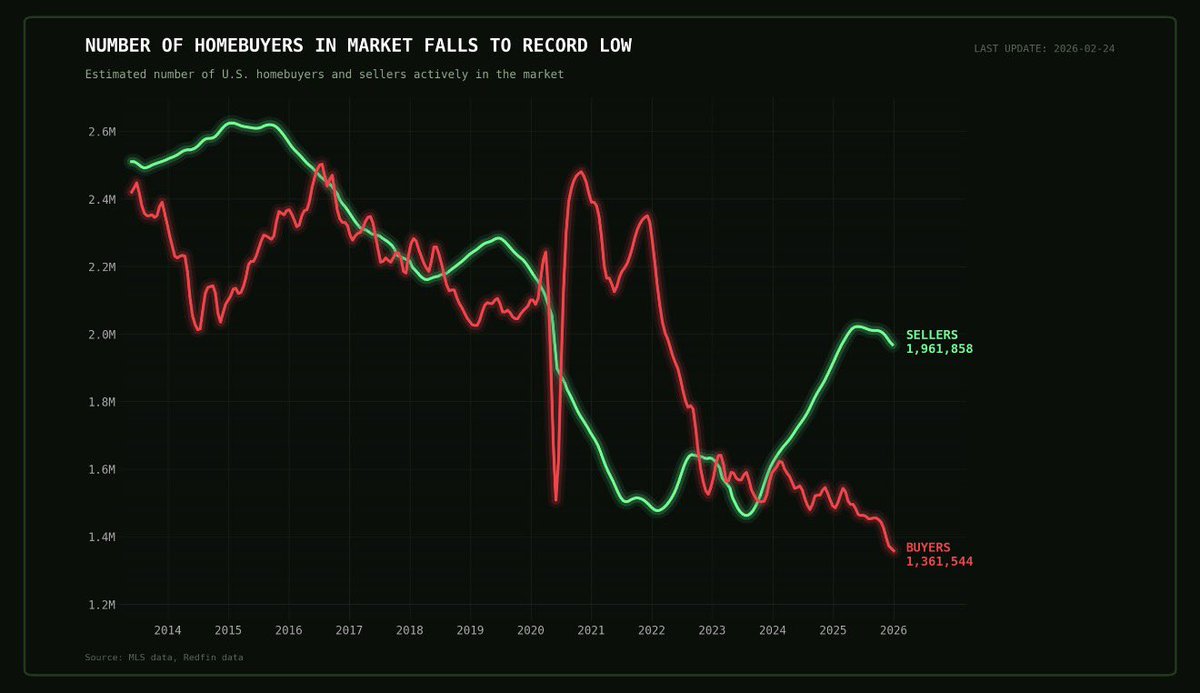
This chart should terrify every homeowner in America.
Buyers just hit a record low of 1.36 million.
Meanwhile sellers are climbing fast, nearly 2 million.
The huge gap? That’s the housing market slowly dying.
People locked in 2-3% mortgages during COVID are finally being forced to sell.
Job losses, divorces, relocations.
But on the other side… BUYERS ARE GONE, and it’s easy to understand why.
– The avg mortgage rate is sitting near 7%.
– Monthly payments on a median priced home have nearly DOUBLED since 2021.
– First time buyers are simply too broke.
The affordability equation just doesn’t work like it used to, and sellers are starting to compete with each others.
Markets that overshot the most during COVID (Austin, Boise, Phoenix, Tampa) get hit first and hardest, then it spreads everywhere.
The Fed cutting rates won’t save this either…
Even if we get back to 5.5% mortgages, the damage to buyer psychology is done.
The housing market doesn’t crash overnight, it bleeds slowly, and this chart is showing you the early stages of that bleed.
More sellers, fewer buyers, every single month.
Housing prices are already dropping as we speak, and it’s about to get worse.
Be careful.