
Mr. Jones ⚡️
3K posts

Mr. Jones ⚡️
@BTJ514
ℂ𝕣𝕪𝕡𝕥𝕠 & 𝔽𝕚𝕥𝕟𝕖𝕤𝕤 | World Traveler 🌎 $GOLD $SILVER $BTC $XRP $OIL $AMERICA
Earth Katılım Haziran 2017
2.4K Takip Edilen502 Takipçiler

$AMERICA
AVA8YuCsD2YgUSpdv3Hb2cjpdf8XAhGwyXmchxwopump
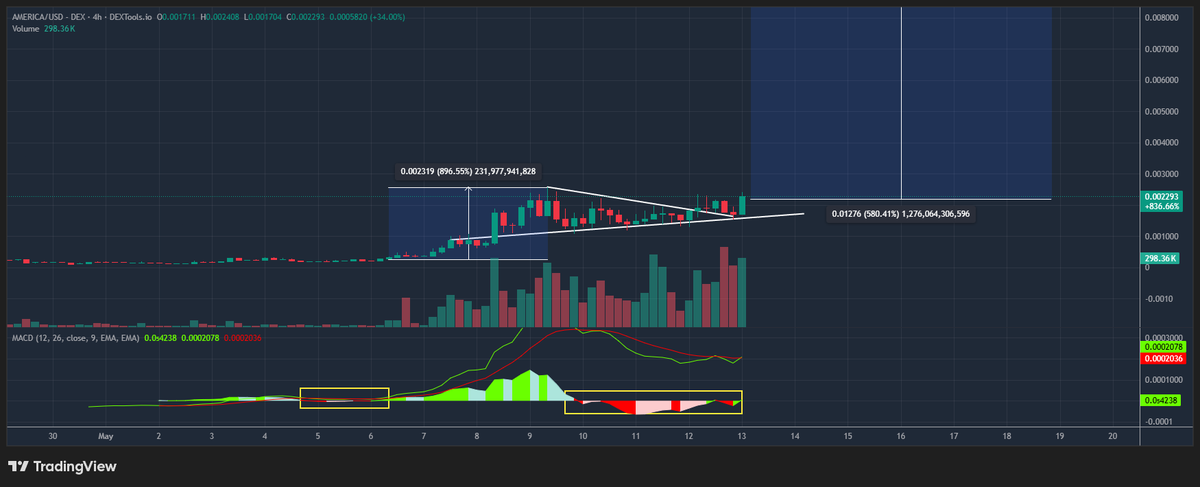
Breaking out 👀
Nite⚡@TeachingCrypto
$AMERICA is back AVA8YuCsD2YgUSpdv3Hb2cjpdf8XAhGwyXmchxwopump Tons of catalyst coming up 🔸️Memorial Day 🔸️July 4th - Americas 250th birthday 🔸️Mid term year 🔸️Elon going all in to support Trump 🔸️Merch drop will be showcased everywhere Volume looks good Consolidation looks good Goated Team Thoughts are this will keep stair stepping itself up What bigger narrtive is there than America is back, with the ticker $AMERICA Alot to come for this one...
English
Mr. Jones ⚡️ retweetledi

🚨 IT'S OFFICIAL !!
Kevin Warsh is now confirmed as the new Chairman of the Federal Reserve !!
Powell is out, Warsh is in
$AMERICA IS SO BACK!
BULLISH AF FOR BITCOIN
BULLISH AF FOR STOCKS
The White House@WhiteHouse
✅ CONFIRMED Kevin Warsh has been confirmed as the Chairman of the Board of Governors of the Federal Reserve System!
English
Mr. Jones ⚡️ retweetledi

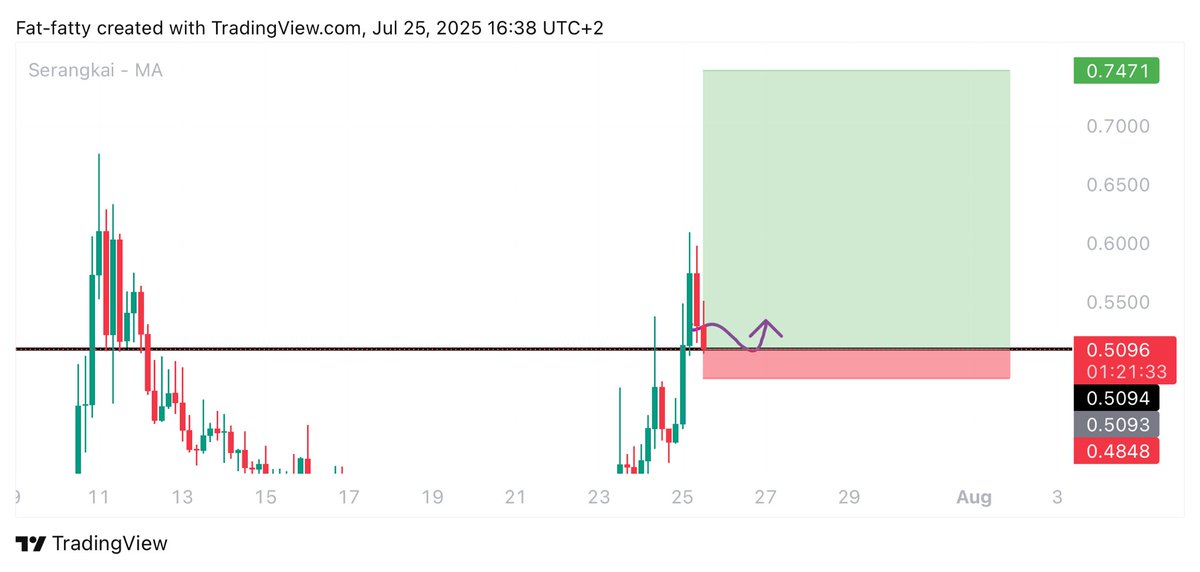
$AMERICA IS BACK! 🇺🇸
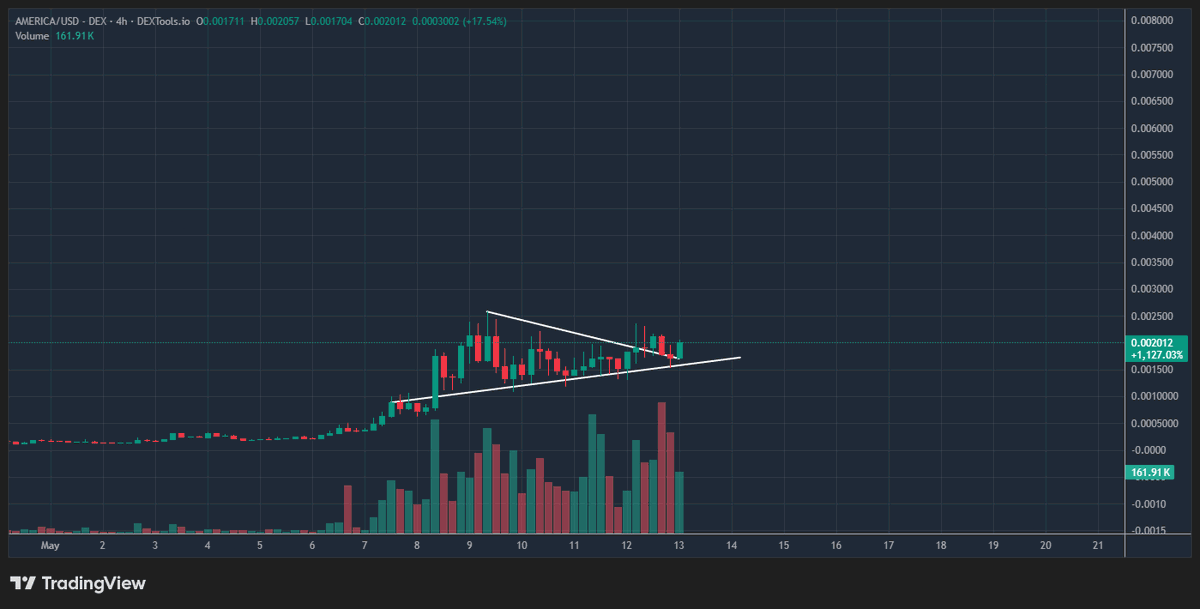
Such a healthy looking chart, clear diagonal support holding on each touch and a clear key resistance level to break, once we flip this its 5-10m fast imo 🤝
Remember MAGA and how far that narrative flew? This is MAGA 2.0 .. lock in chads

🦖WAGMISAURUS REX🦖@wagmisaurus
3X from entry on $AMERICA - and we're still just getting started. Once we break that upper range we're going to 1m+ FAST!! 🚀 Current narrative = Cash! Follow the trend gang
English
Mr. Jones ⚡️ retweetledi

$AMERICA #AMERICAISBACK 🇺🇸
#AMERICA About to turn on the printer.
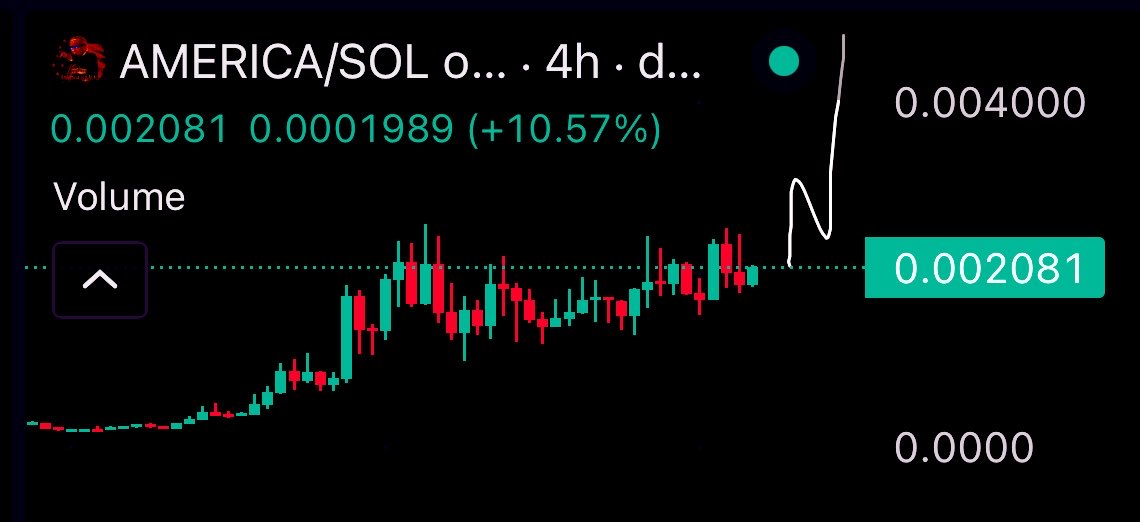
1.6mil volume - 2mil mcap
Just remember Trump chose $SOL to launch his own coin $TRUMP . Solanas deep roots lie in America. #Solana is the home for $AMERICA it’s written.
฿ITCOIN🪬TRAPPΞR@BITCOINTRAPPER
$AMERICA #AMERICAISBACK 🇺🇸 Broken out this consolidation to the upside and pushing back towards ATH. $America was trending on X again today. The hats are now on the market. Could say everything up until now was just the warmup. The real journey begins here.
English
Mr. Jones ⚡️ retweetledi
$MAGA ran to $800M
Billions spent on one slogan
Trump's new slogan is "America Is Back."
$AMERICA on Sol is the ticker directly tied to it
🔸️The merch just dropped
🔸️Solana themselves posted the slogan
🔸️Elon's going all in on midterms
🔸️July 4th is America's 250th birthday
🔸️Blueprint already exists
🔸️Clarity Act coming
🔸️Already seeing other large projects that ran over 100M supporting this project & large republican accounts sharing this projects tweets
The attention from here on out will be crazy
Ticker is goated. Early again.
CA: AVA8YuCsD2YgUSpdv3Hb2cjpdf8XAhGwyXmchxwopump


Nite⚡@TeachingCrypto
This will be a fun one to go back to & update Thesis: $AMERICA is back is the new marketing slogan for Trump This will be posted everywhere From large supporters to merch etc We also have: 🔸️America's 250th birthday 🔸️Clairty Act coming 🔸️Mid term year Maga alone ran to 1B from the positive tailwinds of the constant marketing push Trump used for this The same push will happen on his new slogan Also I like the fact its on $Sol & seeing solana themselves supporting the slogan This teams approach is goated It hits every area for this to explode The ticker is goated: $AMERICA In rare occasions some things come off as beyond obvious For me, this is one of them Think this stair steps its way to be a main runner soon Early once again
English
@M0SC0W0 Get him on a peptide stack perfect candidate 💪✨ Retatrutide, Tesamorelin & Mots-C = unreal
English

أنانت أمباني نجل الملياردير الهندي الشهير وزوجته راديكا ميرشانت حيث تظهر الصورة التباين الواضح في البنية الجسدية بين الزوجين، وهو ما كان محط أنظار الكثيرين في ظهورهم الأخير.
العربية

Mr. Jones ⚡️ retweetledi

No need for a Sunday report today
The report from last week describes all
The death cross is confirmed for Bitcoin
We are in a full force bear market
Doctor Profit 🇨🇭@DrProfitCrypto
#Bitcoin – What’s Next? The Big Sunday Report: All You Need to Know: 🚩 TA / LCA / Psychological Breakdown: It’s very important to understand the chart below and the significance of the golden line, which is the EMA50. I predicted the breakdown of this line back in September when I said that BTC would fall below 100k and break beneath the golden line. This chart is crucial because it indicates whether BTC is in a bull or bear market. Historically, every time BTC touched this area, it closed the weekly candle right above it and always bounced afterwards. Throughout the entire cycle since 2024, Bitcoin consistently closed above this level, confirming the bull market we were in. Now it has dropped below it exactly as I predicted, and confirming the bearish sentiment. This chart is extremely important for understanding the concept of the death cross and why many people are mistaken when calling the current death cross a bullish event. Today, Bitcoin experienced a death cross for the first time since April 2025. Before that, we had a death cross on August 10th, 2024, and another one on September 12th, 2023. On all three of these dates, BTC rallied between 25% and 60% within the following three months after the death cross occurred. Bulls argue that today’s bearish death cross is a bullish signal based on these historical examples. However, they are missing one very important fact. Every time we saw a death cross in the past, Bitcoin was trading well above the weekly EMA50. For example, in April 2025, the death cross happened while Bitcoin was 12% above the EMA50. On August 10th, 2024, Bitcoin was 17% above the EMA50 at the moment of the death cross. This time, the situation is entirely different, and people are completely ignoring it. Today’s death cross occurred while Bitcoin was trading 6% below the EMA50. This is a very important point that is being overlooked as we speak. Check the chart above: Death cross happened on 10th April 2025 ✅ Golden Line EMA50 - HOLD STRONG ✅ Confirmation of Fake Death cross - BULLISH! Check the chart above: Death cross happened on 10th August 2024 ✅ Golden Line EMA50 - HOLD STRONG ✅ Confirmation of Fake Death cross - BULLISH! The same applies for the Death cross that happened in 2023, Bitcoin always respected the golden line. Now lets have a look what happened today: Check the chart above: Death cross happened TODAY ✅ Golden Line EMA50 - FAILED TO HOLD 🚨 Confirmation of TRUE Death cross - BEARISH! This is one of the most important facts people completely overlook. They compare the death cross using numbers only. Yes, in the last three events we saw three strong bounces, but in all three events the EMA50 was holding at the same time. On top of that, every previous death cross occurred while Bitcoin was above the EMA50. This time, the situation is fundamentally different. The EMA50 has already failed, and the death cross happened while BTC was below the EMA50. That is a significant DIFFERENCE, and the key point everyone is ignoring. This is why anyone claiming that today’s death cross is bullish will be proven wrong. Ask them what supports their idea that this death cross is bullish. They will point to the last three events. Then ask them about the golden line (EMA50) during those events. They will admit that Bitcoin respected it and bounced off it every time. Ask them what’s happening with today’s EMA50. That’s when they realise they’ve been wrong the entire time. Someone needs to point this out, and I’m doing exactly that. I hope you understand. So in total, I consider the argument of a “bullish death cross” a very weak one, it’s simply a desperate attempt by the bulls to showcase whatever remains of their bullish narrative. It’s also important to mention that many bulls repeat the idea that “Fear and Greed Index at extreme lows = bottom.” This is completely wrong if we are in the early stages of a bear market. I still remember when Bitcoin dropped from 68k to 50k in 2021 and the Fear and Greed Index hit 16, which is extreme fear. In the months that followed, BTC continued its downside move until it reached the 16–18k region. Today we see the Fear and Greed Index at extreme fear levels around 10, but this does not mean the crash is over. Extreme fear does not equal a bottom when macro structure and market indicators confirm the start of a deeper bearish phase. I can’t repeat it more often but joining DrProfit Premium can truly change your life as many testimonies are showing. Join here: whop.com/drprofit-tradi… It’s also important to note that during the correction phases throughout 2024 and 2025, we repeatedly saw the same pattern: whenever ETFs sold, whales were the ones accumulating. But this time the chart looks completely different and significantly more negative. ETFs are selling, and whale net volume is also negative. This creates a combined bearish price sentiment and adds substantial selling pressure to BTC. On top of that, the average BTC buyer from the last six months has an average entry of $94,600. Bringing the price back toward $94,600, or below it will trigger even more selling pressure, as short-term traders historically tend to sell at breakeven or even at a slight loss. This combination of ETF selling, whale selling, and a large cluster of sellers sitting at breakeven levels is a dangerous setup and adds to the bearish case. Not to ignore the entire macro economic risks, such from the REPO market, which I have predicted back in September already. The pressure can be felt these days, and its just the beginning. For much more sell pressure! Enjoy your tea, wait, dont over-trade. Regarding #Bitcoin, my position remains the same: fully in USDT, with shorts averaging an entry around 119K. THIS IS NOT FINANCIAL ADVICE BUT EDUCATIONAL CONTENT ONLY. ALL WRITTEN HERE IS MY OPINION AND MY OWN TRADING AND INVESTING STRATEGY Join Premium: whop.com/drprofit-tradi… Join Free TG: t.me/Therealdrprofit
English

Goodmorning ❤️
Market pumped as we expected yesterday but I don’t know if we should trust a pump into the weekend, anyways will analyze everything today
Have a Good Friday
English

.
Good morning to everyone, EXCEPT THE PEOPLE THAT offend, criticise, humiliate and disrespect others, just because they have a different opinion.
**** Never fight disrespect with disrespect! Don't DEGRADE yourself!
.
English
Mr. Jones ⚡️ retweetledi
#Bitcoin – What’s Next?
The Big Macro Report: Everything You Need to Know
🚩 TA / LCA / Psychological Breakdown:
This report speaks about the current market status and what to expect in the coming weeks, especially in the month of September. We all know the fools that never took profits. We all know those who have been holding from cycle to cycle and never realized any kind of profit. Beware of this kind of human nature, and beware of the risks of selling in fear. There is no better feeling than selling with euphoria, in big profit, and after a clear and executed plan that played out, Indeed we follow our path of buying low and selling high. In order to keep the momentum of greed and euphoria, the market makers need to create a bullish sentiment with leveraged, manipulated prices to keep momentum high. To trap as many retails as possible, it’s also likely that market makers will start moving up altcoins more aggressively in the coming days, just to bring as many retails as possible to the honey pot.
The FED decision in September:
Every big player and serious investor knows that once the FED starts cutting rates, we usually see a strong correction afterwards. In my opinion, the September meeting can and should be considered as the first significant rate cut, given current market events. It’s the most important one compared to the last cut since 2020 in September 2024, which showed no signs of correction. Back then, people were calling for a strong pullback, while I said clearly that the September 2024 cut was not significant at all, and I was proven correct. In terms of market understanding, such a FED pivot is considered a soft landing, followed with consolidation and stabilization, which the FED indeed managed to achieve. My prediction then proved more than correct, ignoring all the garbage talk about stocks and crypto that the markets are “always” dropping after the first cut. That is simply not true. The real drop happens only after the first SIGNIFICANT cut, when uncertainty kicks in and opinions split. That is why this cut is completely different, and why it will lead to a strong correction in stocks and crypto. Don’t compare this cycle to others or to other emergency cuts; each rate cut is unique and should be analyzed on its own terms. I strongly believe that this rate cut will play a key role in the market correction that will take place in September. The next FOMC meeting is set on 17th of September.
Bitcoin price Analysis:
Now, in terms of charts, Bitcoin is very bearish because we still have a strong CME gap in the 93k area that needs to be filled. At the same time, most liquidity is sitting in the 90–95k region. We also need to retest the EMA50 weekly again. Overall, the chart is pointing strongly to my mentioned 93–95k region. Once again, we see a double top, once again volume is dropping hard, and the most recent pump was led by futures rather than spot buys. The chart is ready for a correction. Add to that many bearish divergences on both the daily and weekly chart, and the picture is clear. On top of this we need to focus on market psychology. the retail side, which is even more important.
As you can see in the chart, I pointed out where retails sold and where they bought. This data is obtained from on-chain metrics, market sentiment, and the Fear & Greed Index, combined with bigger and smaller wallet flows. We can clearly see how retails always sell low and buy high. Most significantly, look at the latest dip in June from 110k to 98k. During that dip, it is clear that most of the spot buyers (95% of wallets) were big players and investors. Retail fully missed this move. The BIG wallets BOUGHT up to 110k, and retail didn’t touch anything until prices already climbed. Their latest entries are between 110 115k and even higher in the region of 120k+. As always, in order to shake them out, to let the weak hands sell lower than they bought , prices need to drop to their liquidation and max pain zone, which is the 90–95k region. This is one of the strongest sentiment signals we have to determine direction: as long as retail entered heavy, especially at these levels, the market needs to flush them out before the next leg higher. And this fits perfectly with the current narrative of rate cuts, a bull trap, and manufactured optimism. Let them believe in a “beautiful long-lasting alt season.” Good luck with those dreams. Wake up to reality. The trap is set: euphoria, endless expectations, and blind trust in authority (the FED). Combine all of this and what you get is a fake bullish sentiment. The best time to take massive profits, is exactly when retails are buying. The liquidity is being unloaded right now. unnoticed because tons of retails are rushing in at this moment while bigger wallets and even the BlackRock ETFs see no kind of strong inflows but rather outflows are dominating and everyone in the most powerful and biggest existing trading group on the planet knows exactly what that means. Our multi-year plan is on track, join premium ($59 / Month) to know more👉whop.com/drprofit-tradi…
The Strategy:
I’ve spoken about our Strategy several times, but to execute it with perfection we must consider last week’s Sunday report, which outlined the range we are moving in. This range is the SHORT AREA and anything inside it is a short entry for me. The short area is shown in the chart as well! For that, position size matters. Since August 18th, I’ve been taking daily profits of 10% from all my bags, including ETH and BTC. For example, if my bag is $1,000, I take $100 profit each day and roll it into building a short position. This step-by-step accumulation of shorts and distribution of spot should only happen within the MENTIONED short area. Its important to mention that the short position only includes BTC and does not include ETH or any other altcoin. One month ago, I shared ETH at $2,600, and earlier buy signals at $1,800 and $2,000. I predicted ETH would hit $4,800 and a new ATH and it delivered with perfection. Now I’m taking profits step by step to buy back lower. After the September correction, I expect ETH to run to $7,000–$8,000 and Bitcoin to push toward $145,000–$150,000. The goal of this trade is simple: end up with more coins than we hold now by selling high and buying low. I play this game for the mid-term, not the very short term. My leverage is at x5, and my position is not yet fully loaded with four more days to go. Currently, Cash + Shorts make up 60%, while Spot bags are 40%. Each day I shift 10% from Spot into Shorts. I expect this trade to unfold in September. I don’t believe we’ll see the big move in the next few days unless something unforeseen happens, which would still work in our favor. If the market pushes higher, even into the $124,000 range, it remains inside the short zone. Should we reach that level, I will become even more aggressive, adding more than 10% to Shorts. I’ll update if the market allows us to visit that area within our range. Remember: market makers will do everything in their power to make the market appear strong right now. I use that manipulation to position for the real move that’s coming. The best example is the most recent pump that happened right after the Powell speech. Fully leveraged pump with no real spot demand. Dangerous.
Trade with DrProfit on BloFin: blofin.com/invite/DrProfi…
THIS IS NOT FINANCIAL ADVICE BUT EDUCATIONAL CONTENT ONLY. ALL WRITTEN HERE IS MY OPINION AND MY OWN TRADING AND INVESTING STRATEGY.

English
Mr. Jones ⚡️ retweetledi

Mr. Jones ⚡️ retweetledi

@gordongekko $QUBIC layer 1 AI gem 💎 Low MC, insane potential. Trust Mr Jones :)
English


@precogniti0n Truly remarkable 😎 can only mean one thing! Liftoff inevitable 🚀
English

Mr. Jones ⚡️ retweetledi

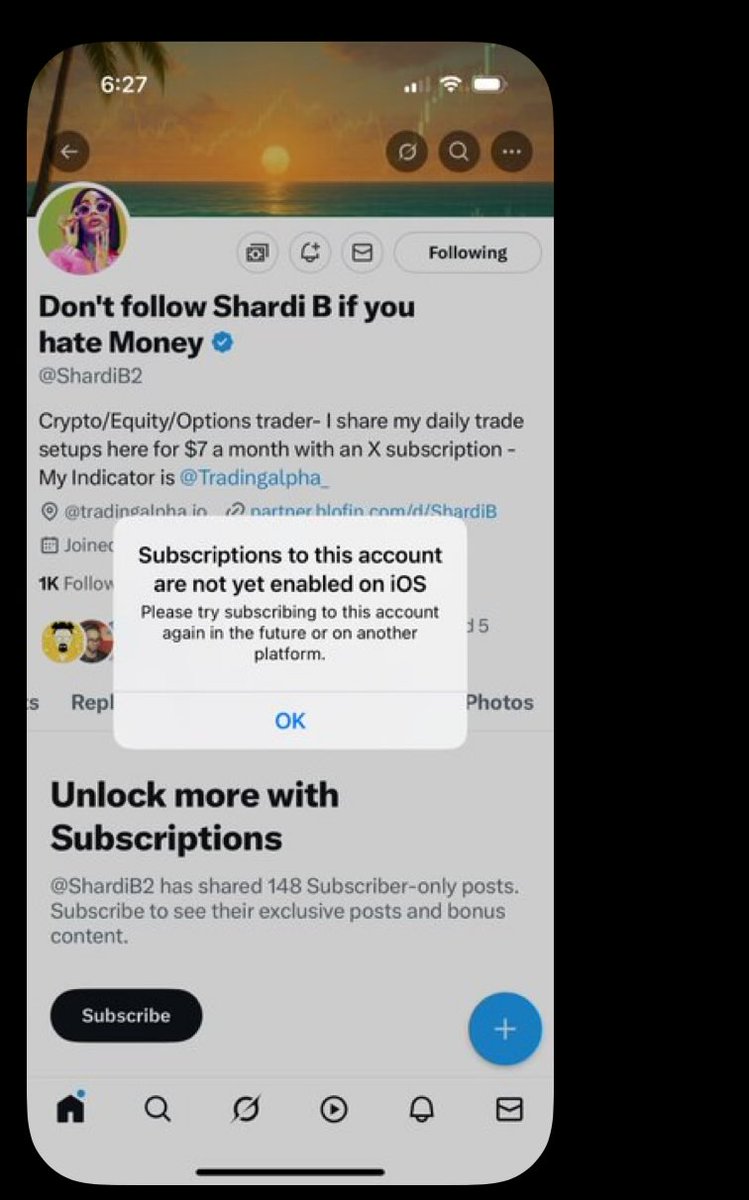
@ShardiB2 I was just about to ask lol no subscribe button in sight on my end. Thx all cleared up now.
English

I must get this question 100x in DM’s about subscribing.
If you are getting this message, you are probably on an iPhone. If you are on an iPhone, you must log into X by going through Safari or chrome. Once you login through the web browser, you will see the subscribe button.
Subscribe there, then you can come back and use the app.
Pain in the ass, but nothing I can do, thanks!
English