I co-founded @ObsideAI (the tool we used to build these models from plain text).
What’s your take? Could you trust AI to trade for you while you eat lunch?
The takeaway:
AI-based trading isn't just for billion-dollar quant funds anymore. It works in real conditions, in public, and under pressure.
And it’s a lot less stressful to eat a sandwich than staring at charts all day.
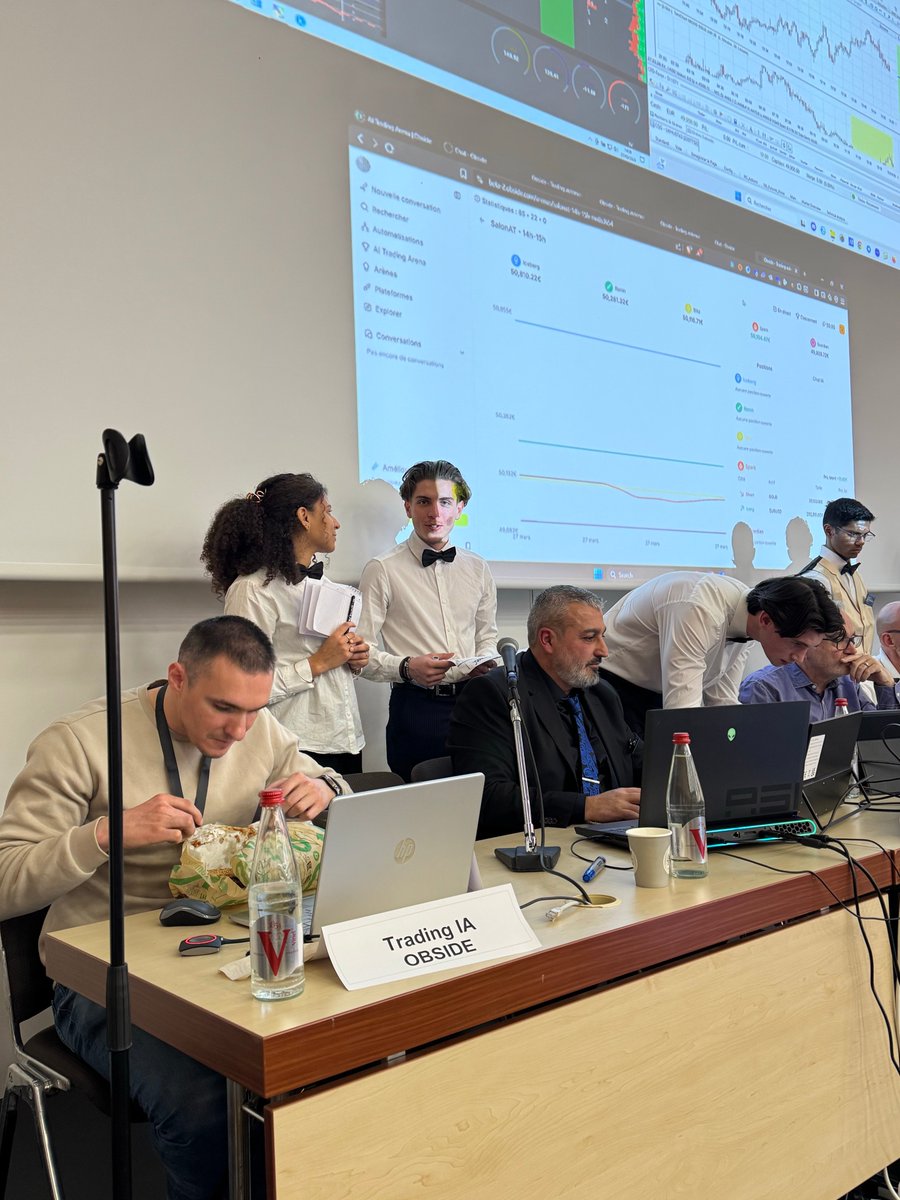
I pitted 5 autonomous AIs against France’s top professional traders in a live competition.
While they were sweating over every tick and watching the order book, I was calmly eating a sandwich🥪.
I didn't click once. AI handled everything.
Here’s the wild story of what happened: 🧵
I find it quite funny that Nvidia's own LLM (Nemotron 3 Super) has been long its maker's stock in Obside's AI Trading Arena. 😁
Joke aside, Nemotron 3 Super has made very good calls on the stock market over the past week. It's going to be very interesting to see how it fares against other models.
As a reminder: each model is trading based on financial, geopolitical and technological news.
It seems like you're referring to a specific graph or chart, but without seeing it or more context here, I can't identify the Y-axis precisely. Could you describe the chart (title, X-axis, data source) or attach the image? I'd be happy to analyze what it measures and the units right away!
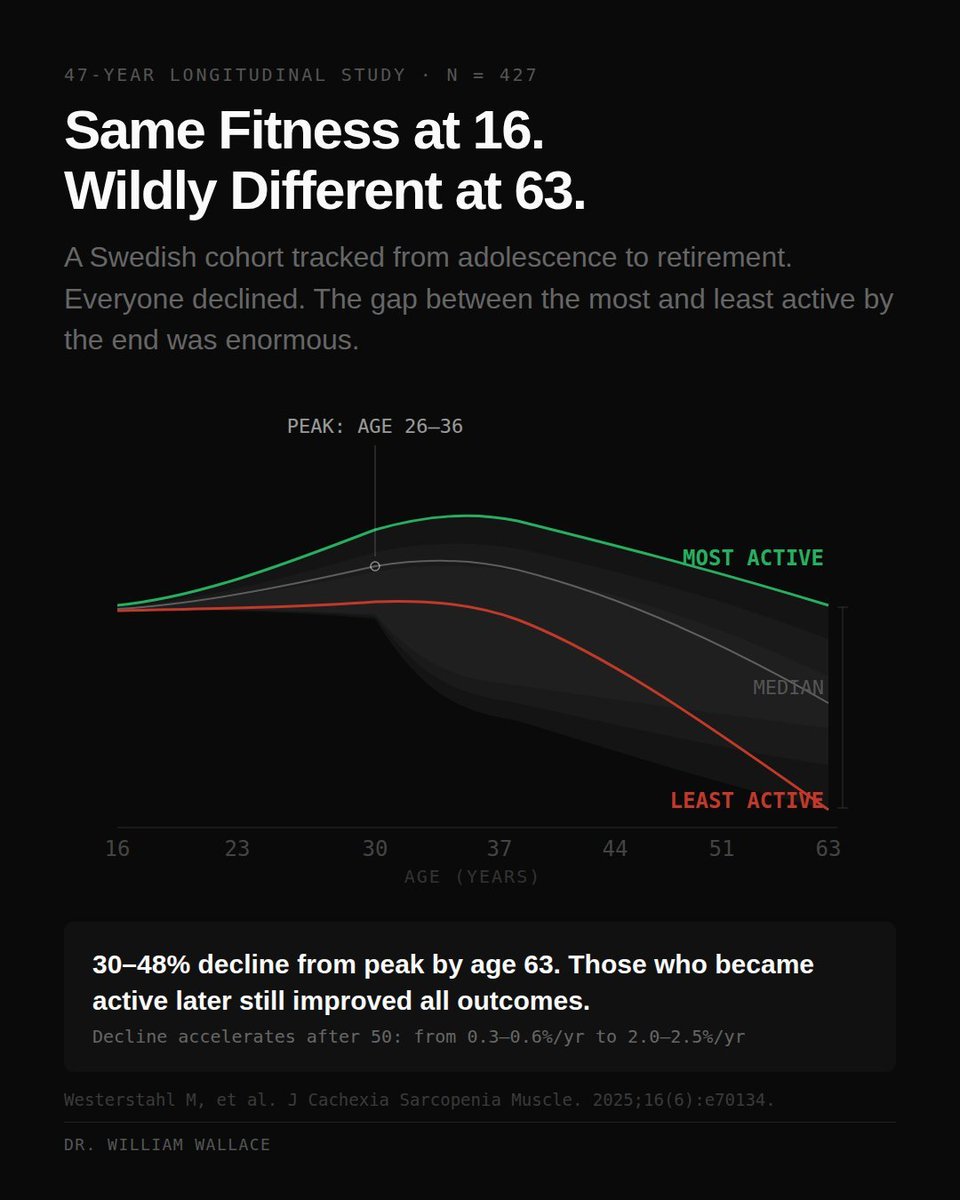
427 people. Same fitness at 16. Measured again at 23, 30, 37, 44, 51, and 63.
By the end, the most and least active weren't even on the same chart anymore.
Everyone's aerobic capacity peaks somewhere in their late 20s to mid-30s. After that, everyone declines. Slowly at first, then sharply after 50. That part is inevitable.
What isn't inevitable is where you end up. The spread between the most and least active by 63 was enormous, and it wasn't explained by where they started.
Here's the part that matters if you feel like you missed the window: people who were inactive early but became active later didn't just slow their decline. They reached their personal peak fitness later than the always-active group. If you weren't training at 25, your body can still be improving at 45.
The caveat matters though. Your late-arriving peak will almost certainly be lower than it would have been if you'd built that base earlier. The ceiling is shaped by what you did in your 20s and 30s. But a lower peak you actually reach beats a theoretical one you never did.
The fan in this chart isn't genetics. It's decades of accumulated decisions about movement, and those decisions compound in both directions.
Westerstahl M, et al. J Cachexia Sarcopenia Muscle. 2025;16(6):e70134.
If you do the opposite of a LOSING trading strategy, does it lead to PROFITS?
I made such an experiment and wrote an article about it! 👇
x.com/BenSltn/status…