Jesse D Berman

13 posts

Jesse D Berman

Jesse D Berman

@BermanJD

Environmental epidemiologist at U. Minnesota; public health researcher; Buffalo Bills and Yankees fan; Brooklyn born

Katılım Ağustos 2021
14 Takip Edilen11 Takipçiler
Jesse D Berman
Jesse D Berman@BermanJD·
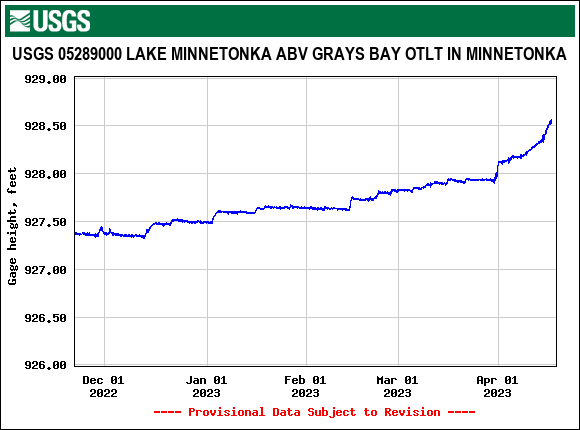
@graysbaydam Can you state what “avg” lake levels would be in your updates? It’s useful to compare against ‘lower-than-average.’ In St Louis Park, the creek is already shrinking and has not filled Meadowbrook marsh
English
1
0
0
52
Gray's Bay Dam
Gray's Bay Dam@graysbaydam·
Lake Minnetonka Level:928.57 Dam Discharge:Closed The lake has risen 14.88” since the last reading on 11/28/22. The dam is closed due a lower-than-average lake level for mid-April and because Minnehaha Creek is flowing ~57cfs at Hiawatha Ave. ~1 in. of rain is forecast 4/19-20
Gray's Bay Dam tweet media
English
1
2
9
6.2K
Jesse D Berman
Jesse D Berman@BermanJD·
@dorkwad @dhmontgomery In other words, hospitalizations with COVID are now reflective of 'epidemiological pandemic' trends and not 'operational pandemic' trends, which emphasize hospital capacity and not prevalence of disease. Same data as a year ago...but different interpretation.
English
1
0
0
0
Jesse D Berman
Jesse D Berman@BermanJD·
@dorkwad @dhmontgomery COVID hospitalizations should be viewed as a cross-section of random people (who happen to have broken bones, strokes, stitches, etc). Decreasing rates means less general population COVID, since these people would seek care regardless of status. With/for is less important
English
2
0
0
0
David H. Montgomery
David H. Montgomery@dhmontgomery·
The first two years of the #COVID19 pandemic in Minnesota have seen big spikes in confirmed cases and hospitalizations in late October/early November. SO FAR there's no sign of that; metrics are still trending down. (And don't ask about the impact of home tests, that's not it.)
David H. Montgomery tweet mediaDavid H. Montgomery tweet media
English
4
6
48
0
Jesse D Berman
Jesse D Berman@BermanJD·
@dhmontgomery So it's not just preference, but actual physiological response that can vary spatially.
English
1
0
0
0
Jesse D Berman
Jesse D Berman@BermanJD·
@dhmontgomery This phenomenon is often observed in extreme weather & health evaluations. Areas less prone to events will show greater effect estimates, even after adjustment. E.g. That Buffalo, NY heatwave is far worse than a comparable heatwave in Montgomery, AL
English
1
0
0
0
David H. Montgomery
David H. Montgomery@dhmontgomery·
At what temperature does it become “hot” for you, as opposed to merely warm? When does it become “cold” vs. merely cool? Please take this quick survey with your answers and some basic info about your gender and geography: forms.gle/vJH7wjUXFigRzQ…
English
27
30
68
0
Jesse D Berman
Jesse D Berman@BermanJD·
Sad news on the loss of E.O. Wilson. A true giant in the field of evolutionary biology. He showed that studying the smallest of creatures can yield big clues about the greater world washingtonpost.com/local/obituari…
English
0
0
0
0
Jesse D Berman
Jesse D Berman@BermanJD·
Considering I spend a few hours revising a syllabus before the semester, I wondered how many students actually read it
English
0
0
0
0
Jesse D Berman
Jesse D Berman@BermanJD·
@dhmontgomery I wonder if spatial trends explain this. High vaccination pushes Covid spread into unvaccinated pockets with less widescale infection. A long aggregate duration may reflect many localized peaks, but without a single temporally aligned one.
English
0
0
0
0
David H. Montgomery
David H. Montgomery@dhmontgomery·
The big picture: the current wave keeps lingering on without ever quite starting a sustained decline. I’m not sure how much to make of the duration here, though — it’s possible that the really low viral incidence we saw in early July puts us in a different boat.
David H. Montgomery tweet media
English
2
3
13
0
David H. Montgomery
David H. Montgomery@dhmontgomery·
Tuesday’s #COVID19 report was encouraging. Yesterday’s (4 days in one) was discouraging. Today’s is encouraging again. The big picture: over these three uneven reports covering 6 days of data, MN has 9,080 cases on 155K tests, a 5.86% positivity rate, slightly up from before.
David H. Montgomery tweet mediaDavid H. Montgomery tweet media
English
2
8
34
0
Jesse D Berman
Jesse D Berman@BermanJD·
@Marcel_LJ 7-days is still an arbitrary number. Best new delta variant specific data shows ~4 days from exposure to detectable viral loads. Much faster than original strain. A test every 3-4 days will be more effective to capture positives and reduce spread.
English
0
0
0
0
Jesse D Berman
Jesse D Berman@BermanJD·
@Marcel_LJ As an epidemiologist, @Marcel_LJ is correct. The delta variant is an entirely different beast and assuming that vaccinated can't be spreaders is outdated (vaccines still highly effective against severe disease). NFL should increase testing to keep everyone safe.
English
1
0
4
0
Marcel Louis-Jacques
Marcel Louis-Jacques@Marcel_LJ·
I’ll be honest, beyond incentivizing players to get the vaccine, I don’t really understand the point of testing vaccinated players every two weeks instead of either every week or daily — Brandon Beane said the league didn’t offer an explanation for the policy
Matthew McEwen@daddymatt53

@Marcel_LJ Why are all players not tested equally? If goal is to stay healthy throw out vaxed and unvaxed players. Treat every1 the same bcuz every1 is playing for the same goal. Can’t the bills go above what league instructs. To ensure each player is ready to play

English
15
4
96
0