BrightonR retweetledi

Presenting your statistical models in a clear and professional manner is as crucial as the analysis itself. Here's a simple method to make this process very easy!
LaTeX, a high-quality typesetting system, is often the go-to for academic and scientific documentation due to its ability to handle complex tables and mathematical expressions with elegance. When it comes to sharing the results of a regression model, seamlessly integrating these results into a LaTeX document can elevate your work's clarity and impact.
This is where R and the xtable package come into play, providing a straightforward pathway to bridge your analysis with LaTeX's typesetting capabilities. Here’s how:
# Load xtable
library(xtable)
# Load example data
data(mtcars)
# Linear regression
my_mod <- lm(mpg ~ wt + qsec, mtcars)
# Summary statistics
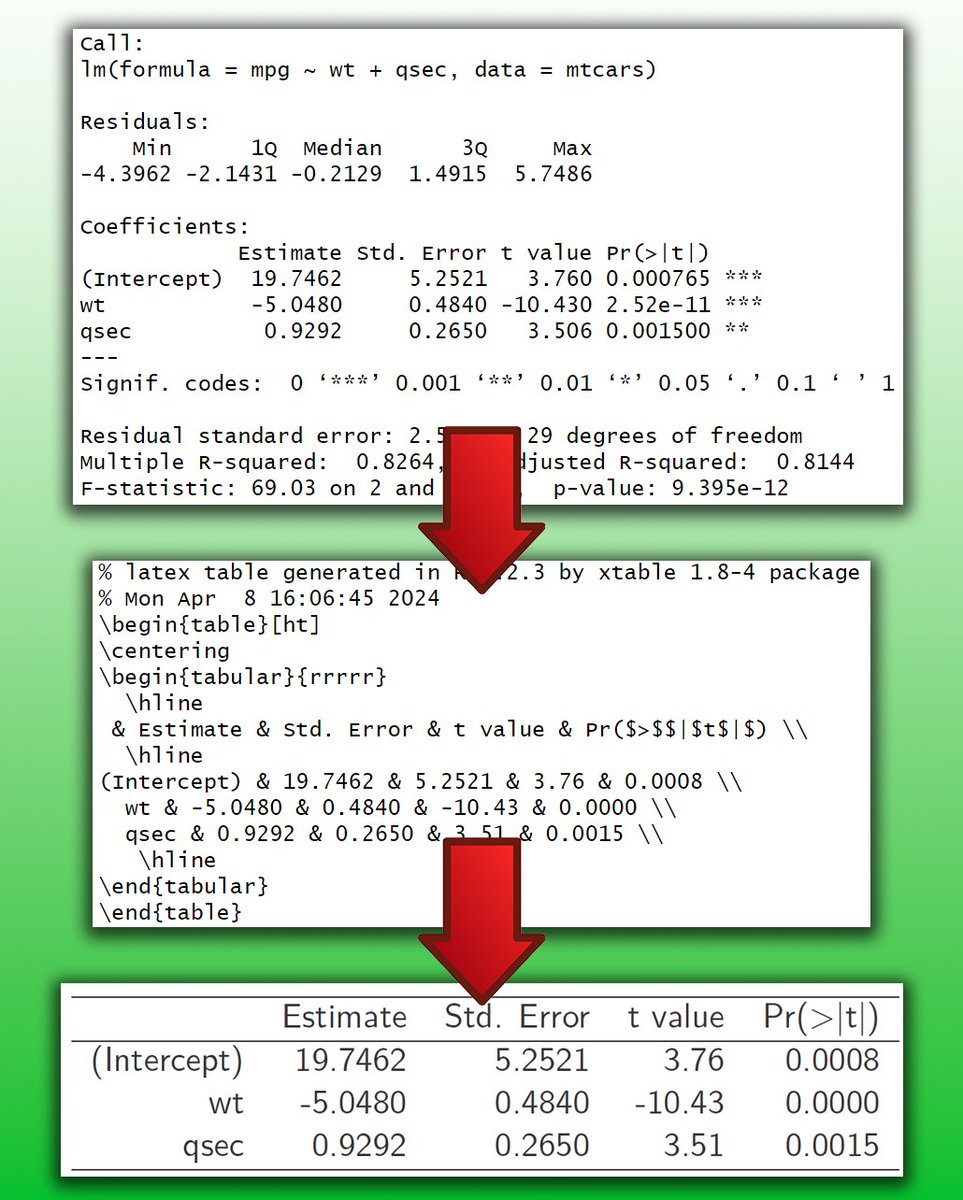
summary(my_mod)
# Create LaTeX table
print(xtable(summary(my_mod)), type = "latex")
This code snippet accomplishes a few key tasks:
📊 Data Analysis: Utilizes the mtcars data set to perform a linear regression, examining how the variables wt (weight) and qsec (quarter-mile time) predict mpg (miles per gallon).
🔍 Statistical Summary: Provides a comprehensive summary of the regression model, offering insights into the relationships between variables.
📝 LaTeX Integration: Converts the model summary into a LaTeX-friendly table using xtable, making it ready for inclusion in any document or publication. This step is crucial for researchers and analysts who need to present their findings in a standardized and visually appealing format.
By leveraging xtable with R's analytical power, you can efficiently prepare your regression analysis results for high-quality documentation, enhancing readability and professionalism in your presentations or publications.
#rstats #statistics #regressionanalysis
English