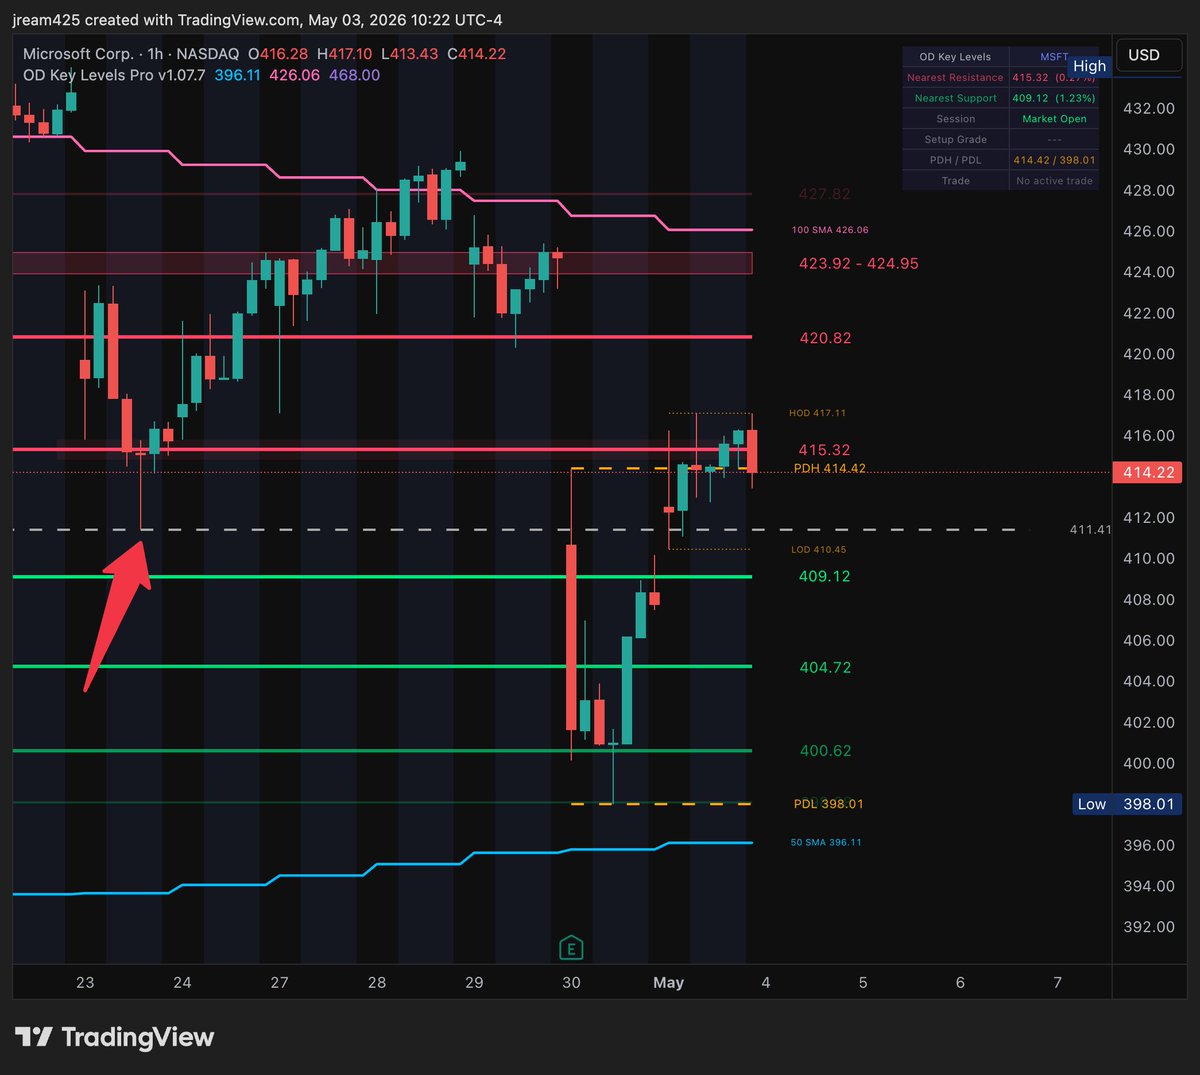
@hb_stocks @grok any stock in qqq or spy with similar pattern bullish ? For whole may 2026 ?
English
Bobby
33 posts


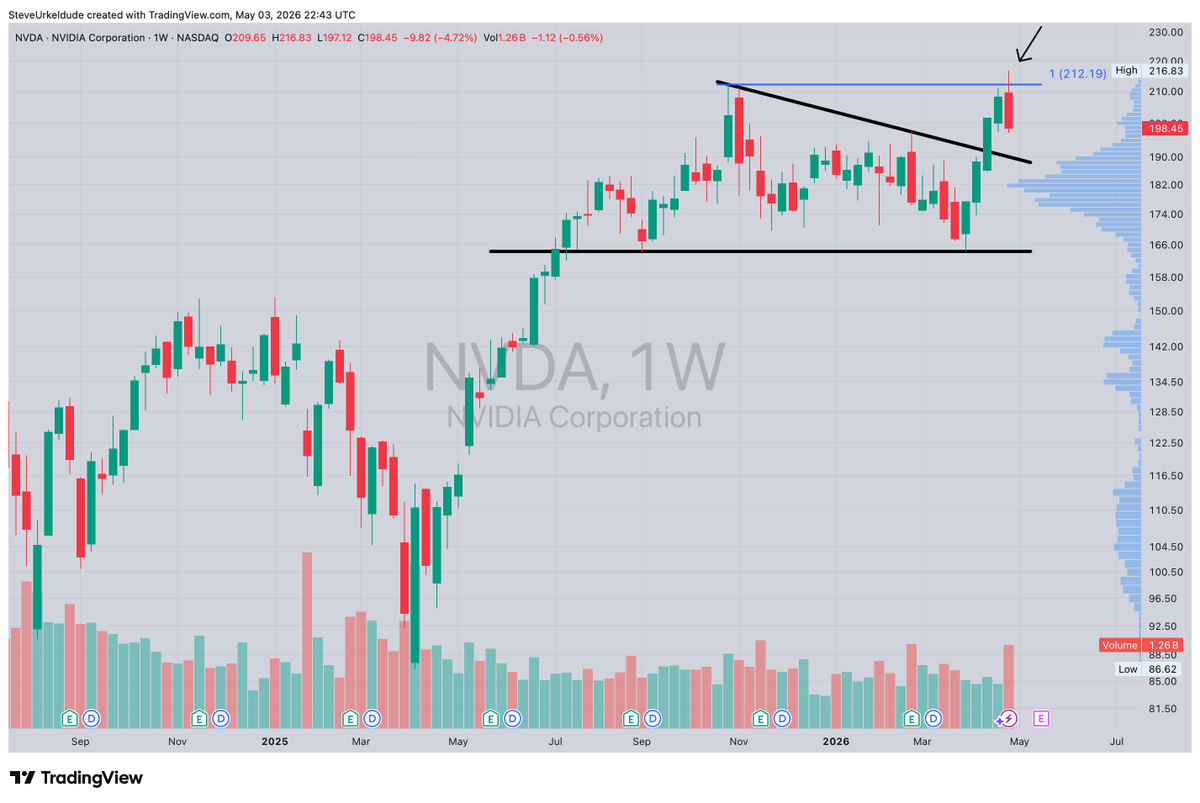
$NVDA with a beautiful breakout, all time highs within reach now, and potentially, a bigger breakout above that.. setup was gorgeous.


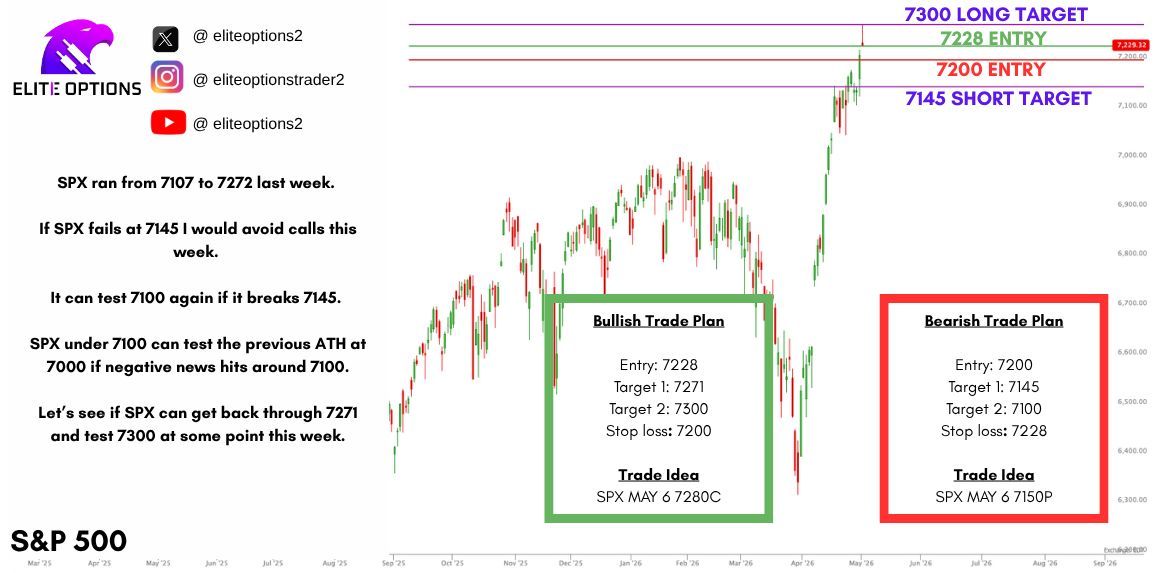
92% probability SPY crashes in May–June. Back under $700 → targeting $650. 5 massive reasons: 1. Fed instability + Kevin Warsh test = policy shock Markets hate uncertainty and the Fed is entering one of its most unstable periods in years. With political pressure rising and potential leadership shifts, policy direction becomes unclear right when inflation is still sticky. Historically, transitions or uncertainty around the Fed have led to volatility spikes and equity drawdowns. If markets lose confidence in rate control, multiples compress fast. 2. Tech is still historically overvalued (and fragile) SPY is trading around ~20.8x forward earnings well above long-term averages during uncertain macro periods. At the same time, return on equity is sitting near ~20% vs historical ~14.5%, signaling peak profitability conditions that are unlikely to sustain. 3. Rate cuts delayed → liquidity stays tight Inflation is re-accelerating (~3.3% recently), largely driven by energy and geopolitical factors. This forces the Fed to keep rates higher for longer—crushing the “rate cut rally” narrative. Markets priced in easing… but reality is tightening. When liquidity doesn’t come, assets reprice lower. 4. US–Iran war → oil spike → inflation shock Oil markets are now in a war-risk regime, with supply disruptions and rising costs hitting global economies. Energy prices are already forcing companies to downgrade outlooks and cut capacity. This creates a toxic loop: Higher oil → higher inflation → no rate cuts → lower valuations. That’s how crashes start. 5. Buffett sitting on massive cash = warning signal When the greatest investor alive refuses to deploy capital, you should pay attention. At peak cycles, Buffett historically builds cash not because he’s bearish short-term, but because valuations don’t justify risk. Combine that with: Rising layoffs Slowing hiring AI displacing entry-level jobs …and you get early-stage demand destruction forming beneath the surface. Even economists are warning unemployment could rise meaningfully as growth slows. I think the sell off is triggered middly of May closer to May 15, 2026 for FOMC.