
Caleb Valerga
556 posts
Caleb Valerga
@CalebValerga
| 23 | Crypto enthusiast since October 2021 | Finance & Accounting Graduate | ICT Trading | Health & Fitness |
South Africa Katılım Mart 2018
119 Takip Edilen79 Takipçiler


@astronomer_zero Are you still holding 100% of your alt coins and if so, what % of total exposure is spot altcoin ?
Bless the altcoin-only holders with some peace of mind Astro
English

Sometimes I don't get the altcoin perma bears or any perma bears in general.
It's certainly true that they haven't performed in a similar sense as last cycles. But at certain times, there still have been undebiably great opportunities, enough to remain interested in them ready to strike at any time.
Perma bears are entertaining and seem smart, but if opportunities align themselves, why not take them instead of being blind to them constantly?
The same way silver pumped, was it worth it? Even with the wait, yes it was in some ways.
Timing is key with these type of assets, but that is always the case for altcoins, as most go to 0, especially against BTC, or range forever (opportunity cost becomes too high).
But even if they aren't that good, at some times, they give really good opportunities hard to ignore.
And to find those times, I'm here to help. Such as the time of the post below, we called for everything to send it. $BTC went up 50%+ and almost every altcoin out of the top 30 went up 300%.
Of course, altcoin permabears still seem as if they were "right" because for a lot longer, alts went down. But yet, they likely made less money than if they were opportunistic.
This is another reason why focusing on making money is a lot more important than focusing on being "right".
Being right is not properly defined. Making (or losing) money, is. Classic example.
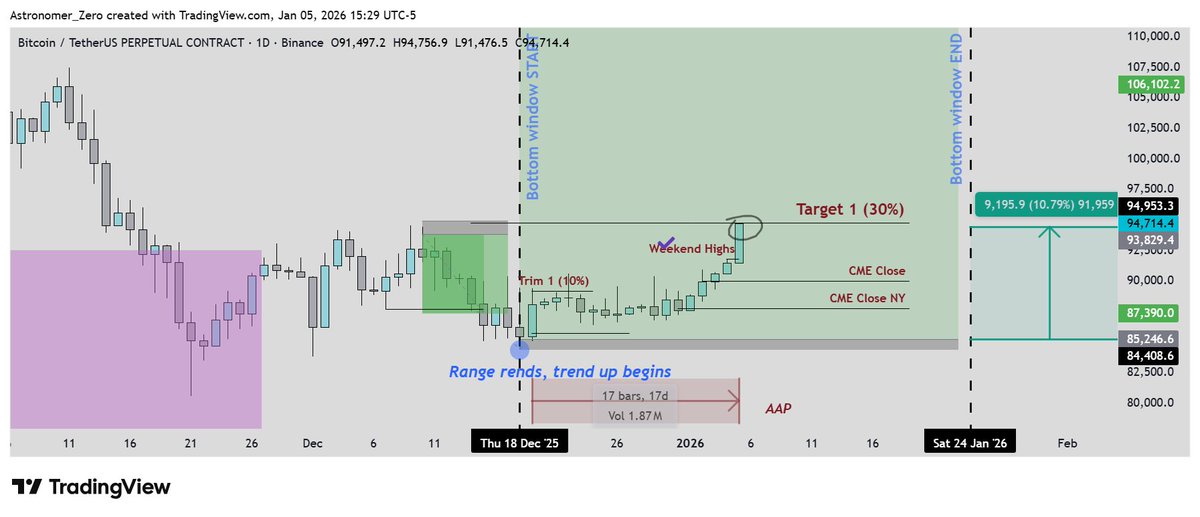
Astronomer@astronomer_zero
$BTC and #crypto There is a 90.879% chance we moon, very soon In conjunction with the previous post where I dropped a teaser on my thinking that we will break out rather soon, I made another big data analysis deep dive, just now, to not leave you stranded, and show you highly significant data, forming the basis of my stance of why I think it's time to break out to the upside. I have more data in my toolbox to support this, but I'm here to share the most basic and effective one to keep it light-hearted and to the point, easy to understand. My core thesis Indeed the fact that we have been ranging for 6 months is the basis of my thesis. We know and highly believe that markets are subjected to time and time is the strongest actor on price. Those are the fundamentals of Cycle theory and everything is built on it (Gann cycles, Elliot wave theory, Smart Money Concepts, you name it). But of course, 'a range' is not always easy to define, because, which ranges am I talking about, how can we compare this to ranges in the past? Technically, $BTC has been 'ranging' between 20k and 70k for nearly 5 years, with some deviations above and below. But we know there have been bull and bear markets in between which are hard to call 'a range'. So, before continuing, I first need to give a definition of how I defined a range in this analysis, where it begins, and where it ends, because there is a lot of discretion there. Definition of a macro range A range is a period of time of price moving up and down between two price points. Now, I personally limited those two price points to not be more than double from each other. So the move from range high to range low is no larger than a 50% drop. This is an arbitrary choice, but I think you can all agree that the drop from the top in May 2021 to the bottom in June 2021 should not be considered a range anymore, nor the rally from the low in June 2021 to the high in November 2021 either. Respective high-low differences are a -55% and -58% drop. So that is where I draw the line. And I also think we can all agree that the drop from the June 2019 highs to the covid crash lows are also not part of the same range, but instead an entire bear market on its own. All other price boundaries are indeed ranges. Next, I need to define when the range begins and ends. And with the number one theorem to define ranges: the midrange theorem, that is quite easy: 'a range begins and ends when it visits the midrange point for the first and the last time'. That's IMO very intuitive as, when you expect the price no longer to return to the midpoint, it also won't continue to range lows (if a breakout is coming) or range highs (if a breakdown is coming). So that definition also allows you to position at the midrange (the classic midrange consolidation) before breaking out or breaking down. In other words, this definition not only defines the range cleanly, it also is great for execution. And the cherry on the cake, this definition also automatically causes at least a 50% drop or 100% pump after a breakout by the nature of my definition. (otherwise, I would still count it under the same range). So now we have a proper definition and I can analyze what history has done and how long #bitcoin likes to range. Core data analysis & results So I chose to analyze from the moment CME group started trading, which is around the peak of 2017. I could go earlier but the CME cutoff suits a nice chart, price beforehand was rather naturally driven, and it's the first time 'boomers' stepped foot in the $BTC market. I could include even more data, but it doesn't change much to the thesis and as you will see, this is already very significant. Using our definition pointed out, I detected 18 ranges (excluding the one forming currently). A nice amount of data points that falls within the acceptability of our type of deep dive data analyses. All 18 ranges are marked in the purple box, with the lengths and widths defined as per definition. By the cleanliness of the chart, it clearly shows IMO how clean the definition is. And now we can do our statistical analysis: ➡️The average duration of a range is 14.7 weeks ➡️The standard deviation is 10.4 weeks Our current range has been lasting for 29 weeks, but tomorrow that will be 30. So, based on our definition and assuming a normal distribution (which is pretty normal as many things in nature follow a normal distribution, financial markets are no exception), The chance that price no longer revisits the current midrange after tomorrow (60.2k) = 90.879% This chance increases every week (time is on our side) For example, the chance that price no longer revisits the current midrange in 3 weeks = 93.790% Those percentages make sense, because out of 18 times, only once has the range exceeded the current standing duration, which was during the bottom range from June 2022 to Feb 2023. And (1-1/18) = 94.4%, which is in a similar ballpark. Conclusion Now, you know my stance of why I think this range will break up and not break down already as I've posted 3 highly reliable data analyses on that. On top, we have Q4 coming up and although it is meme-d a lot, it would be very unusual to have both October, November ánd December to be bearish, which is what you expect if you think this breaks down because if it turns down it will also be to break away from this range for the same reasons I just posted, truly a double edged sword. One that I indeed believe will be in our favor. So now you you know both the direction I expect this range to break and a time, and the latter may be running out very soon. We've been patient on waiting to position for a breakout and we have indeed been using the mindset to trade the range, but I have been promising you that, after buying the cycle bottom, I would start buying again heading into Q4 of 2024 for the second time this cycle for a breakout and hold for a significantly longer amount of time. Will you?
English
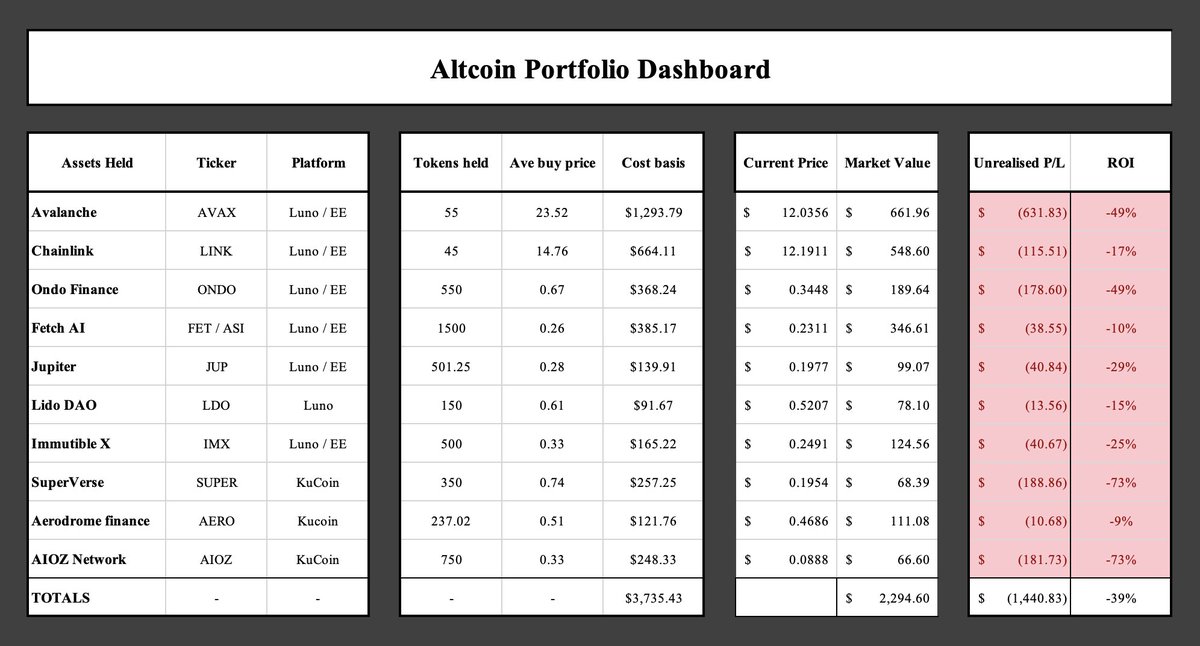
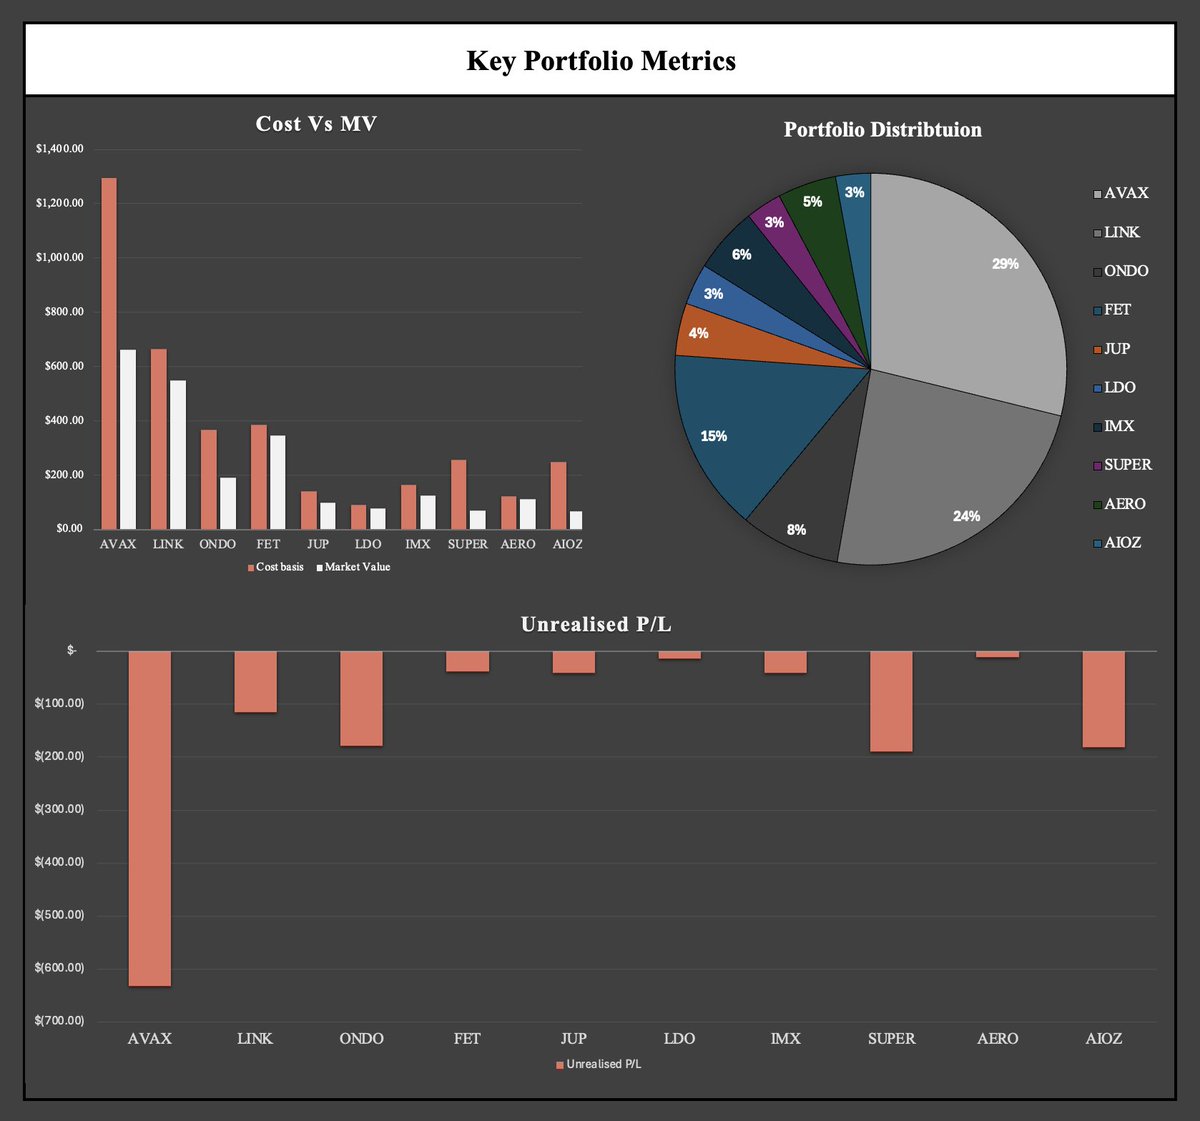
25/01 - portfolio update 1
- 10 coins held, 10 coins in a loss…
- portfolio returns = -41%
- biggest gainer (%) = N/A
- biggest gainer ($) = N/A
- biggest loser (%) = AIOZ & SUPER (-73%)
- biggest loser ($) = AVAX (-$632)
English

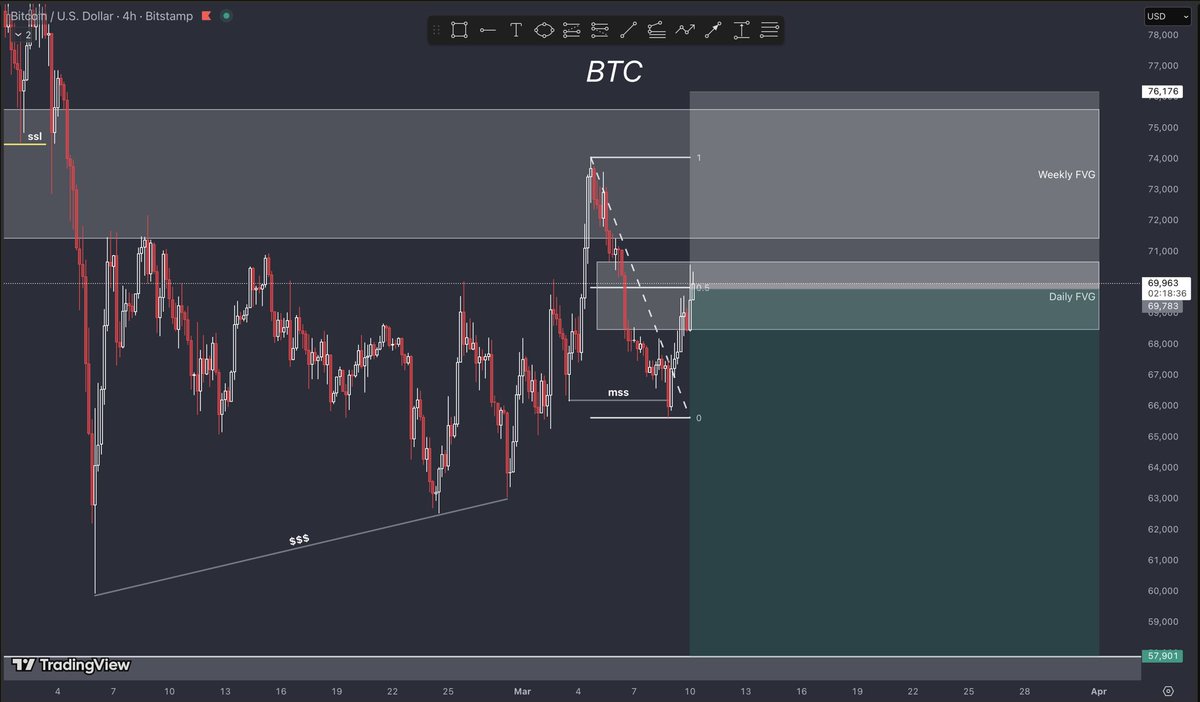
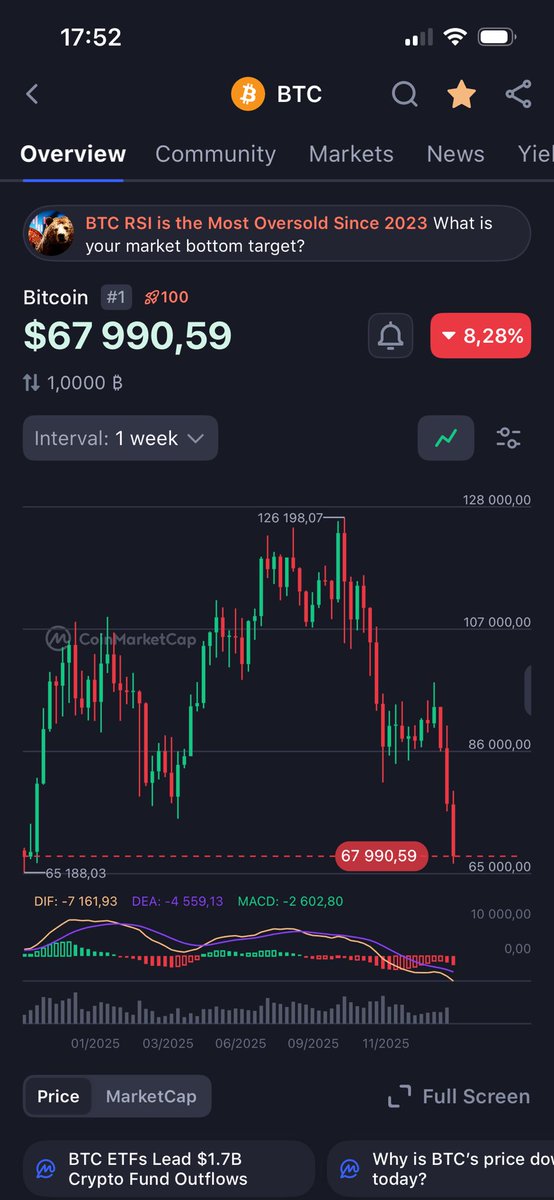
$BTC
Filled on scales 2, 3 and 4 on this initial move upwards.
Plan remains the same. Invalidation in image.

Killa@KillaXBT
$BTC | Swing Update Zero changes to my plan. "There may be multiple re-entries and potential roundtrips, which is why twapping in and out of the position is likely the smartest approach" 50% of the position is still open after securing some profits at 90K I have my limits placed upto 97K. Low leverage.
English


@astronomer_zero Been holding 87.5k since November, what a way to TP with you. Thanks Astro 🙏
English
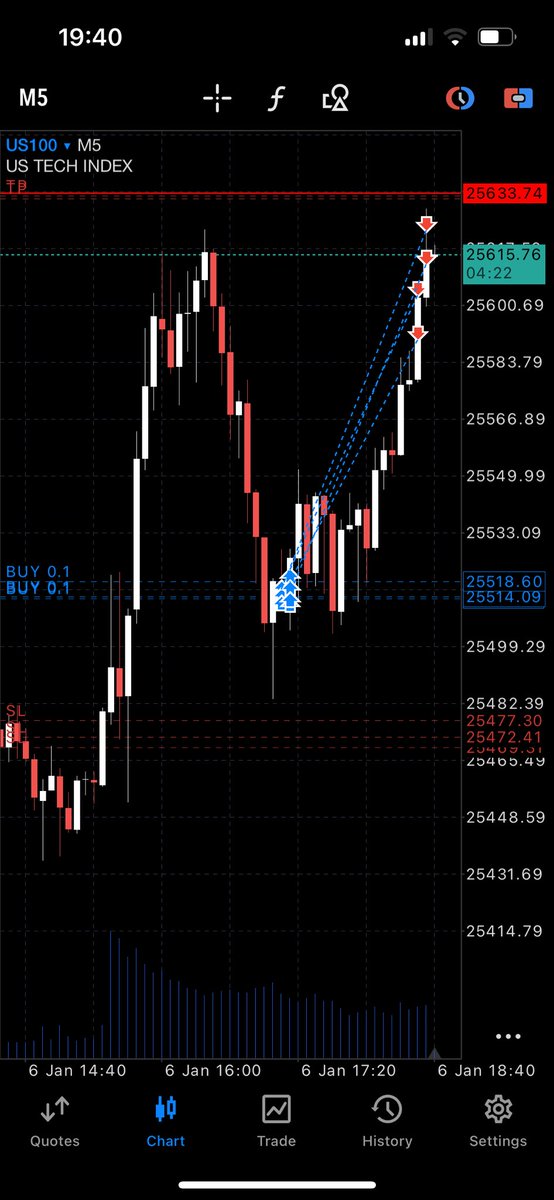
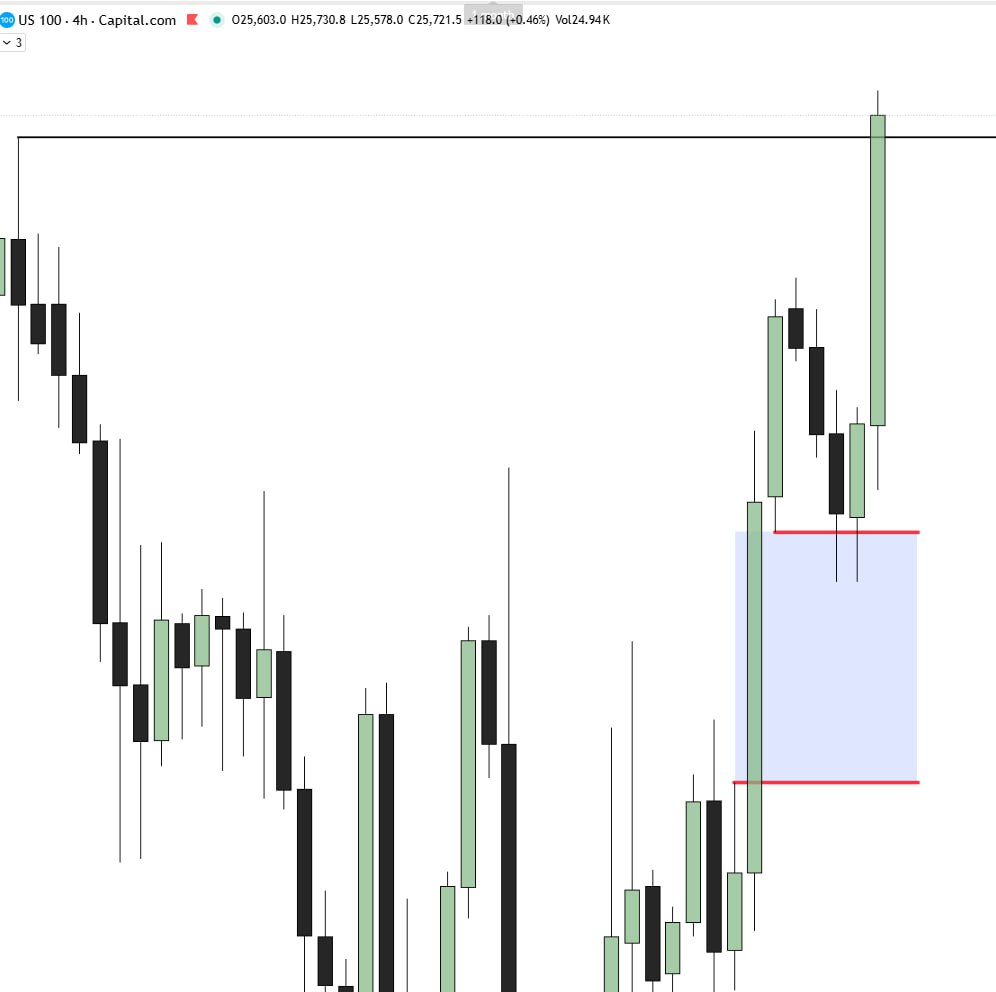
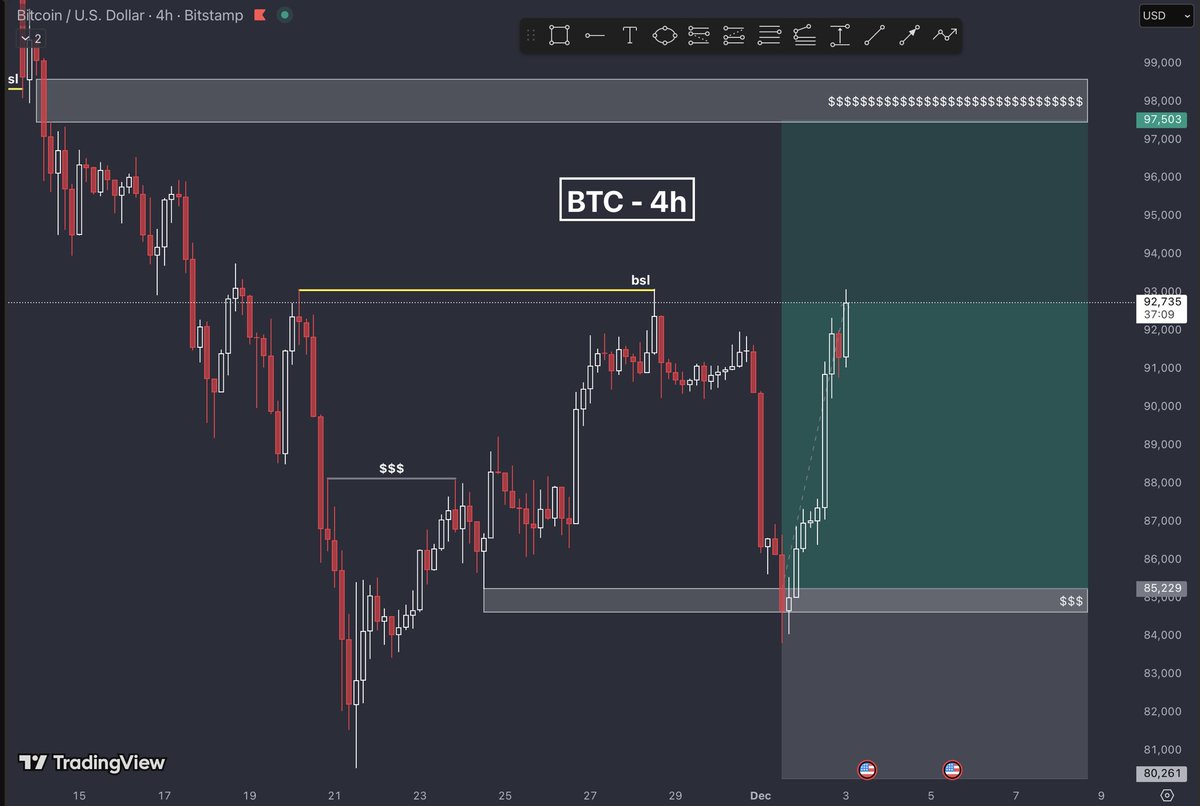
$BTC htf longs
95k area hit, and so here it is, my main target 1!
8th win in a row recured.✅
Alright! There it is. The number we have been waiting for for a while now.
We have been waiting for 19 days, that is, to finally hit our MFE of 11% and to finally hit the highs situation at the 95k area.
It's been a long wait for this target, and yes, we are technically 300$ short.
But we hit the highs above which is where liquidity lies and where we have to TP.
Development for a higher timeframe move takes time, but we said we had to earn this trade.
As we traded the range for a while, but then, we had to pack it up and said, the most ideal next trade is a long. It will be a longer hold, a trending move, a bigger move, and it will be one to remember.
Here we are, a trending move indeed, up 11%, in 19 days, hitting our target.
Our 8th win in a row, also parring my public win streak record, with everything called live. Every single trade entry and exit.
This was a trade I was very confident in.
Especially given our analysis, confidence a trending move is coming out of the chop, and with the timing and after the excessively bearish sentiment in the 80-85k range first, and the bears who keep on shorting and are in their disbelief stage, in quite the classic sense, second.
The last part of the move, was certainly fed by lots of shorts who kept on going hard into the market.
Even to a point where mindless shorts and overconfidence is portrayed, just using one confluence such as the CME gap only.
Yes, it does often fill, but not if used as a sole confluence, and not when used against an upside bias and a trending move.
Quite a classic example we are seeing live, of how overconfidence is detrimental when exerting it counter trend.
Another trade's target done and dusted...
My job, is finished for a while once again.
Let's let this liquidity unravel now, and then, I shall draw the next plan, of how I believe we travel to 112k next.
But for now, take profits here (take out 30% as we planned out), we are at major liquidity, and lock in the official win.
Thank you for watching.
And I will see you later.
Astronomer@astronomer_zero
$BTC recap 7 trades, 7 wins, and the 8th one in the making (once we hit 95k). Everything called live, right here on my timeline. Another small review, added a few more wins to the streak since last, now at 7. And our 8th one is in the making. Didn't post the review after 6 wins, don't want to sound repetitive or braggy all the time and rather focus on just making money. Also been quite busy during holiday season. And I don't want to make it seem as if all I do is win either. Obviously, I do take a loss occasionally. Not because my system has imperfections, it generally only has few. But I also do get slightly lazy sometimes and make mistakes, miss information of my own, or the market performs scammy moves I don't expect. Occasional losses indeed occur. So it feels quite nice to have stayed sharp all this time, seeing the range through from start to finish, hitting level after level without being on the wrong side, nor flip flopping wrongly even once, and also, the market going from bottom, to range, to chop, to trend up now, based on our bullish bias (analysis) and sentiment reads, as wished. That resulted in these 7 wins so far, with the 8th one in the making. All receipts and timestamps are on my timeline, everything is called out in live time, as well as clear callouts given each time when we range, when we chop, and when it was time to go for a bigger, trending move. We have seen it all unfold. I invite you to scroll down my timeline to find all the tweets with the dates, not a single receipt is missing. On the charts, I tried to keep all key annotations that helped us find the trades. My system is generally quite simplified, but requires key and refined logical steps, along with conviction paired with how markets work. There is a lot to unpack there, but for now, the chart I chared gives a good amount of those pieces. Sometimes during the live calls, I gave more information, sometimes I gave less information and I leave most out, as I try to get the post out there as soon as possible to you each time and my posts are already long enough. I also included a little PnL. Not something I do often as I do think it is a little cringy sometimes and should not be the goal. But just to show you what is possible. Average trade duration of 3 days and 19 hours is also interesting. Of course, that also includes the last one which as you know, has been a longer hold, part of the plan. That one certainly is pulling up the average. It's been a pleasure to share it and have you be part of it. And yes, my personal (public) record since I opened X (twitter) 2 years ago is 8 high RR trade wins in a row (catching tops and bottoms). My personal private record (beforehand) is still higher. But I don't count that (only live calls count to my standards, as you know). So we are now on 8 (in the making). Let's see if we break it. No pressure in any way. We simply continue to do what we do. But it won't be laziness or missing my own data that will cause a loss. Final disclaimers: do not risk it all just because we have been winning or win a lot in general. High win rates do invite more risk for optimal gain, and some of your DM's have shown drastic capital increases, risking it all each time. Great for a challenge, but not as a baseline. Keep trading smart, keep winning, and before you know it, you are where you never thought you would be. Final words, getting back to it: can we get 95k next? Locking in the 8th.
English
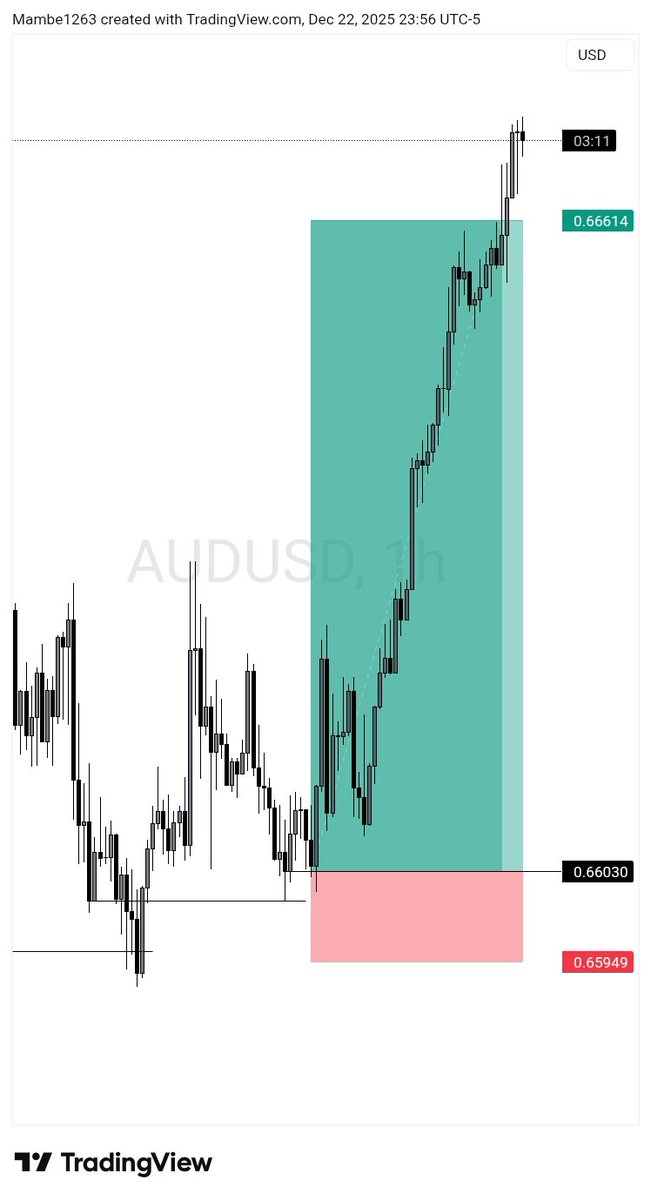
@Mambe1263 That price action doesn’t look like a battle at all
English

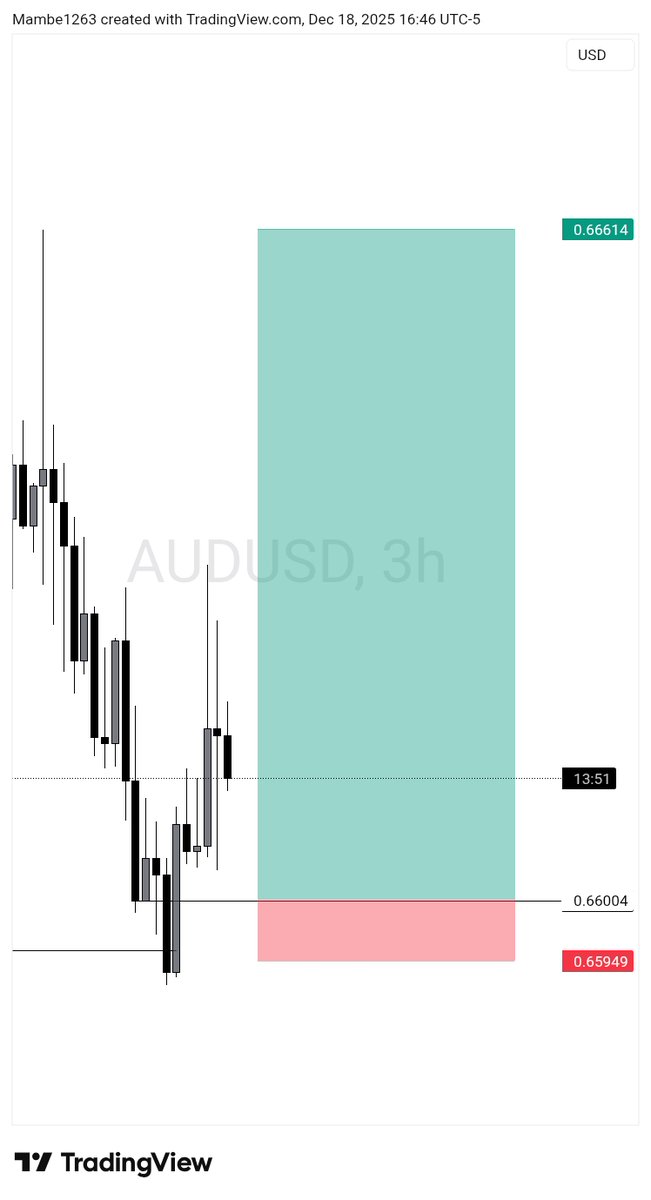

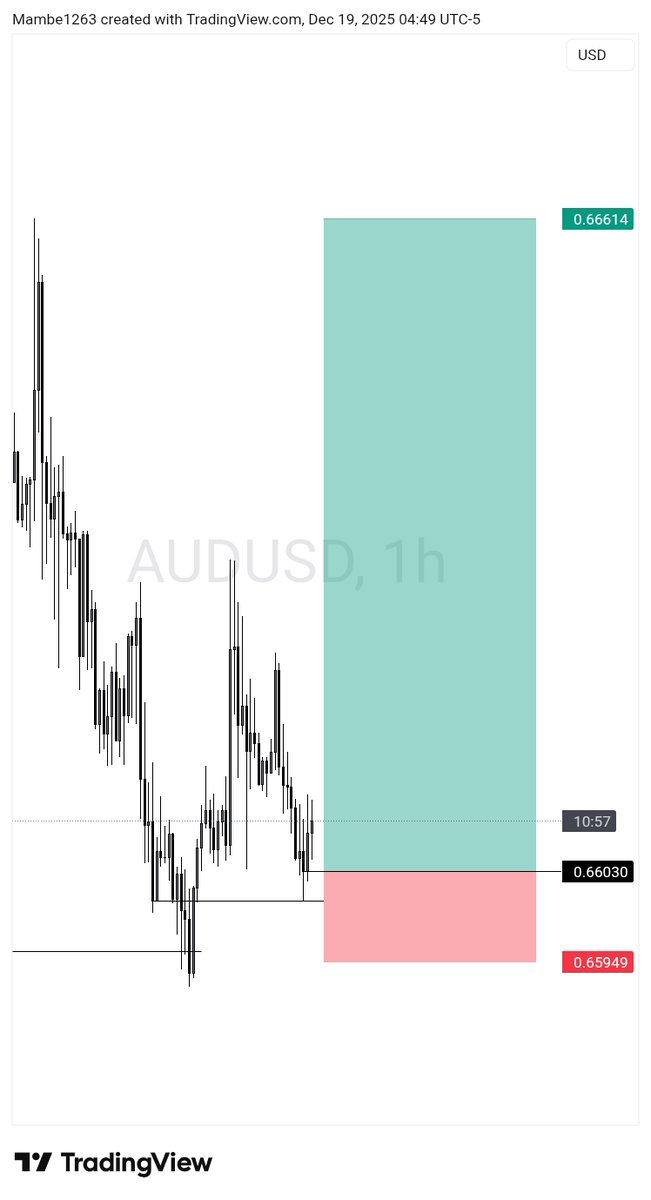
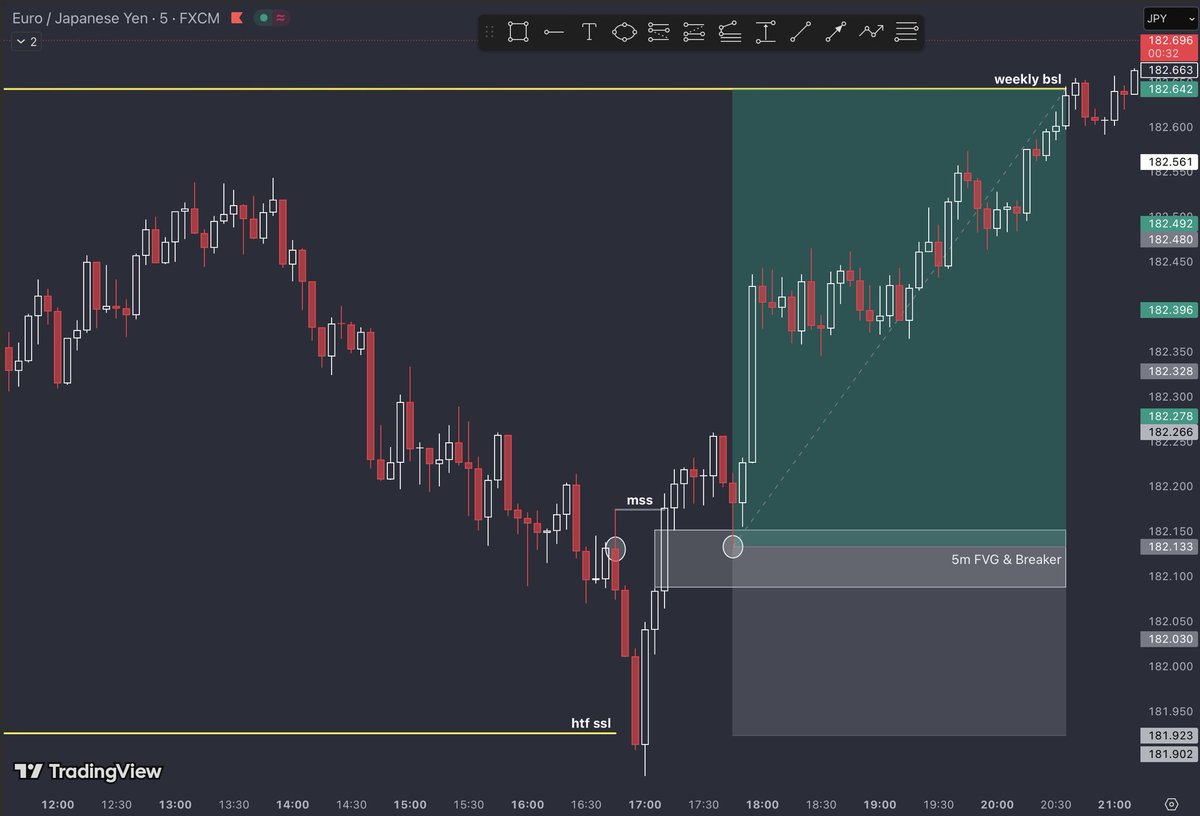

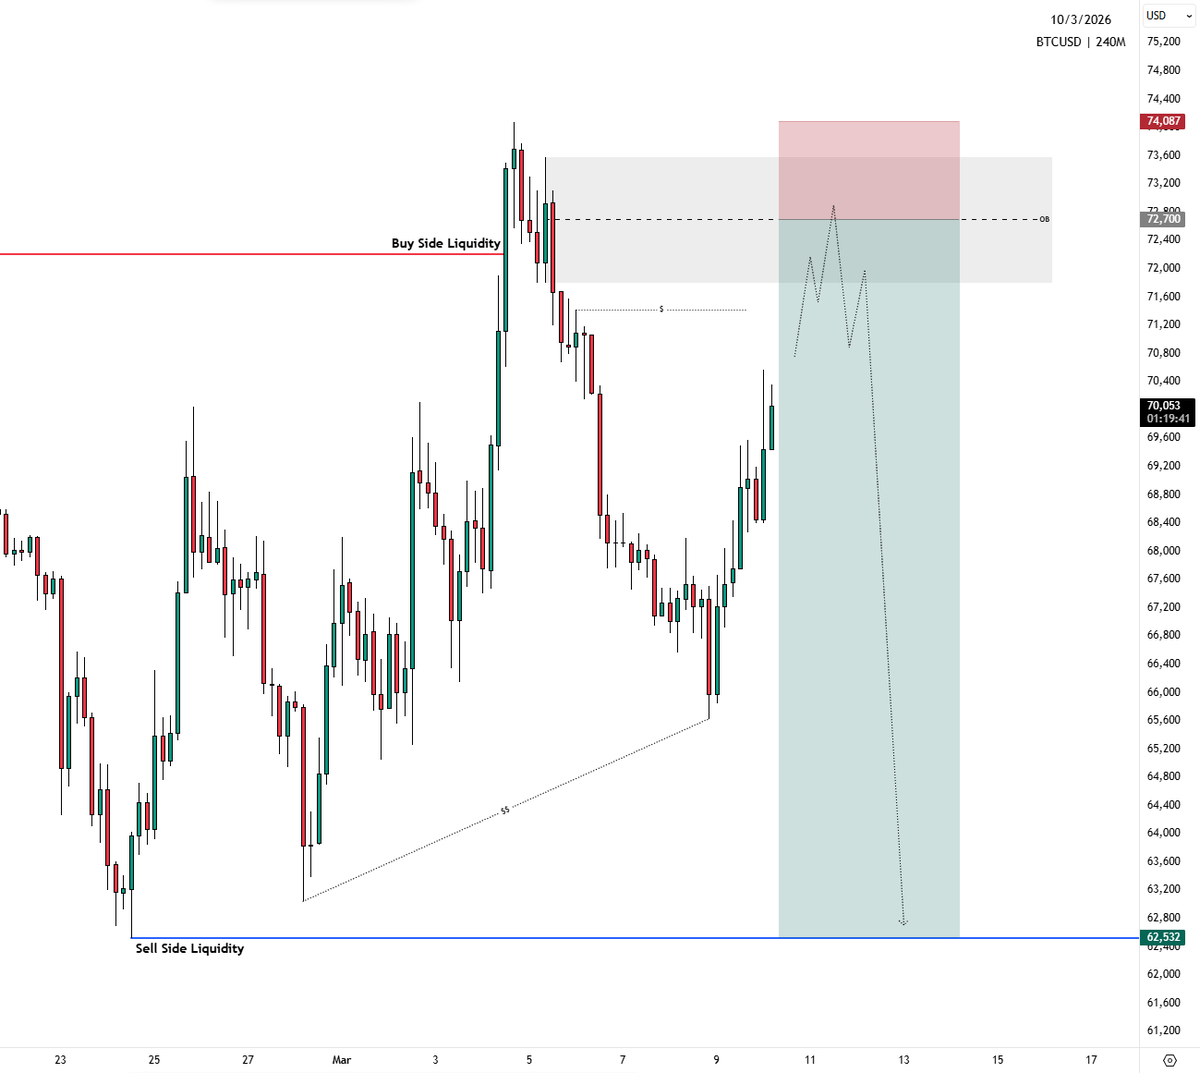
A visual explanation of refining an HTF POI into an LTF entry:
• HTF POI identified
• LTF Sell Side Liquidity taken
• Bearish FVG mitigated / violated
• CISD confirms a bullish shift in direction
• Entry taken from the first bullish FVG
• Target: Buy Side liquidity (DOL)

English
@astronomer_zero For the sake my of my entire account, let this be the final long 😮💨
English
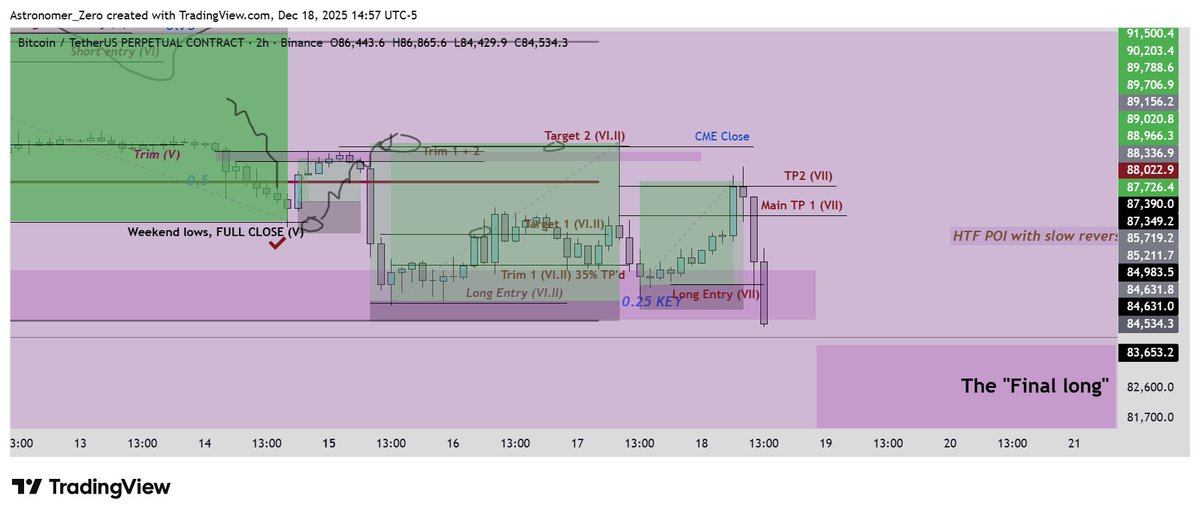
$BTC
7 wins locked, TP'd the top ✅. That leads us to the final stages of my plan.
Here are my next hints in this post, and when I believe we are done with the rejection off our 88.7k level.
Alright, nice TP pretty much at the top where our ever important 88.7k level smashed us back down.
Wanted a little higher, as mentioned, close it fully when those candles were big green. But our system does not care about what we want, hence we had to TP the top at 88.7k.
That allowed us to fully lock our 7th win in a row.
And so now... we smoothly flow into the last stages of my plan. The final long. We're not quite there yet, but I'll drop a few hints for now of when we will be.
Hint number 1 (the price hint): remember when I called for 1 more long in the low 80's? This is that one shaping up.
Hint number 2 (the time hint): remember when I hinted the bearish FOMC reversal? This is the FOMC reversal that started at 93/94 k, where we took multiple shorts and where the world was bullish. We called to target 87.7k at the very least, and then some, the exact drop we saw, and now saw through for the most part.
This long is that one where the entry comes right after when that reversal is done. So my hint leads you to: check every FOMC reversal and how long it led price down, until it stopped, where the long entry sits.
Hint number 3: this long, will be at an entry that will hold up for a lot longer, will be TP'd less aggressively. And most likely up to 112k this time, as the POI of the entry that will be reached, will likely be a larger POI with more power. Now keep in mind, number 3 is an estimate. It might take a few more longs, we must not get arrogant. But according to my predictions, it will be the last one.
These are my hints for my next trade. We're not quite there yet, and I will announce once we are. But for now, I'm waiting it out a bit until we go for the 8th win in a row and I kindly suggest to do the same.
Don't worry, I won't leave you behind. But after hitting my main targets, I must respect my system and let it reject for a while.
Enjoy the gains from last trades. Let's rest and digest. And then, the post will come.
Stay tuned.
Astronomer@astronomer_zero
$BTC longs Blazing green candles. That was quick, 88.7k target also secured, and then some. 7 wins in a row fully locked... ✅ And as if it wasn't already clear enough, here we also just reached 88.7k and then some. Quick action from a very powerful long we have the honor to be part of. Don't think I have to say much more other than the fact that that holding a bullish bias, and timing longs correctly, is the best way to make money ever since clearing out our high timeframe downside target zone underneath 87.7k. Shoutout to our purple box, shoutout to our 0.25 level, and shoutout to you all who had no doubt of this long working and are now being paid out. Nothing also I need to say. We acted upon it, we took the longs, and the market claimed my thoughts with loud words. That's two targets out, which leaves us with the runner of dreams, which is left for the big greens, details to come. But for now, enjoy the money, this is a quick pay, and let's not be greedy, and find the balance. We have predicted green, we are living green and now, we are harvesting green. Good night, my beautiful people.🧑🌾
English

@astronomer_zero What is your invalidation level / criteria for this BTC bull run?
English
Success is adhering to the paradox of trading.
No matter how confident you are in your trade, never risk it all. Only up to medium risk is ok if done deliberately imo.
But then it's about building conviction through your analysis as high as you can by going broad into the right and not the wrong areas (secrets).
Then channel that conviction mostly into holding strongly, not into large size.
The larger the size, the harder to hold strongly, so both are additive towards the limited resource of conviction that you have built in your analysis.
Analyze, build conviction and become very confident. And then enter as if you're going to lose.
That is the paradox of trading.
English


#BTC lots of bids sub 92k 🐻❤️
Short idea, not really sure if its worth it after NY pump win.

English