Sabitlenmiş Tweet

Canarinho Finance
2.8K posts

@CanarinhoFNC
45 y.o Brazilian Family Office Manager - Releasing Weekly Update of my Portfolio - Crypto, Gold, Commodities, Rates, Currencies (USD/BRL), Equities (IBOV/SP500)

Update: 21 Chicago Office Building Sales 401 S. State St. ↓94% $4.2M vs $68.1M in 2016 300 W. Adams St. ↓92% $4M vs $51M in 2012 Building split from land after 2012. 55 W. Monroe St. ↓90% $25M vs $243.25M in 2014 216 W. Jackson Blvd. ↓89% $2.5M vs $22M in 2013 100 N. Riverside Plaza ↓87% $22M vs $165M in 2005 Leasehold Interest 19 South LaSalle St. ↓86% $4.2M vs $29.9M in 2006 175 W. Jackson Blvd. ↓87% $41M vs $306M in 2018 311 S. Wacker Drive ↓85% $45M vs $302M in 2014 600 W. Chicago Ave. ↓83% $89M vs $510M in 2018 550 W. Washington Blvd. ↓83% $18.5M vs $111M in 2013 111 W. Jackson Blvd. ↓81% $25M vs $135M in 2013 70 W. Madison St. ↓77% $85M vs $377M in 2014 500 W. Monroe St. ↓76% $100M vs $412M in 2019 131 S. Dearborn St. ↓76% $137M vs $560M in 2006 250 S. Wacker Drive ↓74% $23.8M vs $90M in 2011 205 West Randolph St. ↓72% $8.0M vs $28.7M in 2016 180 North LaSalle St. ↓72% $56.5M vs $198.5 M in 2016 200 S. Wacker Drive ↓68% $68M vs $215M in 2013 161 N. Clark St. ↓62% $125M vs $331M in 2013 401 N. Michigan Ave. ↓53% $132.5M vs adjusted $281M in 2017 600 W. Fulton St. ↓44% $17.6M vs. $31.7M in 2006. @julie_kelly2 #commercialrealestate

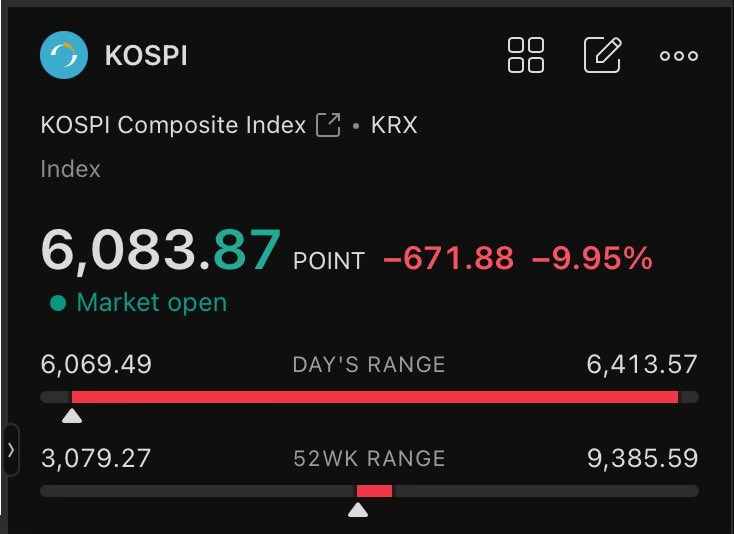
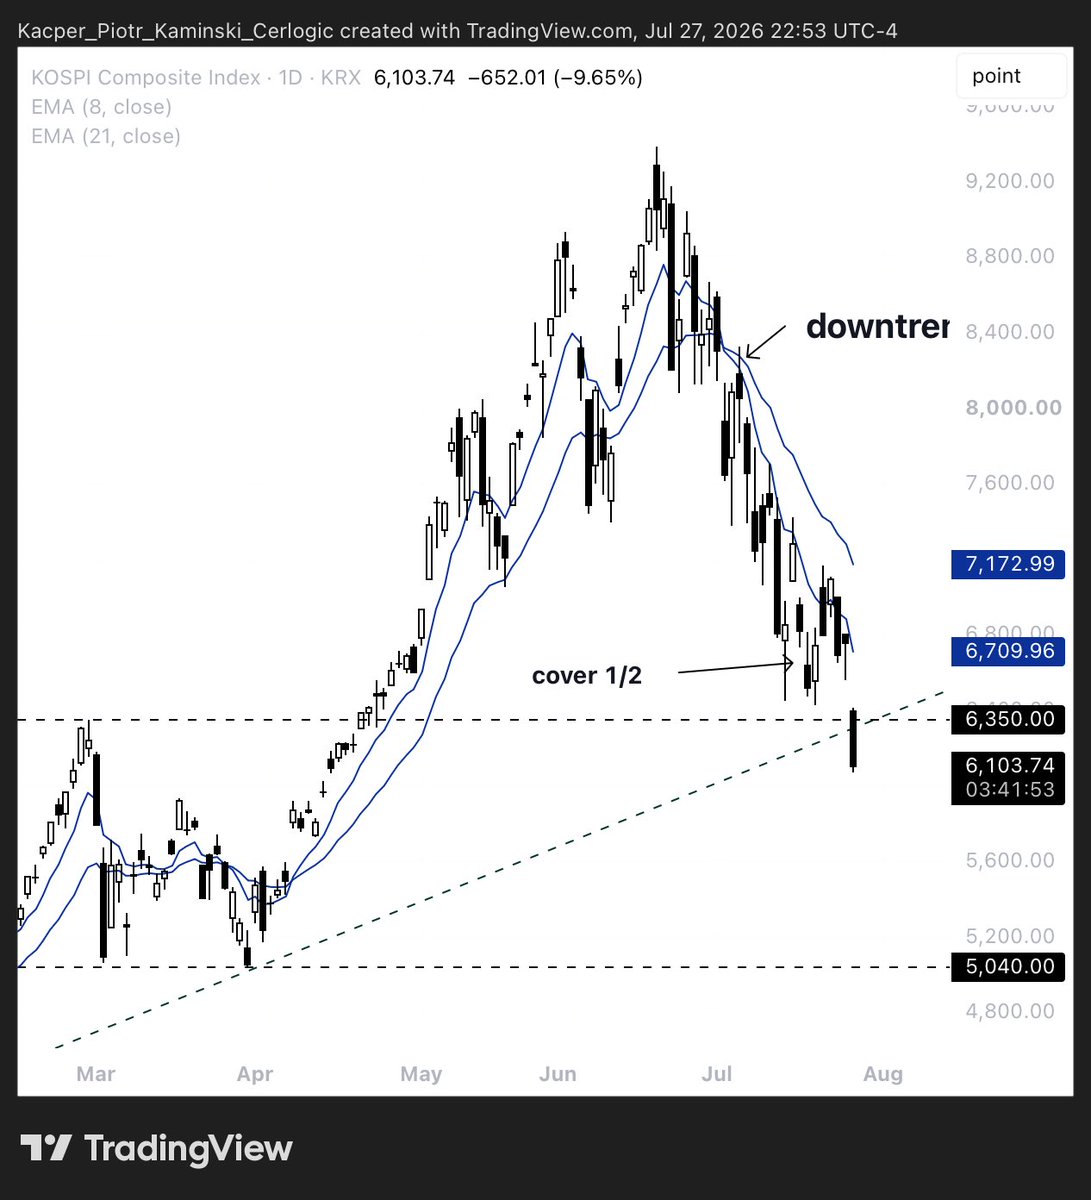
KOSPI - South Korea Great news it seems, and it's up .. 0.97% Fail on news? I was expecting at least +5.00%, I guess we all got used to the volatility. SK Hynix $SKHY reports on Wednesday, Samsung the day after. Trading plan remains the same (post below). $EWY
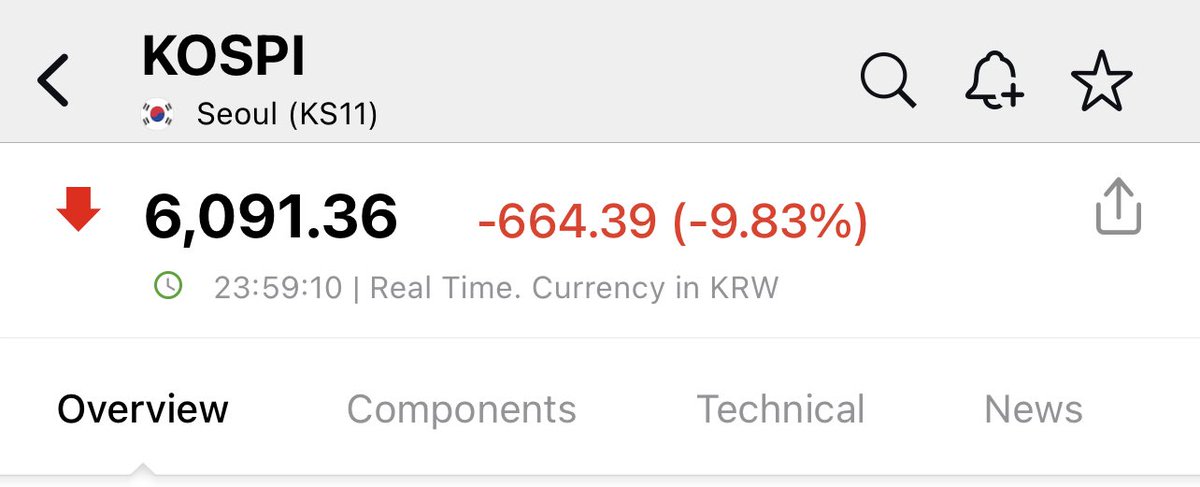


🚨🚨🚨No #Crash de 2008, fractal que estamos copiando agora, os índices Asiáticos começaram suas correções antes do S&P500, dando uma pista para nós. Um ponto tecnico importante, TODAS as correções cíclicas no mensal, começam com o M sendo feito no RSI, vejam que os asiáticos já fizeram o dele, e o americano está terminando agora, que bate exatamente com as datas do Crash americano em Setembro! Grupo Gratuito! t.me/+fgltoRFaPw1lZ…


This will act as a leading indicator for the whole tech complex. The morning we wake up and Kospi closed like in a Black Mondey Event, well this may be quite a trigger.





When the KOSPI collapses and it won't be the only index to go the history books will focus on how a market movement could get so violently ahead of itself. In just a few months, investors have priced in decades of future earnings instead of allowing for a gradual, healthy rise. While irrational exuberance has triggered devastating sell-offs in the past, the sheer ferocity of this ascent is entirely unprecedented. Unfortunately, the unwinding will be even more biblical than the surge. We have already witnessed two circuit breakers, yet on the long-term chart, those frantic halts look like a mere blip. Imagine the impending chaos across global exchanges. We are staring down the throat of daily, perhaps even hourly, circuit breaker activations. This cascading panic will likely force regulators to shut down entire exchanges for days just to let the smoke clear.