Sabitlenmiş Tweet

Cappe
8.9K posts

@Cappe90
Basketball lover in my spare time. Full-time nerd. Così avido di statistiche che me le creo da solo. (cit. @lucawizard) 🌐| https://t.co/4vAwZKZQAH 🎙| @3andPod
NOW - Netanyahu: "Jesus Christ has no advantage over Genghis Khan. Because if you are strong enough, ruthless enough, powerful enough, evil will overcome good."

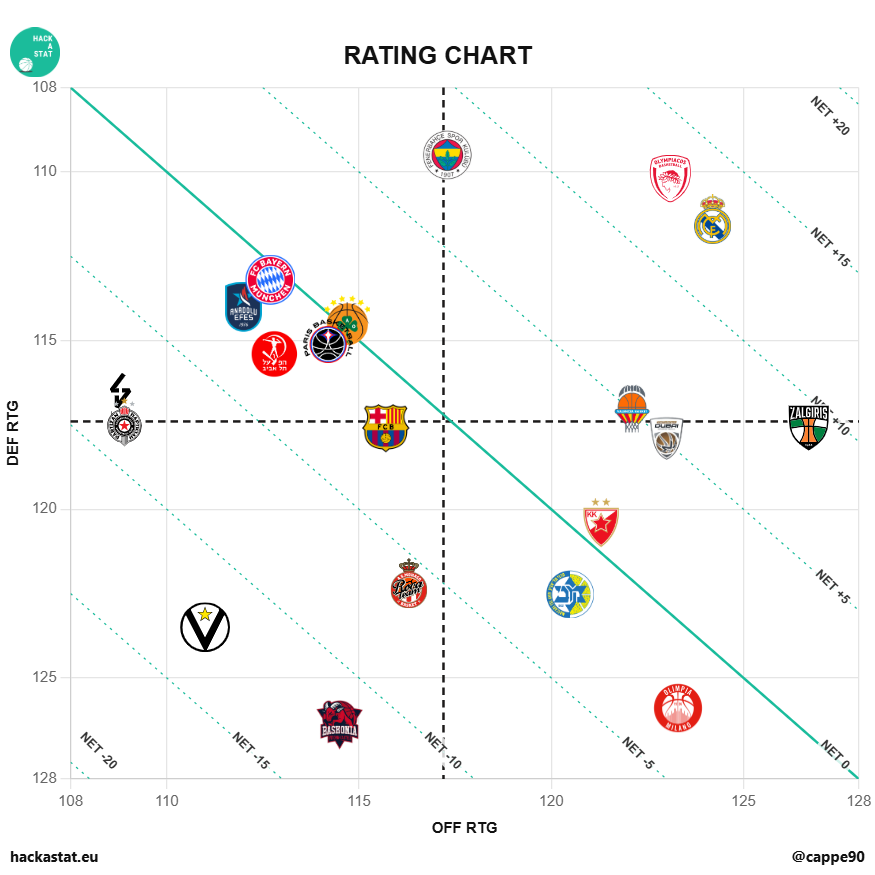
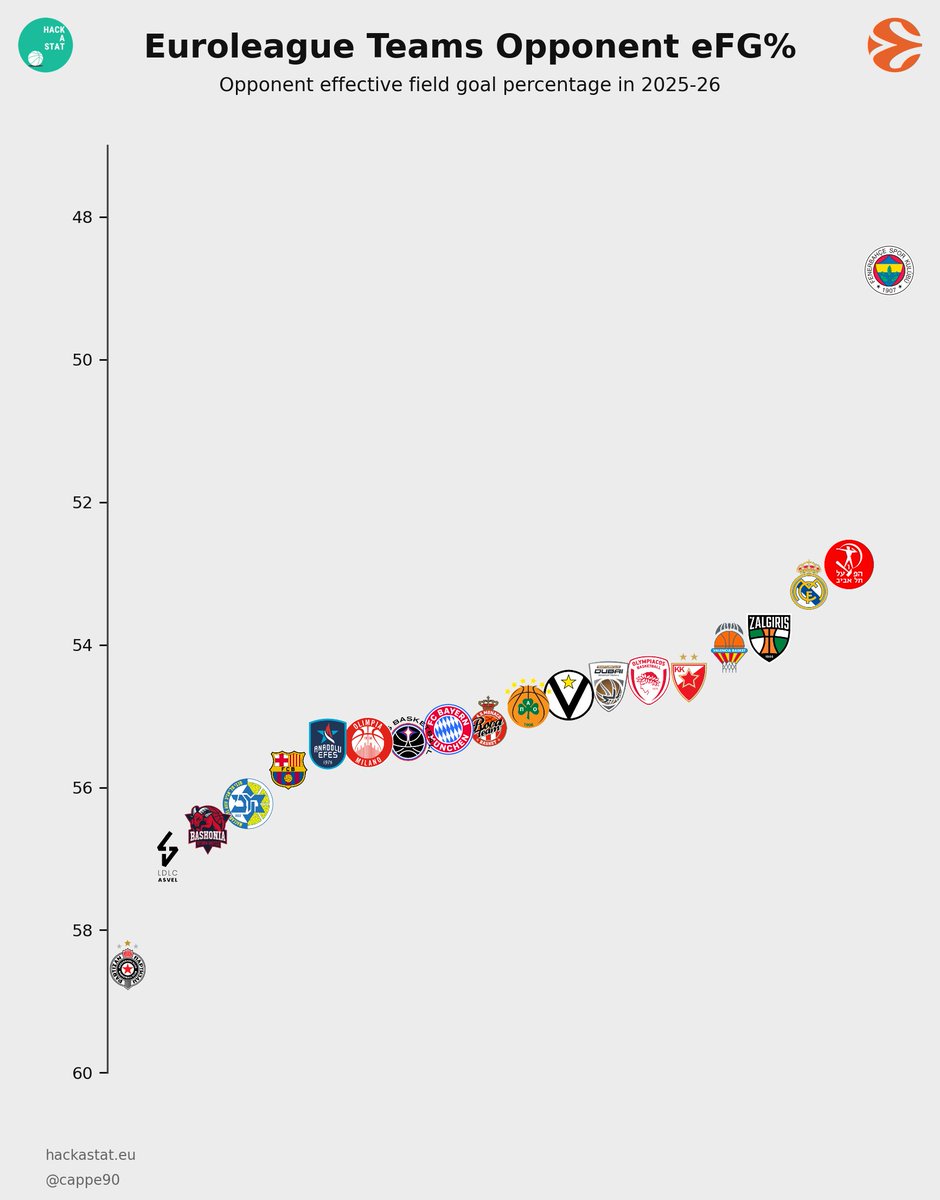
How good is Fener's defense this #Euroleague season? It is this good. The difference between Fener and Hapoel (the second-best team in opp eFG%) is the same between Hapoel and ASVEL (the second-worst in this chart). CRAZY

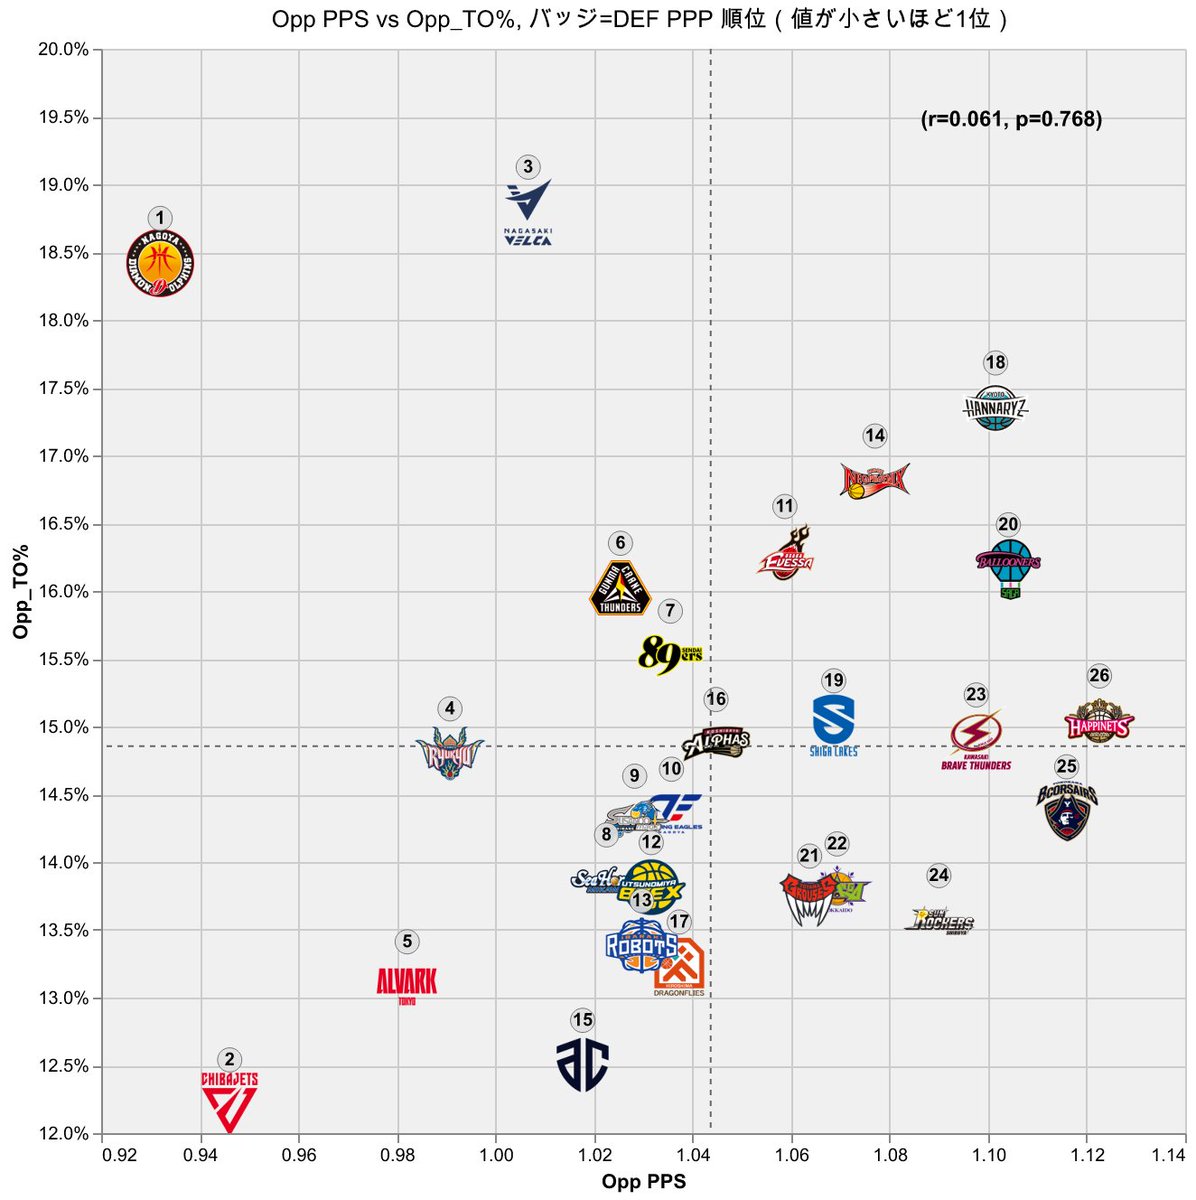
[4Factorを活用した分析的観点:今季Bリーグの守備に見る『トレードオフ』と、それを超越する外れ値] 柳鳥さんのOFFとDEFの比較も面白いですが、今年のBリーグはDEFの指標同士の「相互作用」を検証すると、より面白いインサイトが見えてきます。 特に注目は「相手のTO%(Opp TO%)」と「相手のPPS(Opp PPS)」の関係。 ※PPS=FG1本あたりの失点(計算式:eFG%×2) 1つ目のグラフのように外れ値の2チーム(名古屋/長崎)を除けば、ここには明確な正の相関(r=0.535**)が存在します。 つまり「相手からミスを奪おうと攻めるDEF」ほど、いざ打たれた際の高いシュート効率(PPS)を許してしまい、逆にシュートをタフショットに追い込めているチームほど、無理にターンオーバーは狙いに行かない。 これは、「ギャンブルしてTOを誘うか」と「打たれても確実に失点を抑えるか」が、ディフェンスにおけるトレードオフの関係にあることを示唆しています。 しかし、真に面白いのはこの相関から突き抜けた「外れ値」である名古屋Dと長崎(2枚目のグラフ)。 彼らは「激しくミスを誘いながら、打たれたシュートの被害をも最小限に封じ込める」という、今季のリーグトレンドを根底から覆す異次元のDEFスタッツを叩き出し、DEF PPPでトップに君臨しています。 他チームのアナリストからすると、データ的には本当に理想でありながら実現可能性としては難しいことを実現している2チーム。 @Cappe90, how does this compare with the trends in the EuroLeague? #データ可視化100本ノック #24本目
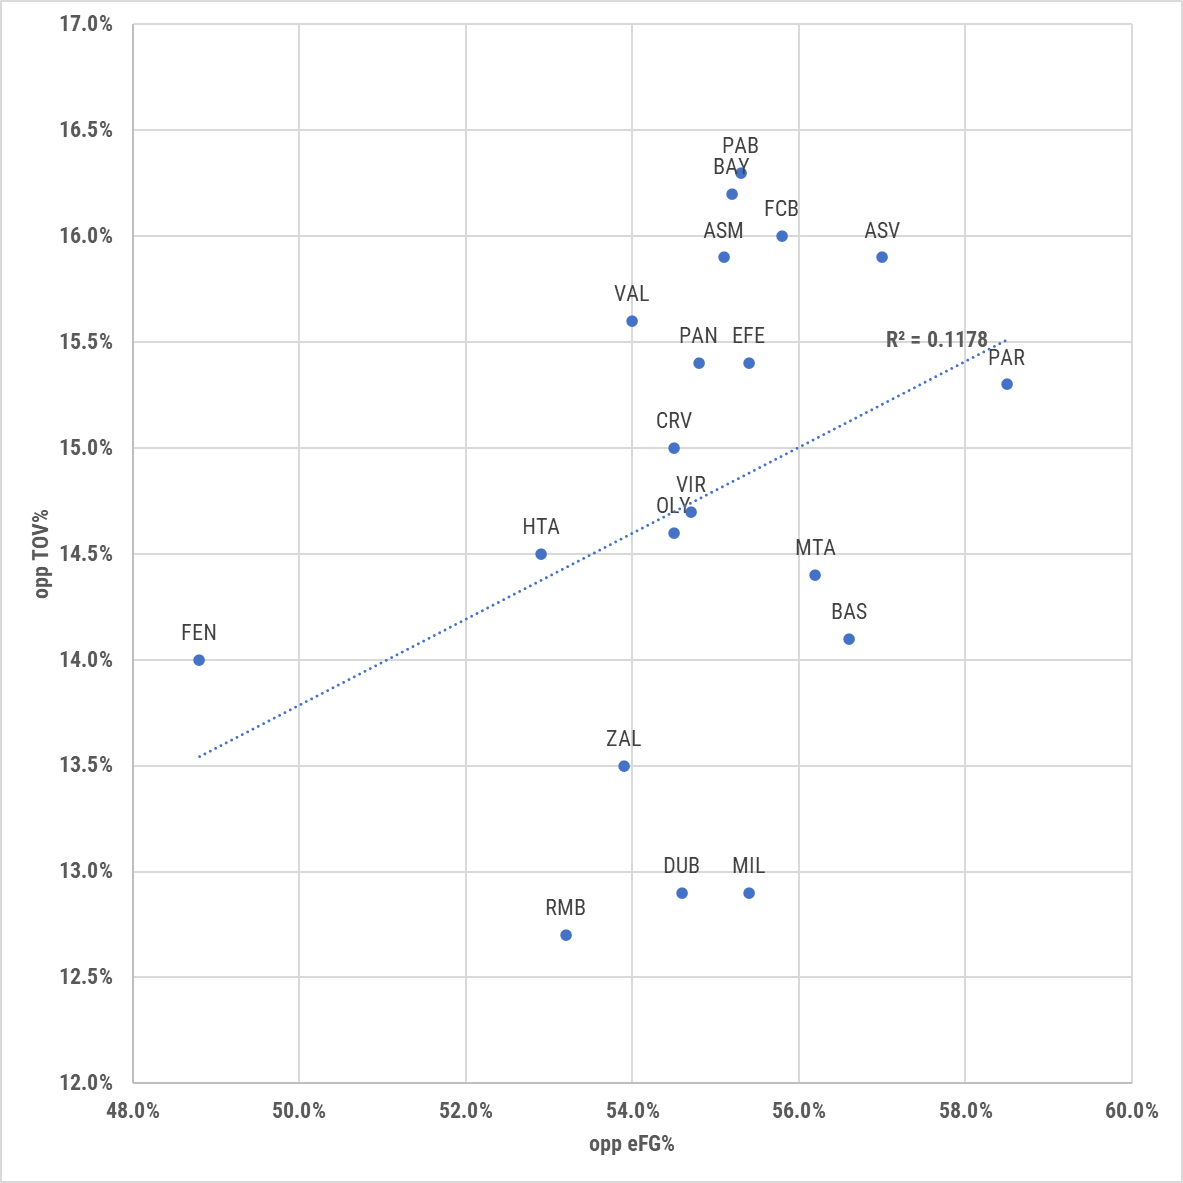


B1全チームのFour Factors各項目を自チームvs相手チームの形で一式散布図にしてみました。横軸が自チーム、縦軸が相手チームです。軸は反転させてません TOV%は斜線より左上、それ以外は右下にいれば、その項目で優位性が生み出せていることになります Four Factors解説は引用元動画をぜひ参照下さい