Oisin OC
745 posts


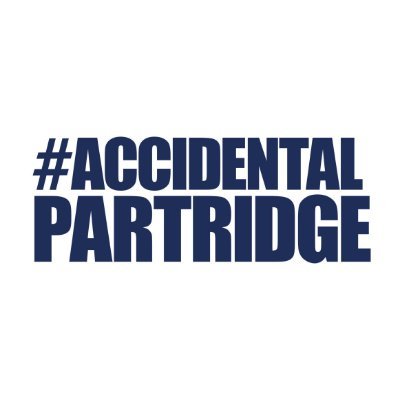
I MADE AN AI AUTOMATION AGENT FOR A DAYCARE THAT MADE THEM $80,000
It literally took me 30 minutes to create it
Want a walkthrough video + Doc on how to do it?
Like & comment "AI” and I’ll DM it to you
(Must follow for dm)
English

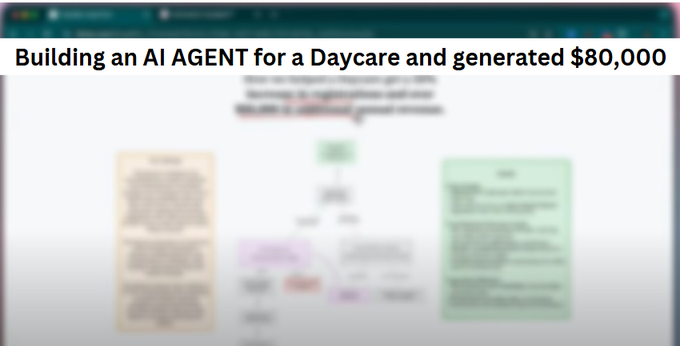
I automated our entire campaign formulation process from in-depth market research -> cold email script writing with just AI.
And today, I’m leaking the exact prompting methods I use to do this.
These prompts automate everything from:
> TAM analysis
> Industry segmentation
> Best-fit Persona discovery
> Uncovering ICP pain points
> Crafting 1-of-1 offers for each individual persona’s pain points & needs
> Writing full scripts around these angles using proven cold email frameworks
And organizing all important datapoints into a cleanly parsed CSV file.
Like & comment “AI” and I’ll send over a document outlining our entire AI prompting protocol for automating this process.
English

My clients pay me thousands to design cash flow dashboards for them
I just created the most POWERFUL cash flow dashboard I've ever built... and because today is Christmas, for the next 48 hours, you can grab it FREE (instead of $97).
Here's why this is so powerful:
🎯 Instantly see your cash position with stunning visualizations
🎯 Track every dollar movement with automated waterfall charts
🎯 Spot trends before they become problems
🎯 Make cash forecasting actually enjoyable (yes, really!)
The magic happens in two key views:
Rolling cash balance tracker
Dynamic cash movement breakdown
No more:
❌ Digging through statements
❌ Manual cash tracking
❌ Confusing stakeholder updates
❌ Surprise cash crunches
Just beautiful, instant insights that update automatically.
Want to transform your cash flow reporting?
1. Like this post
2. Comment with "send" below
3. Get immediate access
(Must follow, otherwise I can't DM)
GIF
English
🚨 Top consulting firms charge $500+ per hour for charts like these...
I just spent 2 weeks building a complete system that makes their work look basic.
~~ Grab it FREE in the next 48 hours before it's gone forever 🔥 ~~
The ultimate Excel visualization system - featuring every chart type possible (30+ professional designs), each one perfected to transform boring data into stunning presentations.
Why is this so special?
✨ Every chart is fully customizable
✨ Built-in smart data connections
✨ One-click color schemes
✨ Automatic updating
✨ Professional design templates
This is a complete visualization system that will:
- Make your reports STAND OUT instantly
- Transform boring data into stunning insights
- Help you communicate complex ideas simply
- Make stakeholders actually excited about your presentations
No more:
❌ Basic, default Excel charts
❌ Confusing data visualization
❌ Overwhelmed audiences
❌ Hours spent formatting
❌ Unprofessional presentations
The best part?
Every chart comes with my advanced formatting tricks that took me YEARS to master.
This template is worth $500+ but for the next 48 hours, you can grab it FREE.
Want this complete visualization system?
Here's how:
1. Like this post
2. Comment "send" below
3. Get Immediate access
(Must be following, otherwise I can't DM)
BONUS: Full video tutorial showing exactly how to customize each chart!
⚠️ WARNING: This offer ends in 48 hours. After that, it goes into our paid template library.
GIF
English
My consulting clients pay 💰 thousands for financial dashboards
But when they saw this, they were ready to pay even more
I just built the world's most ADVANCED Profit & Loss Dashboard using AI...
This is easily worth hundreds (but you won't find it anywhere else)
But for the next 48 hours only, I'm giving it away FREE 🎯
And it's about to change how you analyze financial data forever 🚀
They said it couldn't be done...
I combined AI, Power Query & DAX to create something that shouldn't be possible:
A PivotTable system that handles your ENTIRE financial analysis in ONE CLICK.
You can analyze your entire profit and loss and drill down to multiple levels all the way to your transactions.
Compare values against prior period, prior year, and even your budget - all updating with just ONE click.
Here's what makes it INSANE:
✨ ONE-CLICK updates for ANY time period
✨ Complete drill-down to transaction level
✨ Instant Prior Period & YoY comparisons
✨ Auto-calculating variances
✨ Budget vs Actual analysis
✨ Smart department filtering
The magic? I combined Power Query, Power Pivot, and AI assistance to build a system that:
- Updates your ENTIRE P&L instantly
- Drills down from summary to detail in seconds
- Compares against ANY period automatically
- Makes budget variance analysis a breeze
No more:
❌ Manual period adjustments
❌ Complex formula building
❌ Multiple spreadsheet versions
❌ Messy budget comparisons
Built with:
📊 Advanced DAX measures
📊 Smart data relationships
📊 AI-optimized formulas
📊 Automated refresh logic
Want the step by step tutorial + the template?
1. Like this post
2. Comment "send" below
3. Get immediate access
(Must follow, otherwise I can't DM)
GIF
English
🚀 Just spent 20+ hours building the ULTIMATE financial dashboard...and I'm giving it away FREE
What started as a way to stop management from asking the same questions over and over turned into a complete finance command center that updates with ONE CLICK. 👇
Here's what makes it special:
✅ Shows Revenue & Gross Margin vs target
✅ Compares performance to budget AND prior period
✅ Breaks everything down by department
✅ Tracks every type of cost
✅ Updates instantly when data changes
The secret?
- Beautiful design with cohesive color schemes
- Proper data structure across departments
- Power Query automation
- Smart relationship mapping
- Instant refresh capability
No more struggling with messy P&Ls or confusing spreadsheets.
Just clean, professional insights ready to blow away any stakeholder
Want a copy?
1. Like this post
2. Repost
3. Comment "send" below
And I will send the Ultimate Dashboard to you.
GIF
English

Step 3. Go to dropship(.)io
This website will help you find similar products that people are already selling.
I used this strategy for my 7-figure fashion store, and I call it the “ Copy Master Method”
Comment Master and I'll send it to you
English
Zara can make you an extra 10k this month
Here's how:
English

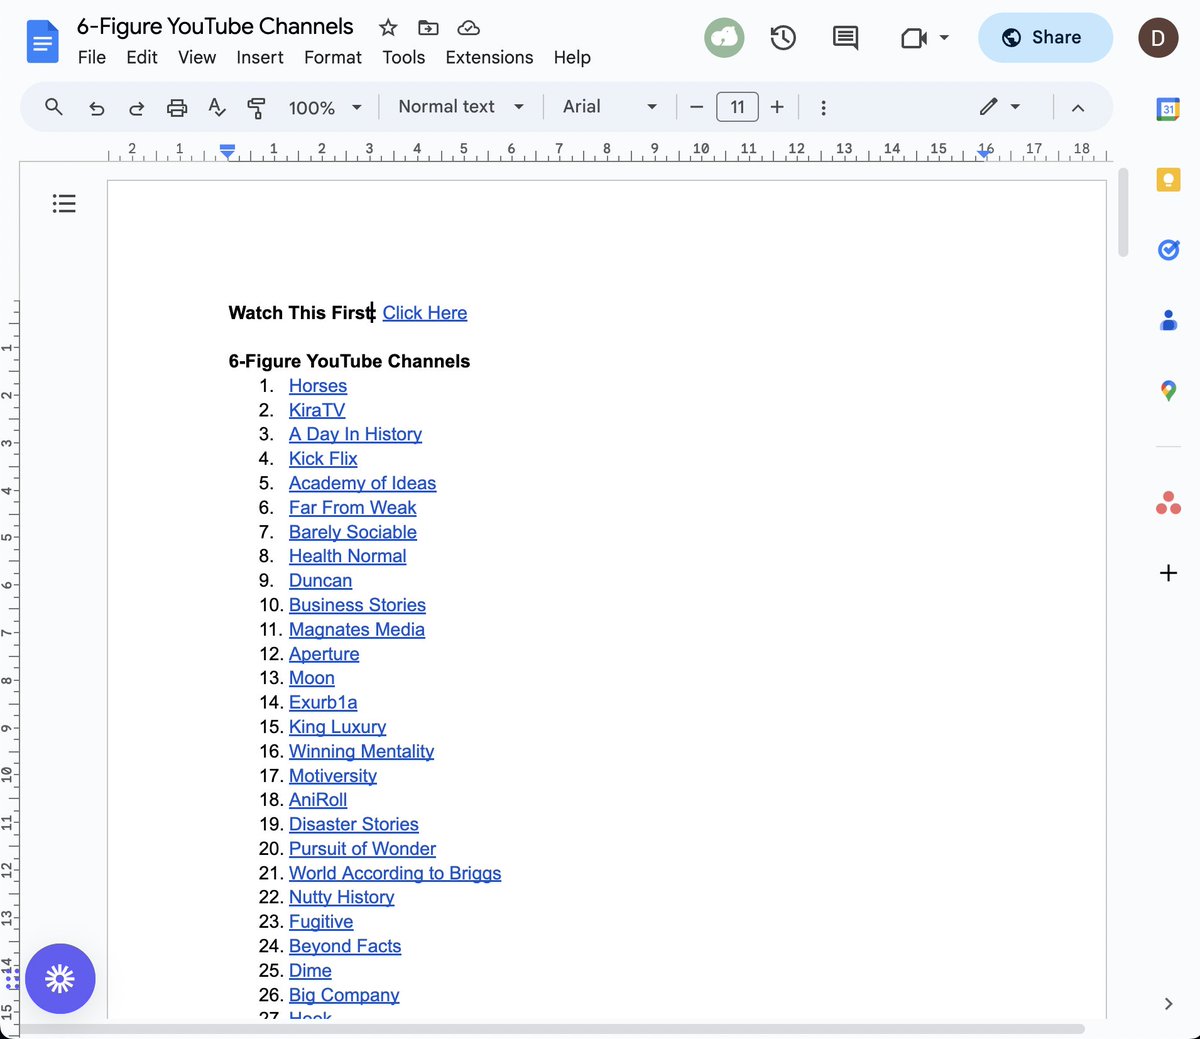
I made a list of 200 Faceless YouTube Channels that are making over $100,000
With this list you can EASILY study what's working and get a jumpstart on your Channel
For the new year I'm dming it away to the first 500 people who comment "channels" below 👇
English

My real estate company has done 300+
off-market deals since 2019.
Our marketing funnel sets us apart.
People have paid me up to $25,000 to help them implement this. Today you get it for free.
Like & Comment "🚀" and I'll DM it over.
*must be following for a DM
English
@alex_zane @SkyCinema I think something like Bond should be there, maybe even Spider-Man too
English

The @SkyCinema Road to the #Oscars continues: let’s talk #BestPicture
What’s your vote? #PowerofTheDog or #CODAfilm OR is it a film the Academy failed to nominate entirely? Should #SpiderMan or #Spencer be in there?
Tell me yours & we’ll discuss live on Sunday #SkyCinemaOscars
English