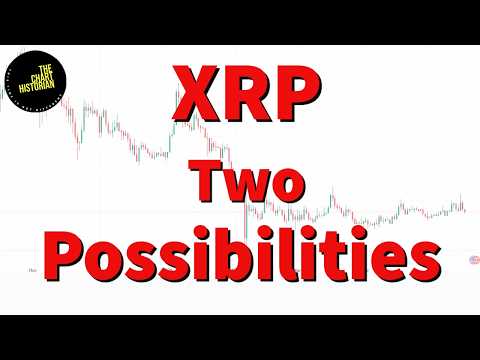
Here are two different possibilities that may be at play on the #XRP chart.
youtu.be/_9o8WrC21s8
YouTube
English
The Chart Historian
1.5K posts

@ChartHistorian
Follow me for a unique perspective on #crypto #TechnicalAnalysis. I specialize in repetitive chart structures and fractals. Not Financial/Investment Advice.


Here's an update on the 1980 #silver peak vs. today's chart.

Here's an update on this 2007-2008 Brent crude fractal that #WTI crude #oil has been following. It still looks to be following even with the recent drop.
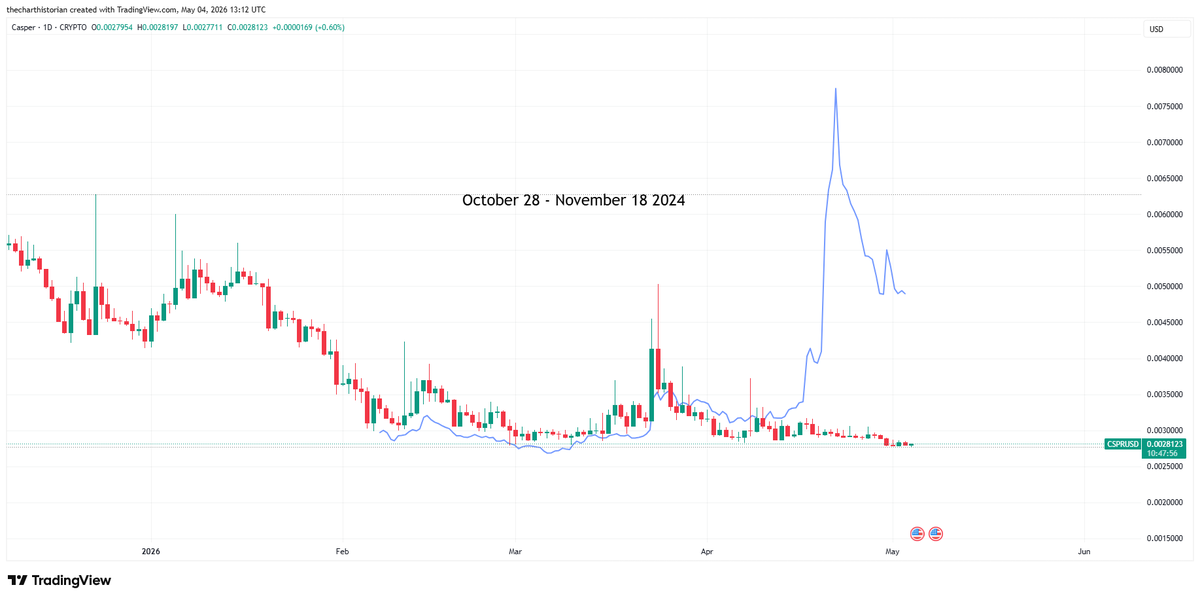
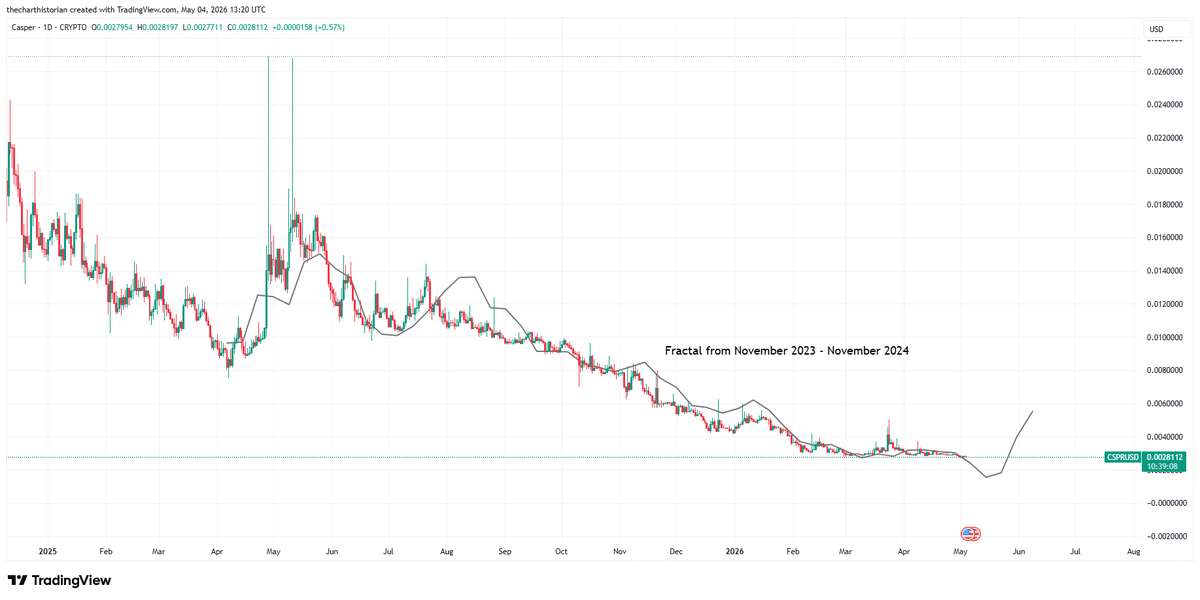
We still can't rule this $CSPR fractal out.


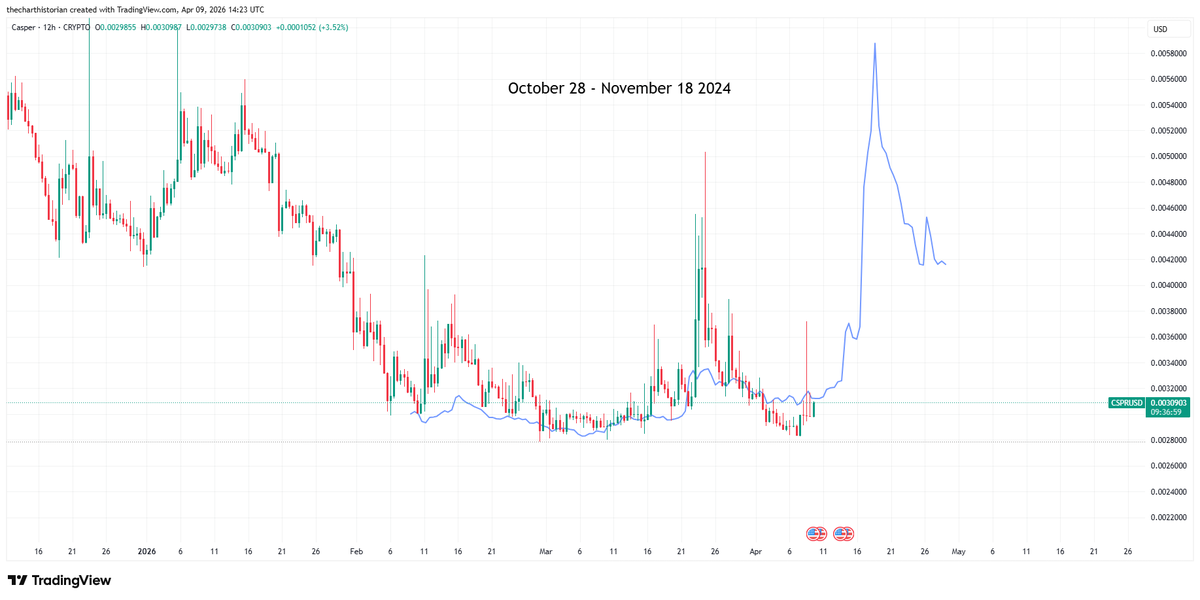
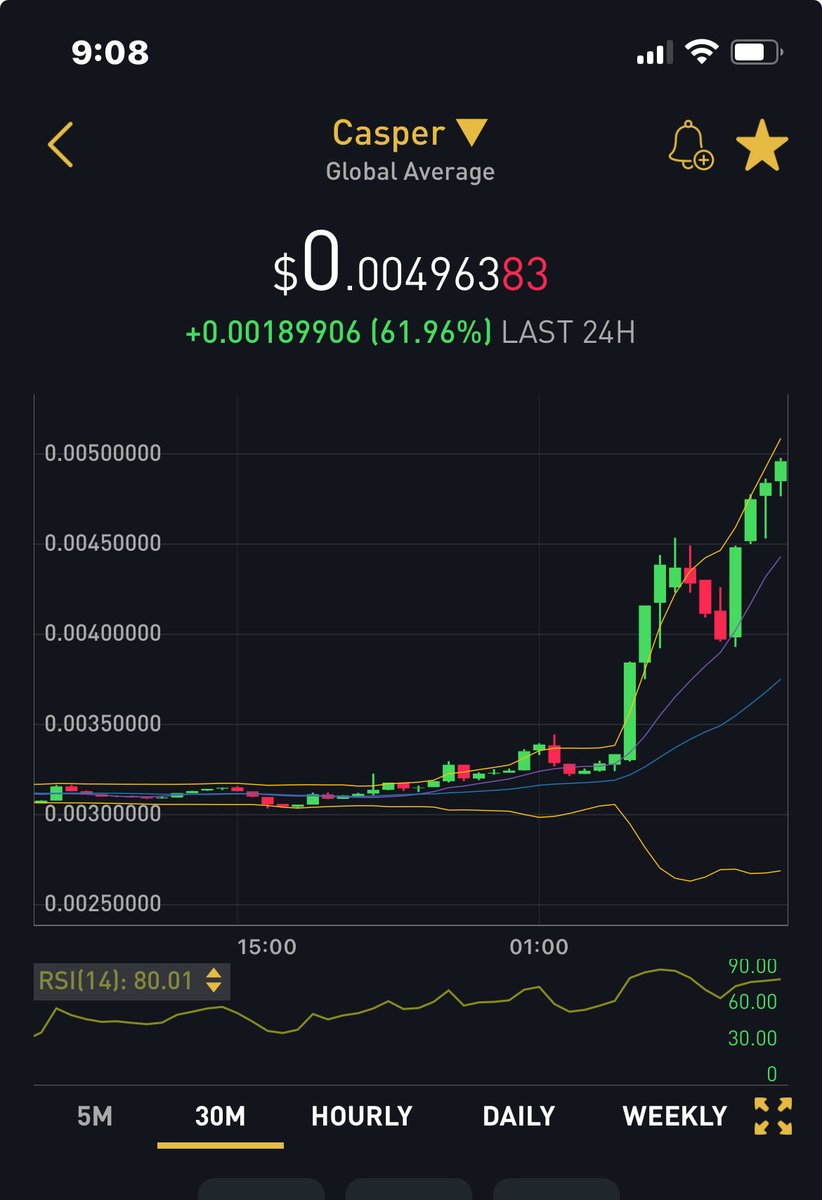
$CSPR update. Did this move up happen early? IF this is the real move up, we need to see follow through.
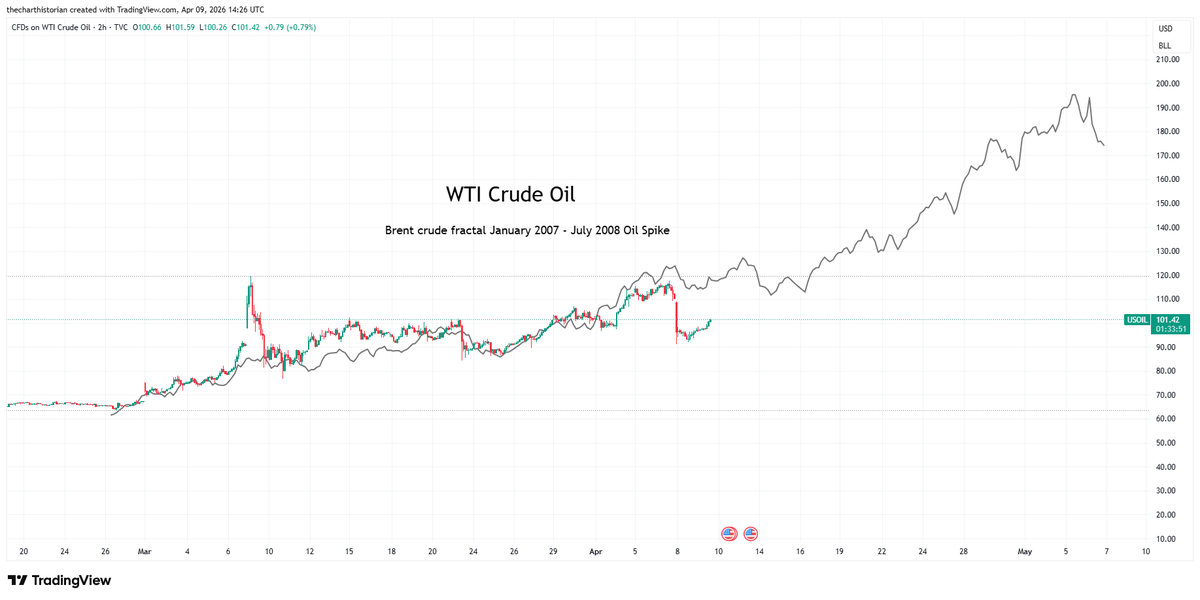
The 2007-2008 Brent crude #oil spike fractal vs. today's #WTI crude oil chart matches quite well. If it continues to follow prepare for higher oil prices.

Brent crude #oil 2007 - 2008 spike vs. today's chart. #oilcrisis2026
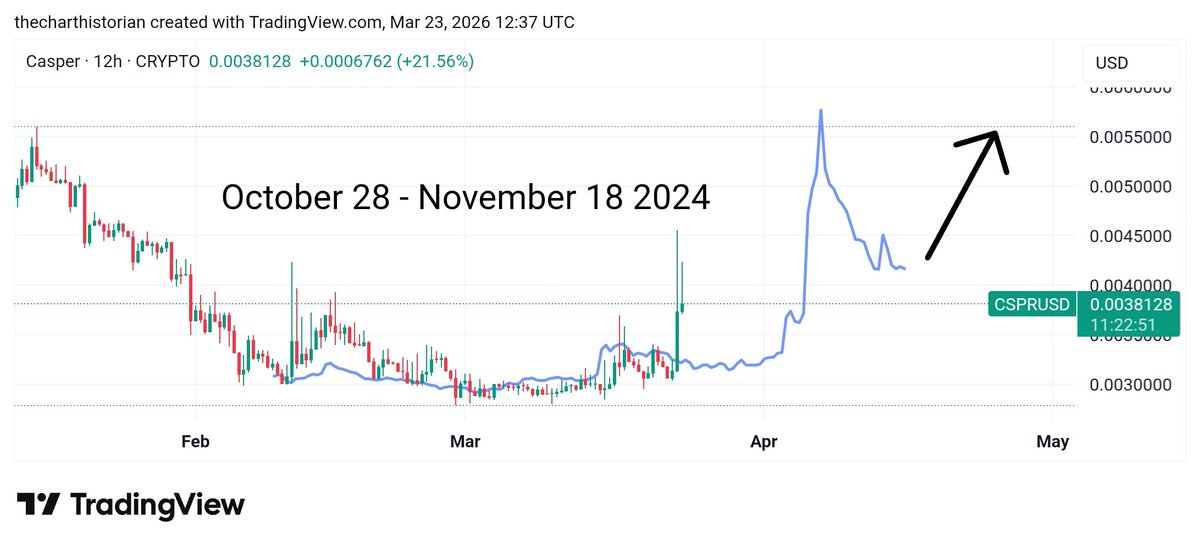
$CSPR A possibility.

Brent crude #oil 2007 - 2008 spike vs. today's chart. #oilcrisis2026