Chief

163 posts

Chief

Chief

@ChiefTrader14

ES / Day Trader - Trying to improve 1% everyday in the markets.

Katılım Haziran 2021
460 Takip Edilen86 Takipçiler
Chief
Chief@ChiefTrader14·
@KTrader20 As soon as your OR gets tested do you keep it for the rest of the session or do you erase it since it has already been tested?
English
1
0
0
7
KTrader
KTrader@KTrader20·
HOD might be from the 30 second OR high. We shall see.
KTrader tweet media
English
2
0
0
51
Chief retweetledi
Stoic
Stoic@Stoiiic·
reminder
Stoic tweet media
Dansk
10
12
167
6.1K
Chief retweetledi
Peter Ming
Peter Ming@mingytrades·
Holding yesterdays value and the prior 3d composite then still looking for the single prints higher. Otherwise will be targeting the lower distribution below Tuesdays profile. Open interest is rather flat so a lower day is expected to start. Macro wise we are hitting into the VAH of current range
Peter Ming tweet mediaPeter Ming tweet mediaPeter Ming tweet media
English
1
3
70
3.2K
Chief retweetledi
Smashelito
Smashelito@smashelito·
Look above ONH and fail, a classic fade setup that always catches my eye, especially on a true gap up that tests ONH immediately. Order flow made this one a no-brainer today. #ES_F
Smashelito tweet media
English
16
19
286
18.2K
Chief retweetledi
Jester
Jester@jestertrading33·
HTF analysis on ES using weekly volume profiles. Showing some of the things I like to look at on HTFs such as weekly open, volume building (or rejecting) above/below prior week high/low, LVNs etc.
Jester tweet media
English
1
2
66
2.4K
Chief
Chief@ChiefTrader14·
@OflowTrading Would be awesome if you could do some educational DOM series so more traders could give it a chance since at first it’s really tricky and scary to watch.
English
1
0
1
68
Oflow Trading
Oflow Trading@OflowTrading·
First time watching a DOM it looks like chaos. After a few sessions you start seeing things no chart can show you. Once it clicks, you never go back. OflowDOM. Native to NinjaTrader 8. oflowtrading.com
English
3
2
49
4.3K
Chief retweetledi
Jinzo
Jinzo@FPX500·
Trade of the day: Another clean buyer absorbtion near RTH High this morning. Agressive buyers hitting the tape between 6639 and 6645 on ES (blue circles). We're below OVN high, and near prior week POC and prior day close. Below 6636 --> short scalp opportunity.
Jinzo tweet media
English
10
2
62
4K
Chief
Chief@ChiefTrader14·
@fvbioaraujo Do you wait for the footprint to close, or enter looking at the agressive orders and volume on the DOM?
English
0
0
1
33
Chief retweetledi
Fabio Araujo
Fabio Araujo@fvbioaraujo·
#es_f Two examples of trapped participants, both buyers and sellers, where I was able to identify their activity and exploit their pain points by going in the opposite direction and profiting from it. Both positions combined, I risked about 5 points each, totalling 10 points, for 31 points reward, 1:3 RR
Fabio Araujo tweet mediaFabio Araujo tweet mediaFabio Araujo tweet media
English
1
1
3
79
Chief retweetledi
Imre Gams
Imre Gams@ImreSG·
Market profiling is a delicate art and science. There is value in looking at profiles through the lens of time. This removes level-based discretion. And we know there are certain profiles that command a lot of attention (previous day's RTH, rolling 5-day, 30-day etc). My preference is to combine static profiling with dynamic profiles intraday. This is the art part of the process. Yes, I do incorporate some quantitative processes in my dynamic profiling, but a large part of still comes down to my experience and my personal discretion of the terrain I believe we are negotiating in real-time.
English
6
5
56
2.7K
Chief retweetledi
Luckshury
Luckshury@Luckshuryy·
how to spot bottoms:
Luckshury tweet media
English
9
29
359
15.7K
Chief retweetledi
Oflow Trading
Oflow Trading@OflowTrading·
Volume Profile trading. Don't trade the middle where all the volume is. Trade the edges where it's thin. Wait for the slowdown and the absorption. Patience over action. oflowtrading.com
English
3
14
146
8.8K
Chief retweetledi
josh
josh@XennialTrader·
Weakness has been evident in the market even on days that have traded higher prices. We've had good excess highs on most days for the last 2 weeks and less-than-great excess lows on many days. POCs have generally been in the lower half of the range. If you can spot this forming early on (this morning is a great example), it can be helpful to avoid buying into an excess high and vice versa. If you are a more short term trader (as I am), this same principle applies on shorter profiles as well. $SPY $QQQ #ES_F #NQ_F
josh tweet media
josh@XennialTrader

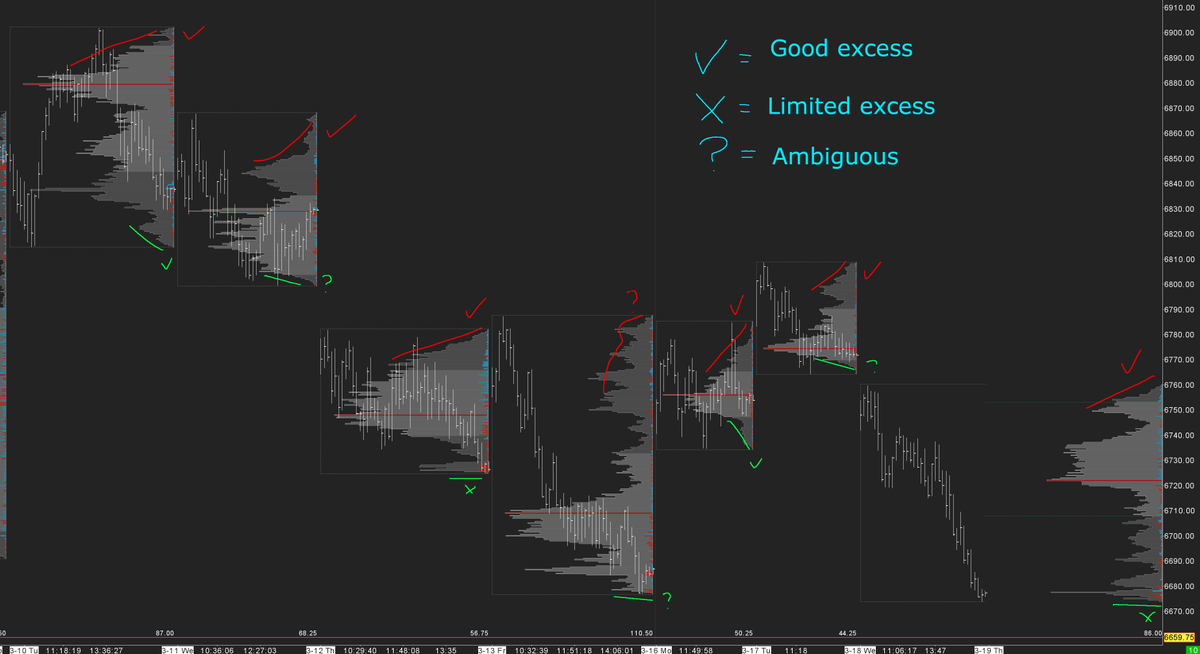
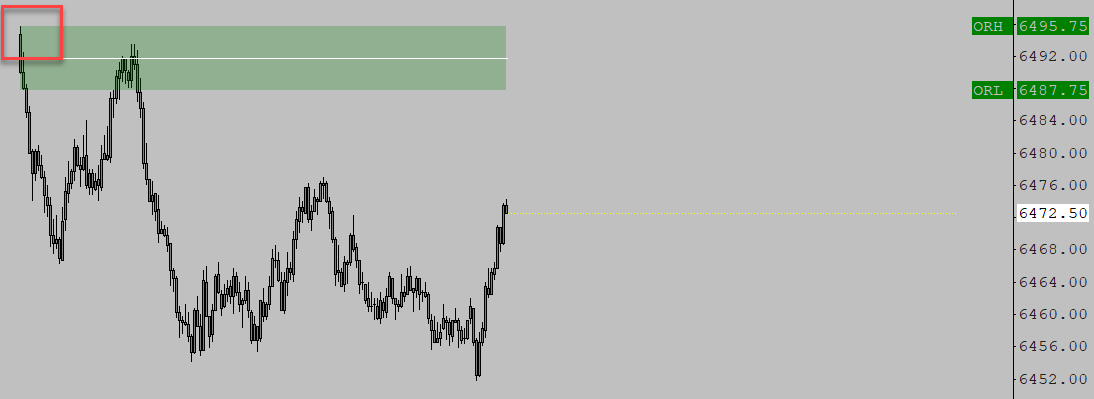
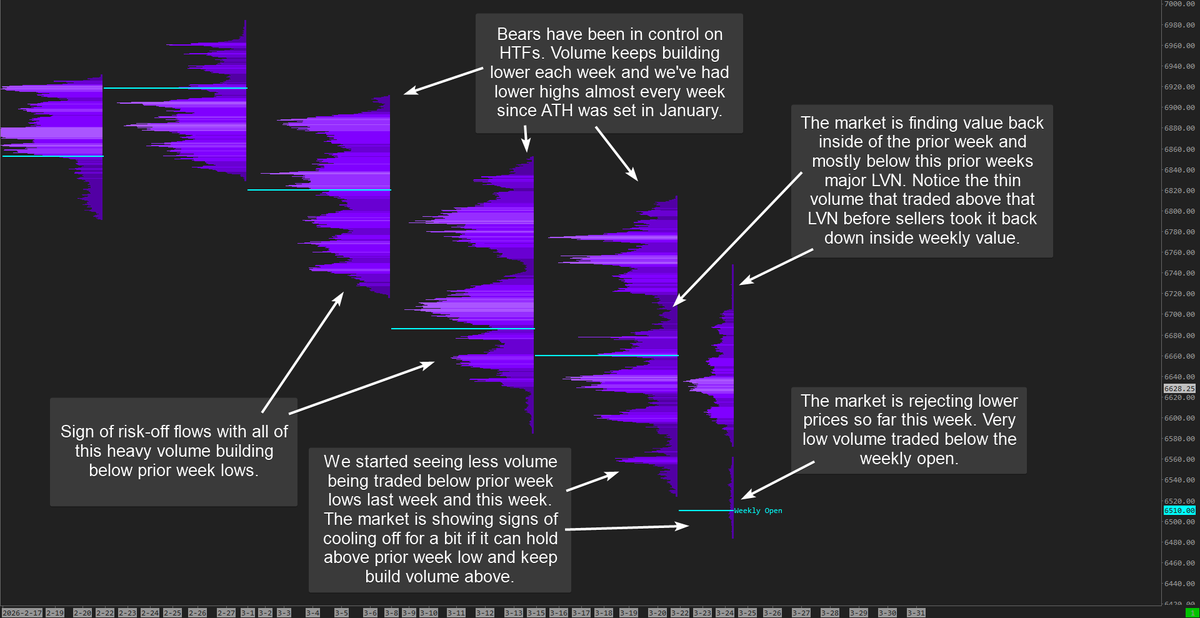
Excess Back when "Mind Over Markets" was written 30+ years ago, the S&P traded at 400 and the SP contract traded in 0.10ths, not 0.25s. One tick (0.1) is 0.025% of 400. In 2026 terms, 0.025% of 7000 is 1.75. So, one SP tick in the early 90s is ~7 ES ticks today. Sounds about right to me. Use TPOs if you want. But back in those days they didn't have real time volume (they had the LDB volume available at 15 minute intervals). Time is often a great proxy for volume, but why not just use volume? So, check out the good/poor highs/lows by example shown on volume profiles. The first example shows a very truncated low. It was taken out 3 days later. The second example shows a very truncated high. It was traded above the very next day. The slanted lines on the other profiles show good highs and lows. Today's very homely profile is in the second picture. Good high, bad low. What does it mean? Many traders fixate on this and have bad days as a result. Today's low need not be traded through tomorrow, this week, this month, or this year. People are the same way about gap fills. They fixate on them as if it's some kind of natural law that they must be filled (May 12 2025 would like a word). It simply means that the auction did not complete with excess. To me, it means that it's tough to have confidence in that low, because we did not auction "too far" to determine if the prices below today's low were "too cheap." What about poor lows/highs which are not "repaired" in a timely fashion (the same day, week, month, etc.)? @daltontrading has an insightful quote on this. From the updated MoM book, page 312: "We describe a lack of a buying or selling tail as a poor low, or a poor high. ... we have since [the original printing of MoM 20+ years prior] developed a more nuanced appreciation for what causes poor lows and highs. The lack of a tail may indicate that the market has gotten too long when there is no selling tail, and too short when there is no buying tail. "This understanding ... evolved over time. It is the context that leads to the high or low that signals a deeper layer of meaning. ... The biggest disappointment is that there are no absolute answers." #ES_F #NQ_F $QQQ $SPY $DIA $SPX

English
2
10
120
14.5K
Chief retweetledi
Ziggy
Ziggy@ZigsOnTheBid·
Sometimes it's easy to forget how lucky we are when we open our fridge and there's food, and turn on the tap for fresh water, or wake up in a warm house. Thankful for those things.
English
2
6
60
1.6K
Chief retweetledi
Imran Lakha | Options Insight
Imran Lakha | Options Insight@options_insight·
I don't size up because I feel strongly about a trade. I size up when multiple independent signals converge. Technical setup looks good. Vol behavior confirms it. Skew is supportive. Dealer positioning aligns. When all of those point the same direction, conviction goes up. That's when I take more risk. When only one or two signals fire, I may still sometimes take the trade. Smaller. Lower conviction. The biggest losses in trading come from oversizing on a single signal. "The chart looked great" has never protected anyone when vol explodes and skew flips against you overnight. Your conviction should be a function of how many independent data points agree. If you can't name at least three reasons the trade makes sense, your size should reflect that uncertainty. Defined risk backed by data > opinions.
English
3
6
63
4.1K
Chief retweetledi
Imre Gams
Imre Gams@ImreSG·
ES: Very quick momentum scalp before the cash open. This is one of my favourite momentum setups!! Tight bracketing followed by another even tighter range above the prior range's value area. But don't ignore the bigger picture! We were building this pressure at the edge of a larger volume node. This what I call the transitionary phase of the auction.
Imre Gams tweet mediaImre Gams tweet mediaImre Gams tweet mediaImre Gams tweet media
English
0
3
44
1.8K
Chief retweetledi
Boltz
Boltz@EsBoltoise·
2/12 $ES older replay and I have an hour long video explaining sell off days. engrave this kind of tape in your head if you struggle on uptrend/downtrend days. focus on what actually happens VS numerical order flow data. either aggro/passive
English
7
16
152
11.1K
Chief retweetledi
ordaflo tradooor
ordaflo tradooor@TheMensAdvocate·
Metacognition is. Aka self-reflection, self-analyzing, self-everything. Everything is within you. You analyze your analysis, your thoughts. Why did you do this? Why did you react to this? Pattern recognition is inside this umbrella. This is why journaling is GOAT for trading. This leads to ADAPTATION, which is what Albert Einstein told us when someone asked: What intelligence mean to him? The ability to adapt is the sole reason for survivability. In order to do so, cells must change it's own machinery, mechanism of action to adapt. And so do humans as a whole, we change our ways of reaction, actions => Market evolves. Inefficiencies get more efficient. Opportunities close up. So there you go, that's your alpha for Friday the 13th. See you on the next one.
ordaflo tradooor tweet media
Riċ@ricblurs

pattern recognition is the highest form of intelligence

English
0
3
21
1.5K
Chief retweetledi
Stoic
Stoic@Stoiiic·
Price is the advertisement. Time is the judge. Volume is the vote. Develop an understanding of these three can provide a contextual view of the market. 1. Price is an advertising mechanism. price = invitation, not an agreement. with this framework in mind, price goes up to advertise to sellers and goes down to advertise to buyers - an exploration process to confirm value. 2. Time regulates all advertised opportunities. Opportunity decay- over time setup loses edge + anomalies are relevant over a certain period of time after which they become less important. 3. Volume determines the success or failure of these advertised opportunities. As discussed earlier price is an advertisement, volume is the type and nature of participation at this advertisement. Increased participation with aggressive conviction on a breakout/breakdown = acceptance. Lack thereof = failed auction.
English
5
10
132
5.8K