@CobbEMCEdu @cobbemc We appreciate your support and look forward to another great competition in 2027! 👏
English
CCSD Math Leadership
473 posts
@CobbMathDept
The Cobb County Math Department supports 113 schools and over 4,000 mathematics teachers in grades K-12.

Congratulations to all who competed in the 2026 Cobb Math Tournament! 🎉 Your problem-solving and perseverance were on full display! Check out our 1st place ES & MS individual winners and teams!


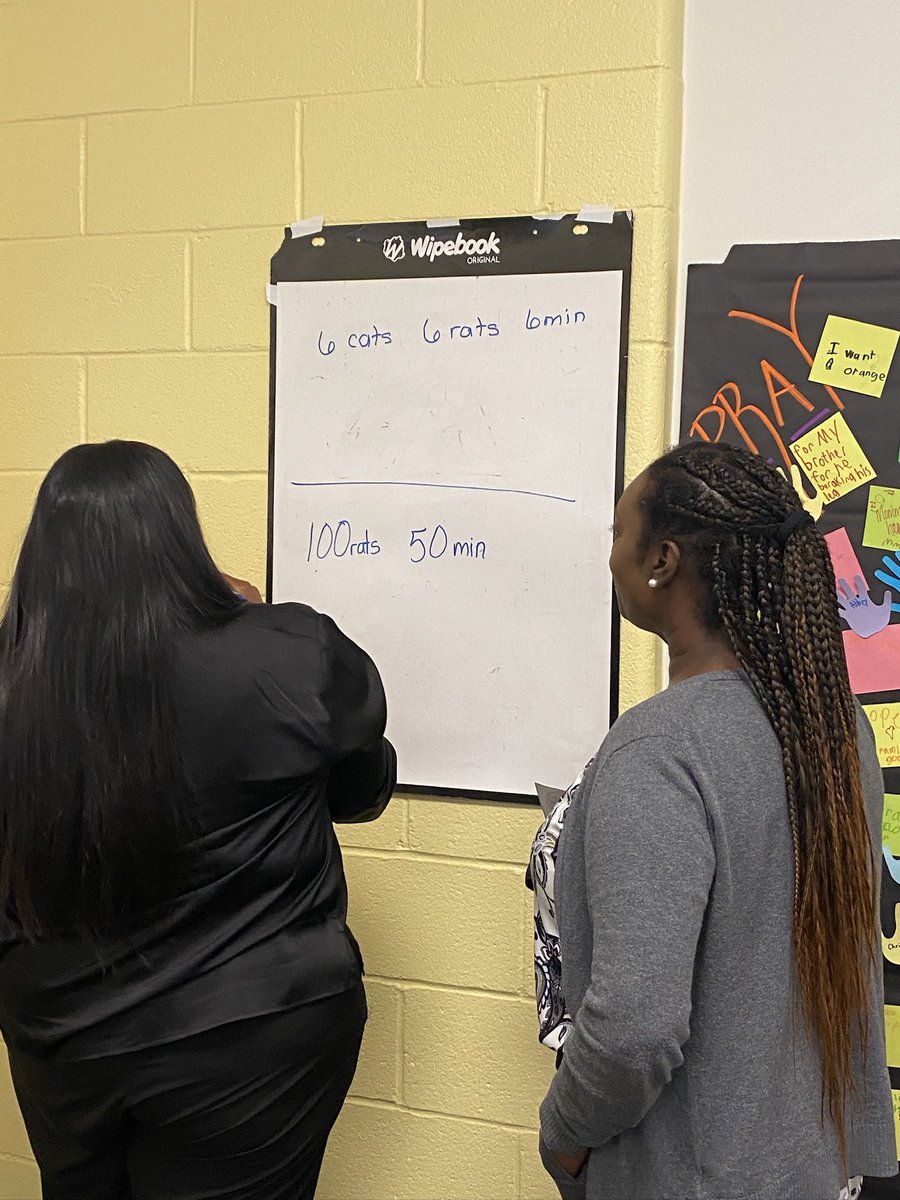
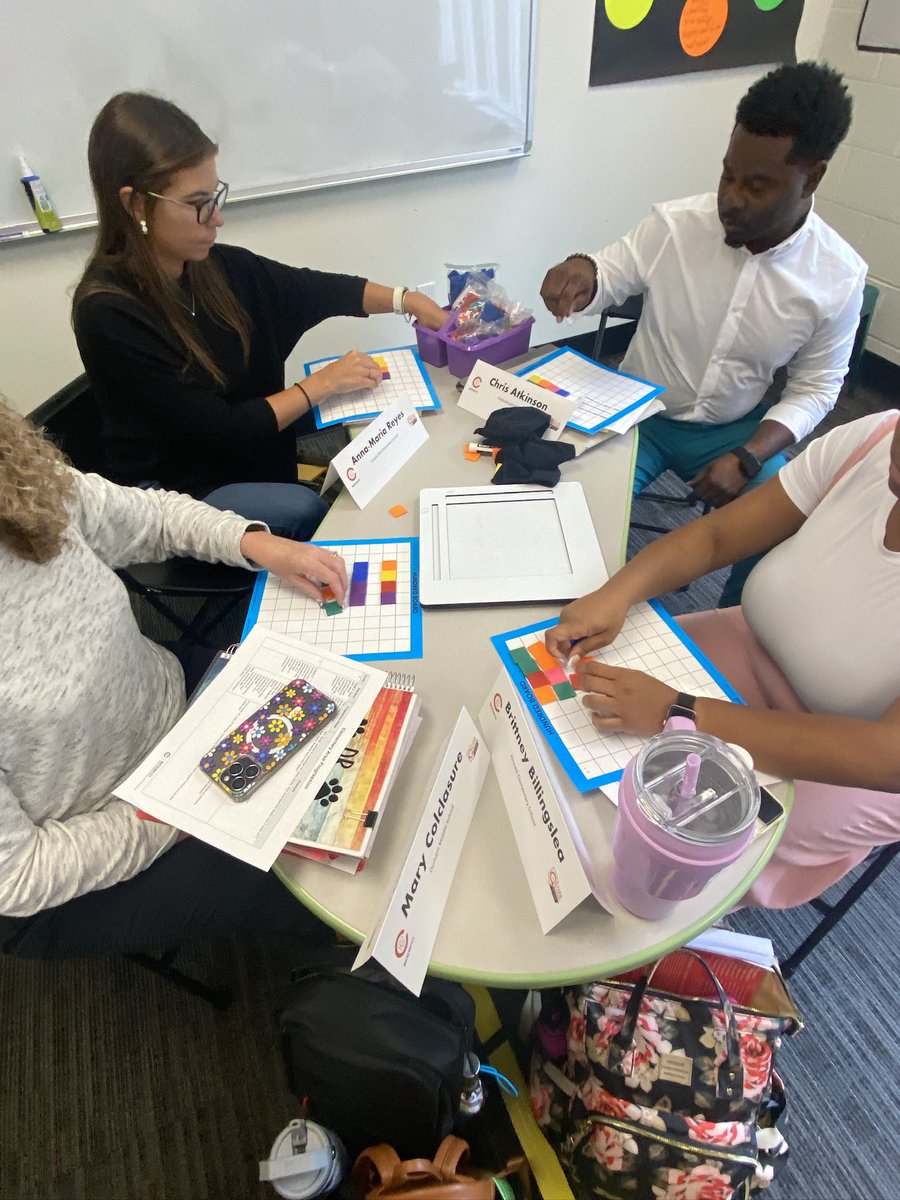


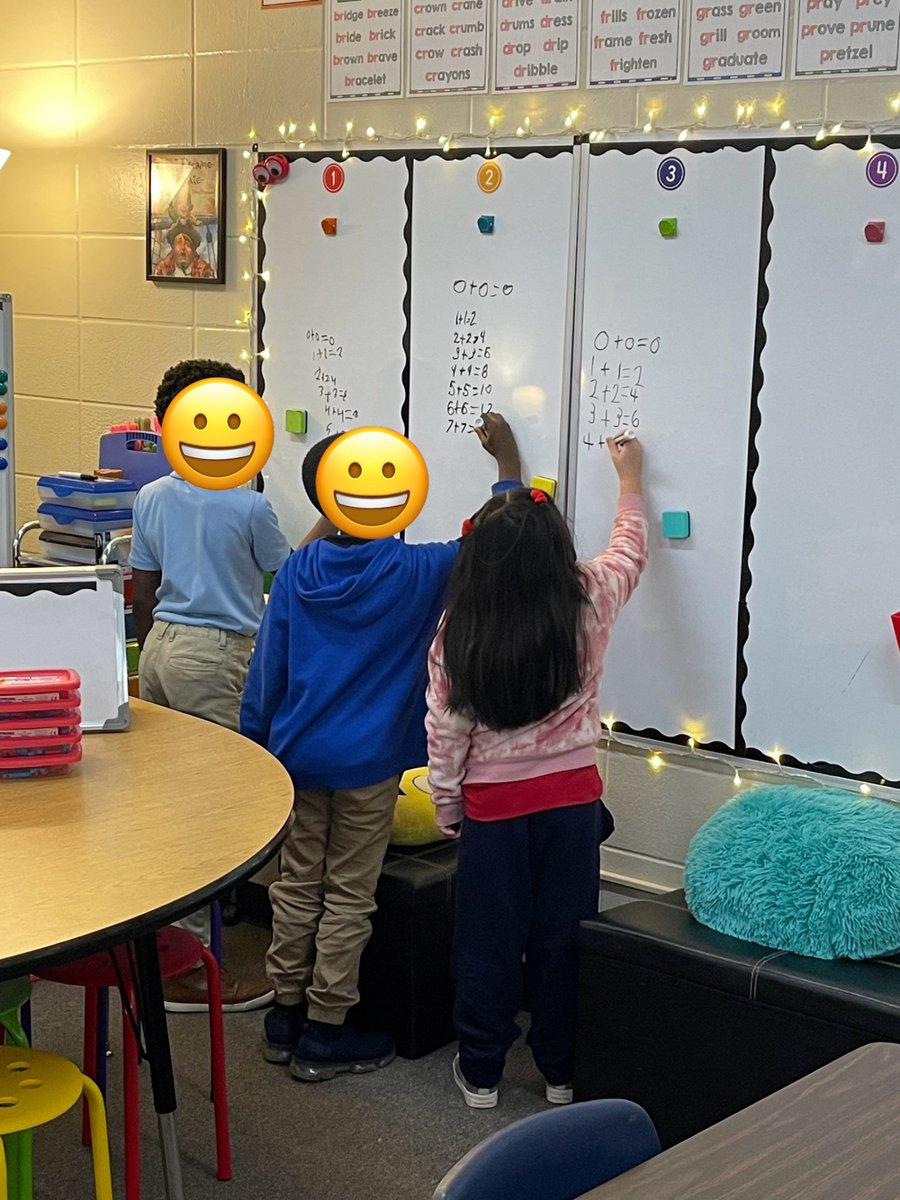

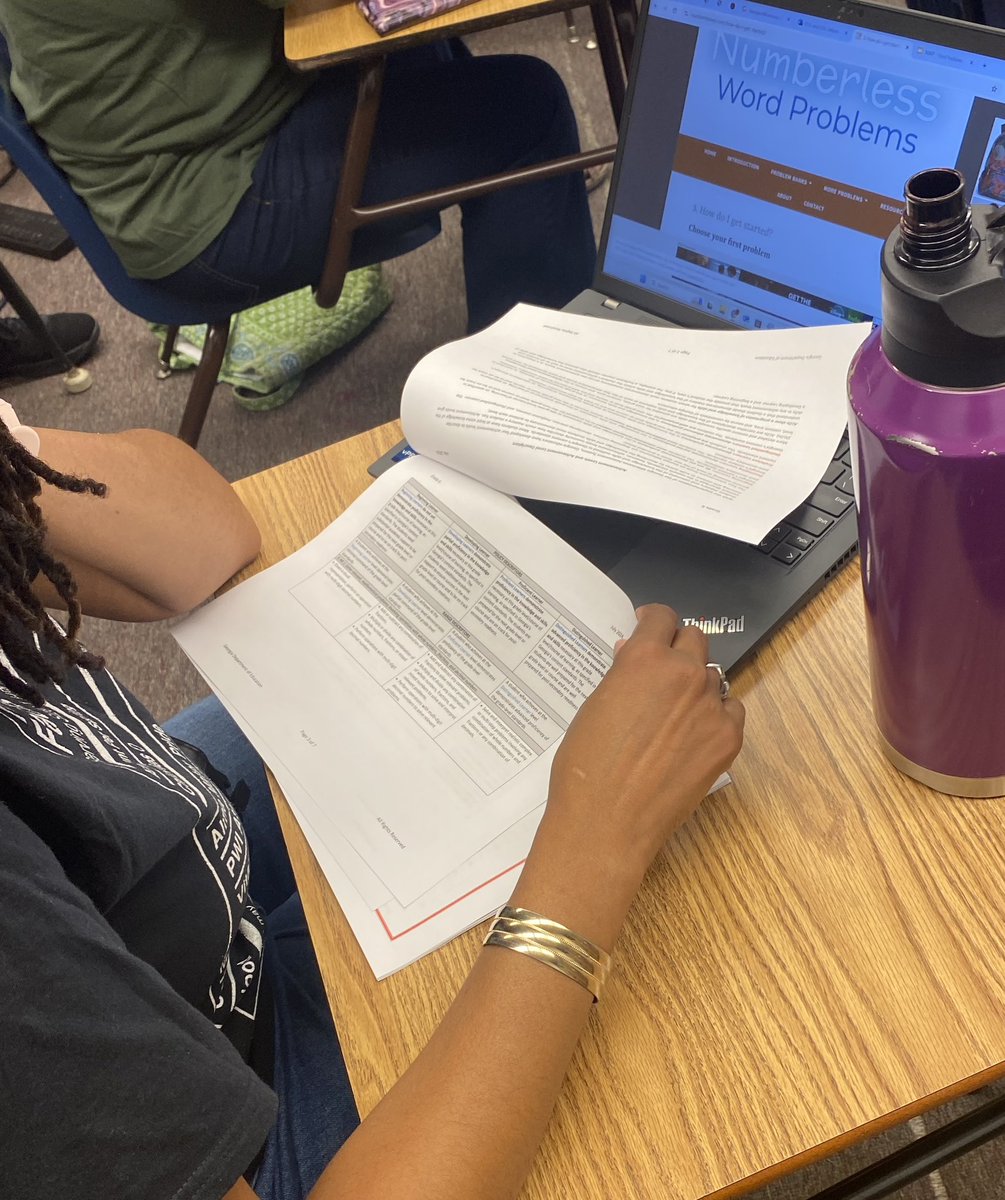
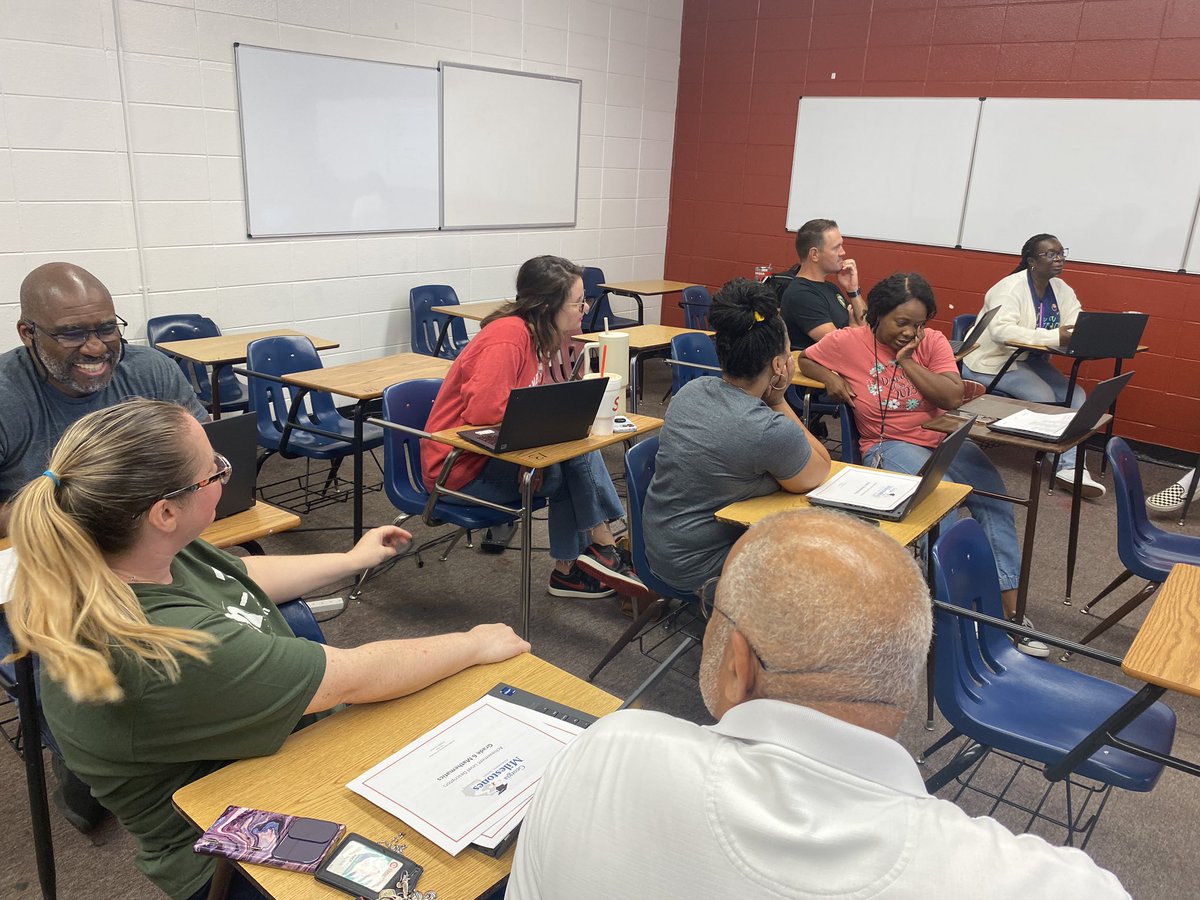
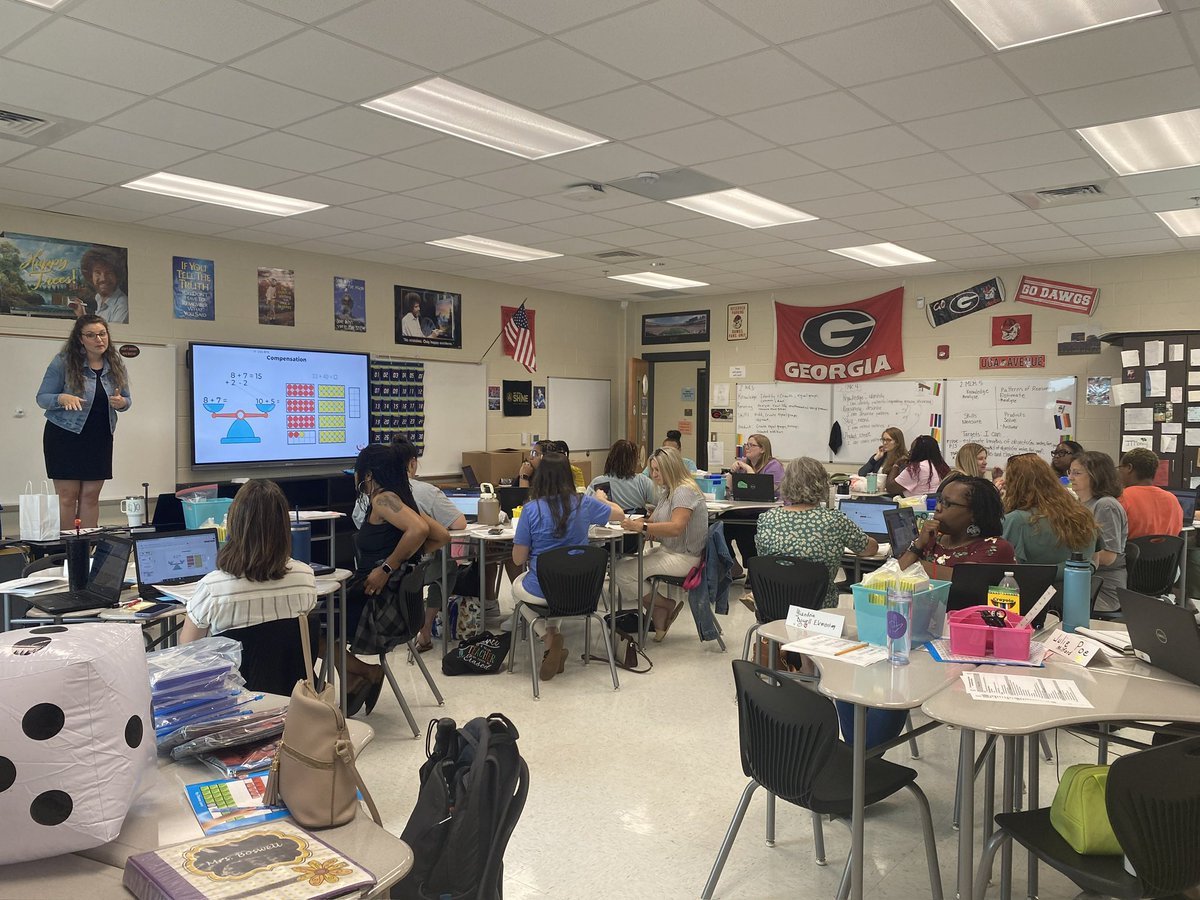
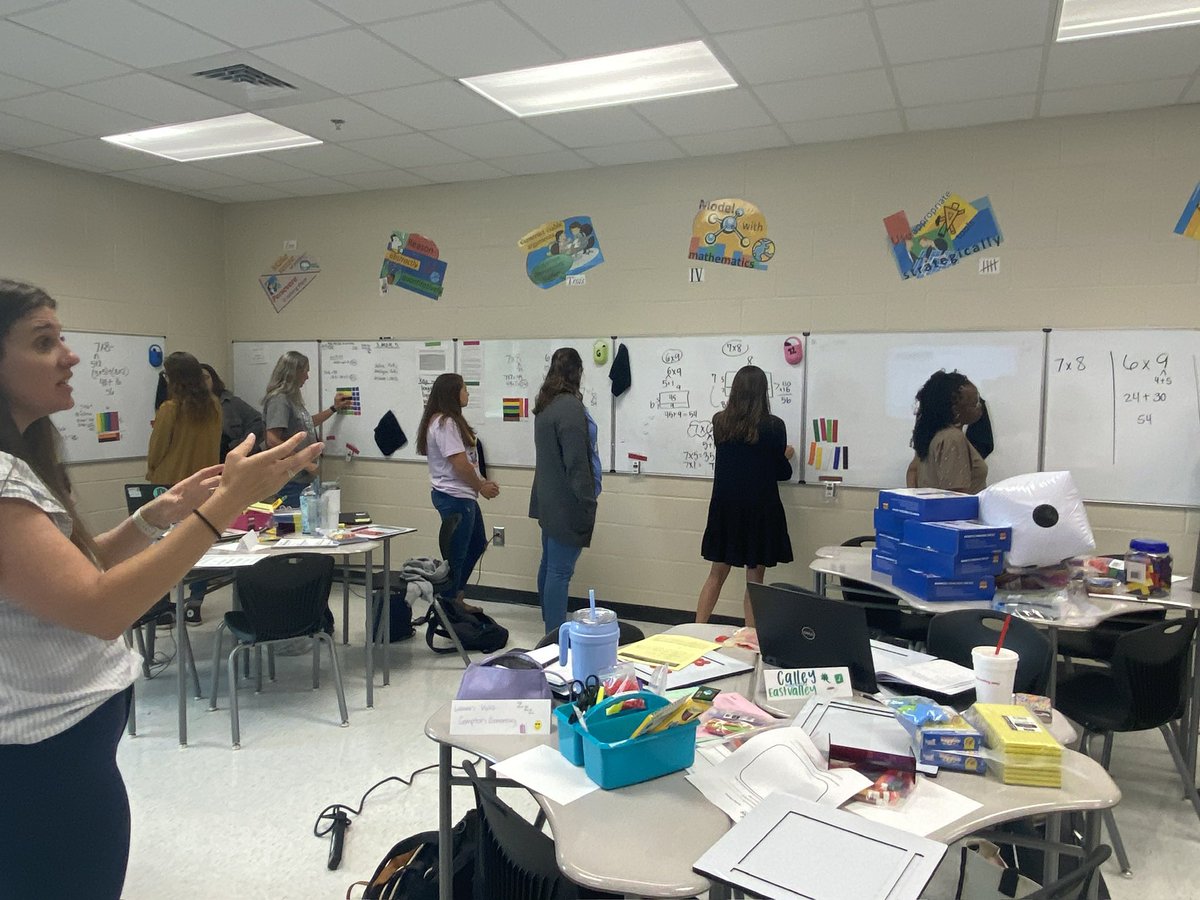
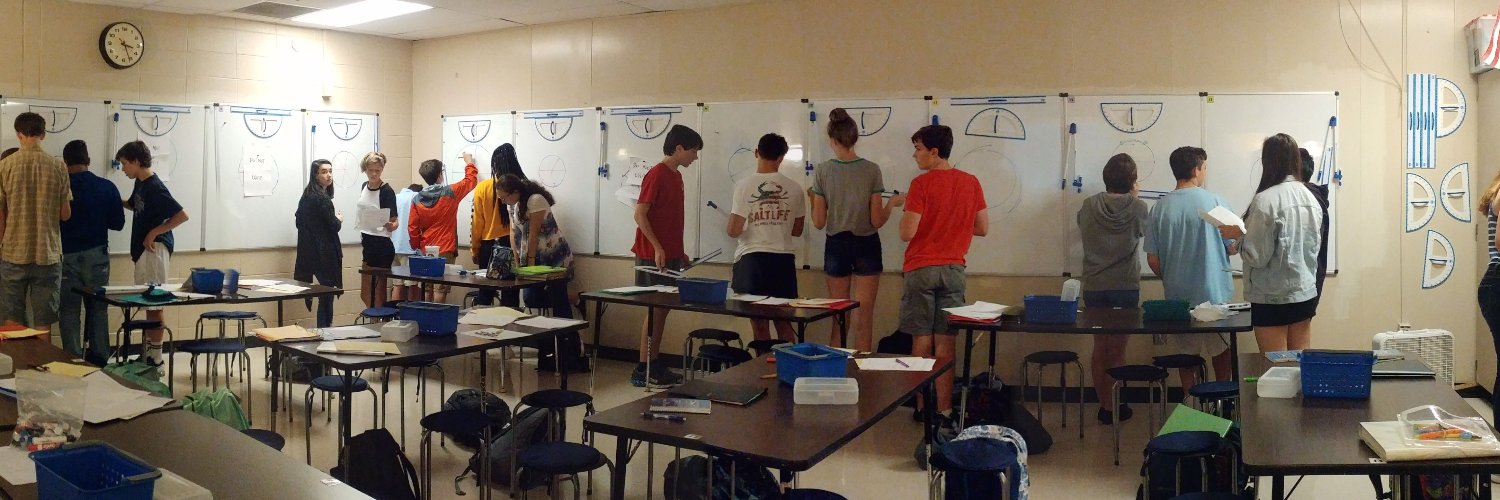
I had the opportunity to attend the Math 360 training at Due West Elementary. I enjoyed visiting classrooms and learning new strategies to implement in my instruction. #lifelonglearner @CobbMathDept