Connected Data

6.1K posts

Connected Data banner
Connected Data

Connected Data

@Connected_Data

Connecting Data, People & Ideas since 2016. Using relationships, meaning, context in Data to achieve great things #KnowledgeGraph #GraphDB #AI #SemTech

The World Katılım Nisan 2016
2.5K Takip Edilen6.6K Takipçiler
Sabitlenmiş Tweet
Connected Data
Connected Data@Connected_Data·
🚀 The wait is over! The Call for Submissions for #CDL26 is NOW OPEN. Be a part of the celebration: 10 Years Connecting Data, People and Ideas The leading global technology conference for those using Relationships, Meaning, and Context in Data to achieve great things.  Join us in the heart of London as we celebrate a decade of innovation in Knowledge Graphs, Graph Analytics, Data Science, AI, Graph Databases, Semantic Tech and Ontology this November. Share your use cases and breakthroughs. Submissions are open across 2 areas: Presentations: Real world use cases and innovative approaches across 3 tracks: Nodes, focus on use cases, Edges, focus on innovation, Educational, focus on applications. Masterclasses:  Hands-on tutorials in which instructors teach attendees skills they can use in their daily work. Why Speak at CDL26? Global Platform: Join 350+ luminaries who have graced our stage and reach our ever-growing global audience of thousands. Adoption and Innovation: From the resurgence of Ontologies to the cutting edge of Agentic AI and Context Graphs. Speaker Benefits: Free event pass, speaker guidance, and exclusive network discounts. 📅 Deadline: Aug 31 ✅  Notification of Acceptance - September 14, 2026  Topics of interest and submission guidelines here: 🔗 connected-data.london/2026-call-for-… #ConnectedData #KnowledgeGraphs #DataScience #AI #GraphDB #Analytics #SemTech #EmergingTech
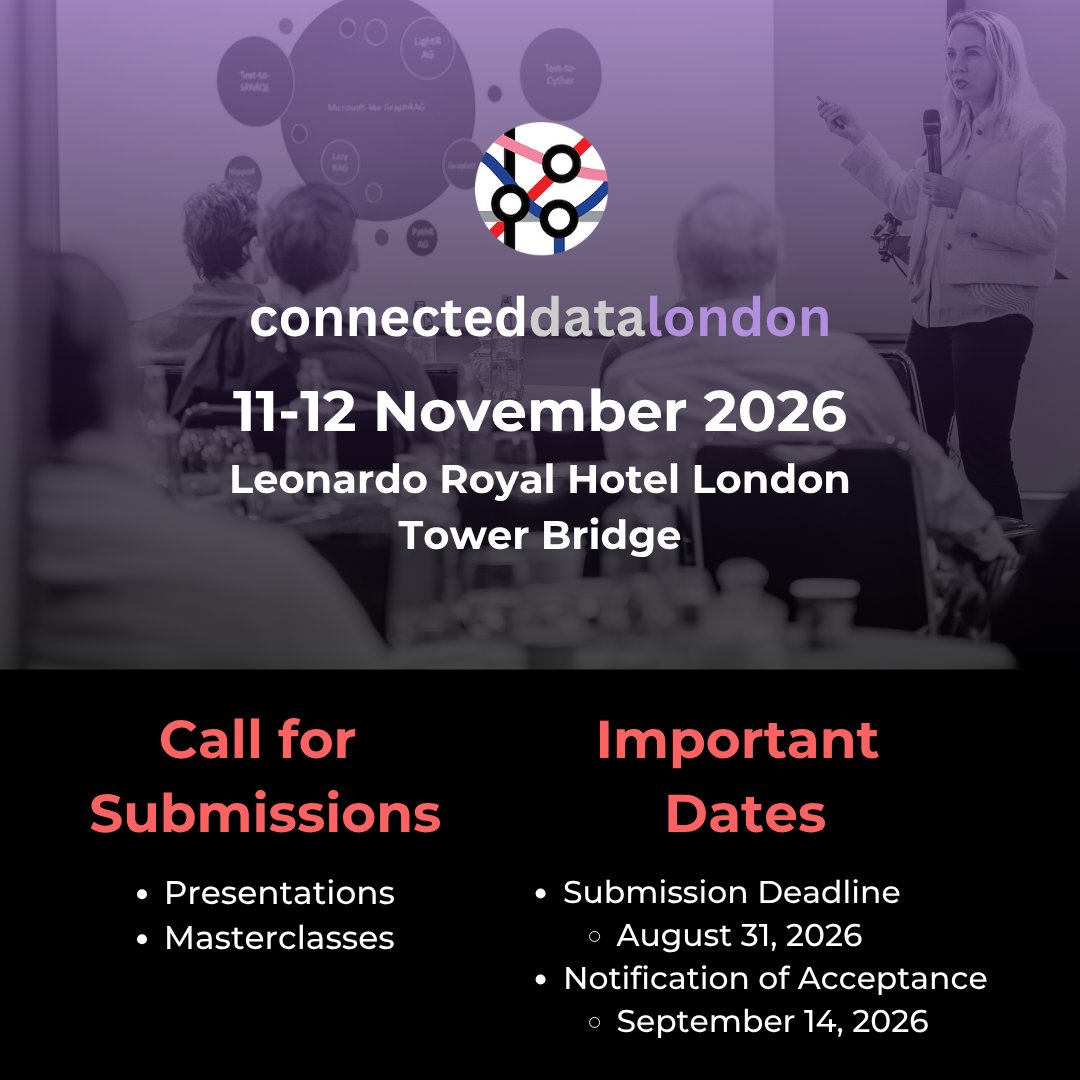
Connected Data tweet media
English
0
0
3
605
Connected Data
Connected Data@Connected_Data·
The Semantic Medallion: Building a Knowledge Graph-Powered Data Catalogue. Veronika Heimsbakk Leaders and Innovators Defining the Agenda on Knowledge Graphs, Graph Data Science and AI, Graph Databases, Semantic Technology and Ontologies Veronika is a Knowledge Graph Specialist at Data Treehouse, working on turning unstructured and chaotic data into a wonder of semantic knowledge graphs. Veronika is the author of SHACL for the Practitioner, an international speaker on Knowledge Graphs and Semantic Technologies, and a guest lecturer at the University of Oslo. Highlighting Veronika's work: The Semantic Medallion: Building a Knowledge Graph-Powered Data Catalogue Every data engineer knows the medallion architecture: Bronze (raw), Silver (cleaned), Gold (business-ready). But what if your Gold layer wasn’t just “clean data in nice tables”? What if it were a knowledge graph, where every record understands its relationship to every other record, across all your sources? Traditional data catalogues describe data structurally. A knowledge graph-powered catalogue describes data semantically - what things mean, how they relate, and what you can ask. The relationships are in the data itself, not buried in join logic or SQL scripts. Veronika is a member of the Programme Committee for CDL26. She is helping define the agenda and evaluate contributions for The leading global technology conference for those using Relationships, Meaning, and Context in Data to achieve great things. Join us as we celebrate a decade of innovation in #KnowledgeGraphs, #GraphAnalytics, #DataScience, #AI, #GraphDatabases, #SemanticTech and #Ontology. The Semantic Medallion: Building a Knowledge Graph-Powered Data Catalogue - moderndata101.substack.com/p/the-semantic… Connected Data London 2026 | 11–12 November | Leonardo Royal Hotel London Tower Bridge 🎤 Share your work with the world's most passionate data community. The Call for Submissions is open. connected-data.london/2026-call-for-… 🎟 Tickets on sale now. Advance rate discounts up to 15%. 2026.connected-data.london/?utm_source=tw… 📺 For sponsorship opportunities. Contact info@connected-data.london for details. #GraphRAG #ConnectedData #GraphDB #Analytics #EmergingTec
Connected Data tweet media
English
1
1
7
340
Connected Data
Connected Data@Connected_Data·
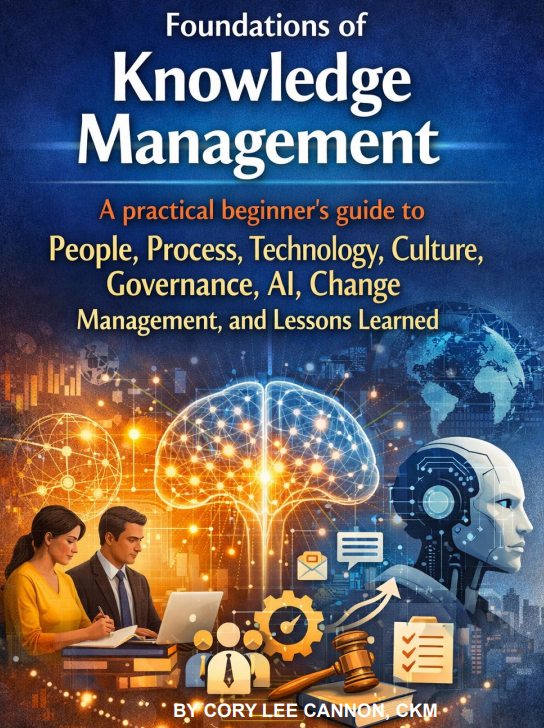
Foundations of Knowledge Management A practical beginner's guide to People, Process, Technology, Culture, Governance, AI, Change Management, and Lessons Learned Knowledge Management (KM) is the deliberate, systematic way an organization improves how it creates, shares, and uses knowledge to achieve its mission. A practical definition is KM helps the right people get the right know how at the right time, so they can make better decisions and execute faster. KM includes information and data, but it is not limited to them. Information management (IM) focuses on documents, records, and information products. Data management focuses on data quality, stewardship, metadata, and lifecycle controls. KM focuses on knowledge flow, expertise, context, learning, and reuse. KM as a Management System The ISO 30401 standard describes a knowledge management system as a management system that supports value creation through knowledge by establishing requirements and guidance for planning, operating, and improving KM in any type of organization (International Organization for Standardization, 2018).  This means KM is not a side project. It has objectives, roles, processes, measurements, and continual improvement. Why KM Matters Knowledge is one of the main drivers of operational excellence, risk reduction, and innovation. When knowledge does not flow, organizations see predictable symptoms: reinventing the wheel, repeated mistakes, slow onboarding, duplicated work, inconsistent decisions, brittle operations when key staff leave, and poor cross team coordination. KM addresses these issues by turning learning and reuse into routine behavior. It improves performance not by asking people to work harder, but by reducing friction and waste. What KM Is Not KM is not a single software platform. KM is not an intranet redesign. KM is not a document dump. KM is not a library with no owners. Technology helps, but KM succeeds when it is embedded into how an organization’s work is planned, executed, and reviewed. KM is not an offshoot of Data or information. In many ways KM is the human understanding of tacit and explicit (codified) knowledge. This book is written for people who are new to Knowledge Management (KM). It avoids jargon where possible and focuses on what KM looks like in the real world. You can read it start to finish or jump to the chapters that match your immediate needs. By Cory Lee Cannon Knoco training.knoco.com/wp-content/upl… #KnowledgeManagement #Book -- Connected Data London 2026 | 11–12 November | Leonardo Royal Hotel London Tower Bridge 🎤 Share your work with the world's most passionate data community. The Call for Submissions is open.  connected-data.london/2026-call-for-… 🎟 Tickets on sale now. Advance rate discounts up to 15%. 2026.connected-data.london/?utm_source=tw… 📺 Sponsorship opportunities available. Contact info@connected-data.london for details. #KnowledgeGraph #GraphRAG #Ontology #Graph #AI #DataScience #GraphDB #SemTech
Connected Data tweet media
English
0
0
5
221
Connected Data retweetledi
The Year of the Graph
Lakehouse graph database for context assembly & multi-agent coordination Most graphs stop at storage. As agent fleets grow, they don’t just read your graph, they write to it at machine speed. Without structure, those writes collide: conflicting updates, silent errors and knowledge decaying as fast as it’s created. Omnigraph is the operational state and coordination layer for fleets of agents. Declare it as code, run it as a server, and let your agents traverse and enrich it on parallel isolated branches. Every change is reviewed and merged safely, so knowledge actually compounds. See how it works 👉 go.linkeddataorchestration.com/yotg-omigraph-… #Graph #AgenticAI #AgentMemory #EmergingTech Omnigraph - helping bring Year of the Graph to life
The Year of the Graph tweet media
English
0
2
17
678
Connected Data
Connected Data@Connected_Data·
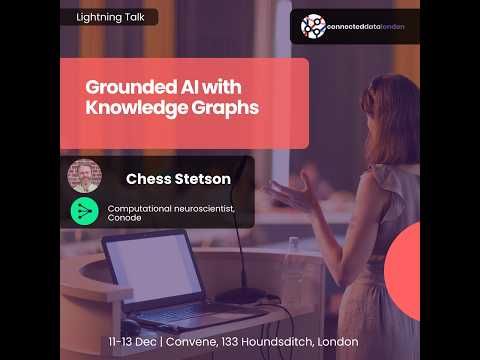
Grounded AI with Knowledge Graphs Despite the power of Gen AI, organizations still struggle to uncover value in their most complex data. Challenges in data integration, knowledge representation and reasoning still stand in the way of fact-based, hallucination-free AI in the business context. AI grounded in data should reveal deep, data-supported insights from even the most complex and poorly normalized databases. It is becoming increasingly understood in the field that Knowledge Graphs offer a highly promising methodology for grounded AI. Graph RAG, for example, allows for the highest-performance truth-based natural language-based knowledge retrieval, provided you can construct and maintain a rich enough knowledge graph. conode’s completely novel methodology for schema-on-read, full-observability graph construction, management and AI-agent-mediated evolution significantly advances this vision. By using knowledge graphs, organizations can improve the accuracy, relevance, and contextual understanding of their data, their AI’s behavior, and AI-generated content. This has significant implications for various industries, including customer service, content creation, and research. Target Audience: Data scientists, AI engineers, and business leaders who are interested in improving the performance of their AI applications. conode's in-memory architecture delivers lightning-fast performance, allowing you to build and explore knowledge graphs at unprecedented speeds. Gain a complete view of your data with a completely novel way of constructing and visualizing a graph from any set of dimensions conode’s intuitive platform makes it easy for anyone to build and manage knowledge graphs, without requiring extensive technical expertise. Conode eclipses both the most sophisticated database queries and most notebook coding via an easy-to-use combination of point-and-click and natural language commands. Leverage knowledge graphs to improve the accuracy, relevance, and contextual understanding of your AI-generated content. Build complex Knowledge Graphs in no time, without spending time on data fusion/prep/cleansing and ontology design to gain deep insights at speed Accelerate AI Development: Build and deploy AI models faster and more efficiently. Improve AI Performance: Enhance the accuracy, relevance, and contextual understanding of your AI-generated content. Gain a Competitive Advantage: Unlock the full potential of your data and stay ahead of the competition. By using conode's unparalleled graph technology, organizations can overcome the challenges of building and using knowledge graphs, unlocking the true potential of their data for AI applications. youtu.be/o-JCZ4gIHA4 -- Chess Stetson. Computational neuroscientist, Conode Chess completed his doctoral and post-doctoral work in Computation and Neural Systems at Caltech, and previously earned an AB in Physics from Harvard. -- Welcome to Connected Data London's #ThrowbackThursday Every Thursday at 3pm GMT, we are releasing gems from our vault on #YouTube Tune in and learn from leaders and innovators; subscribe to our channel and watch premieres as they are released!  #knowledgegraph #graphdatabase #graph #AI #datascience #analytics #semtech #ontology
YouTube video
YouTube
Connected Data tweet media
English
1
1
7
225
Connected Data
Connected Data@Connected_Data·
3,000 disasters. One knowledge graph. Every cascade mapped. Knowledge graphs are what let this dataset show something EM-DAT's authoritative statistics alone cannot: how one disaster causes another. A new study from the Joint Research Centre, with Engineering Ingegneria Informatica and the University of Louvain's Institute of Health and Society, published in Scientific Data, converts a decade of global disaster news into structured knowledge graphs, built specifically to capture cascading risk. The problem the graph structure solves: Heavy rainfall doesn't just cause flooding. It can disrupt transport networks, damage crops, and trigger disease outbreaks. Traditional disaster databases record each of those impacts in isolation, as separate line items with no relationship between them. A knowledge graph is the only structure built to hold the chain itself, not just the nodes. How the graphs get built: LLMs retrieve and read news articles tied to each disaster event, drawn from the Europe Media Monitor's archive of over 1.5 billion articles A first pass distills the coverage into a structured storyline: hazard, drivers, impacts, response A second pass extracts that storyline into subject-predicate-object triples, constrained to two relation types, "causes" and "prevents", producing a graph of reinforcing and mitigating effects across the disaster lifecycle The result: knowledge graphs for over 3,000 disaster events across 175 countries and 26 disaster types (2014-2024), each one a navigable network of hazards, vulnerabilities, and responses rather than a static record. This is what makes multi-hazard analysis possible at scale. Instead of manually cross-referencing reports to spot that a heatwave triggered a drought that triggered crop failure, the relationships are already encoded and queryable.  Emergency planners can trace knock-on effects, and researchers can reason over interactions that flat tabular records were never built to represent. The graphs were checked against expert judgment too: around 30 civil protection professionals reviewed a sample at a Brussels workshop, and six domain experts independently assessed 1,000 sampled triples for factual accuracy. Data, code, prompts, and an interactive dashboard for exploring the graphs are all openly available. By Michele Ronco et al New dataset uses AI and disaster news to fill in knowledge gaps and map interconnected risks joint-research-centre.ec.europa.eu/jrc-news-and-u… Disaster Storylines and Knowledge Graphs from Global News with Large Language Models and Retrieval-Augmented Generation nature.com/articles/s4159… #KnowledgeGraphs #CausalAI #DisasterRiskManagement #RAG #OpenData -- Connected Data London 2026 | 11–12 November | Leonardo Royal Hotel London Tower Bridge 🎤 Share your work with the world's most passionate data community. The Call for Submissions is open. connected-data.london/2026-call-for-… 🎟 Tickets on sale now. Advance rate discounts up to 15%. 2026.connected-data.london 📺 Sponsorship opportunities available. Contact info@connected-data.london for details. #KnowledgeGraph #GraphRAG #Ontology #Graph #AI #DataScience #GraphDB #SemTech
Connected Data tweet media
English
0
2
9
403
Connected Data
Connected Data@Connected_Data·
The Graph Database landscape is evolving faster than ever. 📈 From the long-standing debate of Triple Stores vs. Labeled Property Graphs (LPGs) to the rise of new engines and evolving standards, the way we store and access knowledge is shifting. At #CDL26, we’re exploring the next chapter of graph persistence. We are calling for speakers to share their work on: Standardisation & Performance: New approaches to transactional and analytical workloads at scale. Onboarding & Tooling: What are the most effective ways to get productive with graph DBs today? Architecture: APIs, GraphQL, MCP, and the role of conversational interfaces in accessing knowledge. Graph Engines vs. Databases: When do you need a persistence layer versus a dedicated analytics engine? Help us map the technical future of graph databases. 📅 Submission Deadline: 31 August 2026 📝 Submit here: connected-data.london/2026-call-for-… #ConnectedData #GraphDatabase #TripleStore #LPG #GQL #DataArchitecture #CDL26
Connected Data tweet media
English
0
2
5
298
Connected Data
Connected Data@Connected_Data·
Semantic Foundations for Reliable Enterprise AI Three weeks were spent diagnosing why an "enterprise-ready" LLM kept generating inaccurate Q3 revenue figures. It wasn't the prompt. It wasn't the context window. The cause was a semantic mismatch: marketing's 'revenue' field meant gross revenue before discounts. Finance's meant net revenue after returns. The model averaged the two. The output was linguistically correct and financially wrong. Most data contracts don't catch this. They validate types and nullability, not meaning. If "active user" isn't explicitly defined for the business, the LLM will define it for you, often incorrectly. Getting from disorganized data to genuine machine understanding takes a layered build: controlled vocabulary → taxonomy → thesaurus → ontology, the Ontology Pipeline framework developed by Jessica Talisman. Skip the vocabulary step and the ontology becomes an expensive tangle of synonyms. 🔹 Knowledge Graphs: The Rosetta Stone This is where the layers converge. A knowledge graph is the operational layer where controlled vocabularies, taxonomies, and ontologies become one queryable, machine-readable system. Ground an LLM in a knowledge graph built through a rigorous ontology pipeline, and it stops inferring and starts knowing: that Product X belongs to Category Y, is sold in Region Z, and that 'active users' follows a strictly defined formula anchored in the ontology. The difference shows up in the output. Not "I think revenue was around $2M," but "Net revenue for Q3, excluding returns, calculated per the IFRS definition in your finance ontology, was $2.14M." ⚠️ The Cultural Nightmare Rarely covered in vendor pitches: the organizational and political cost of getting here. Engineers ship features, not downstream awareness, so a renamed column can quietly break a RAG pipeline. Enforcing data contracts takes real cultural change, often requiring CTO and CDO involvement together. Start with the highest-impact data, not everything at once. Without this foundation, even the most advanced models are expensive autocomplete. By Anvar Atash Modern Data 101 moderndata101.substack.com/p/semantic-fou… #KnowledgeGraphs #DataContracts #EnterpriseAI #Ontology #LLM -- Connected Data London 2026 | 11–12 November | Leonardo Royal Hotel London Tower Bridge 🎤 Share your work with the world's most passionate data community. The Call for Submissions is open. connected-data.london/2026-call-for-… 🎟 Tickets on sale now. Advance rate discounts up to 15%. 2026.connected-data.london 📺 Sponsorship opportunities available. Contact info@connected-data.london for details. #KnowledgeGraph #GraphRAG #Ontology #Graph #AI #DataScience #GraphDB #SemTech
Connected Data tweet media
English
0
2
7
342
Connected Data retweetledi
The Year of the Graph
🌟 Beyond Abstract Nodes: Why Geometric Graphs are Revolutionizing AI 🌟 If you've worked with Graph Neural Networks (GNNs), you know they excel at modeling abstract relationships—like social networks, financial transactions, or recommender systems. But what happens when your graph enters the physical world? 🌐 In Chapter 8 of the Geometric Deep Learning book, the authors take us from purely relational data structures into continuous 3D space, diving into the fascinating world of Geometric Graphs. Here is a quick breakdown of what they are, why they matter, and how they are transforming physical AI: 🔷 What are Geometric Graphs? Standard graphs only care about topology (who is connected to whom). However, in natural systems, nodes possess physical, spatial coordinates. A molecule isn’t just an abstract web of chemical bonds; it’s a 3D structure that bends, twists, and occupies space to minimize potential energy. Geometric graphs merge the relational power of graphs with actual spatial coordinates (like 3D point clouds). 🔷 Why the Shift Matters: The Symmetries of Physical Space In traditional GNNs, the golden rule is permutation equivariance (changing the order of nodes shouldn't change the underlying structure). But moving into the physical world introduces a new challenge: continuous symmetries—like rotations and translations in 3D space (mathematically known as E(3) or SE(3) symmetries). If a molecule or a 3D object rotates in space, its physical and chemical properties remain exactly the same. Standard GNNs often struggle with this because they treat coordinates as regular, flat numbers. Geometric graphs natively respect these physical laws, ensuring that AI predictions remain consistent no matter how an object is oriented or shifted. 🔷 Upgrading GNNs for the 3D World To process geometry effectively, advanced architectures like Tensor Field Networks (TFNs) and SE(3)-Transformers come into play. Instead of using simple, abstract feature vectors, they use specialized geometric features (like scalars, vectors, and tensors) that transform predictably as the underlying space rotates or moves. 🔷 Impactful Real-World Use Cases 1️⃣ Drug Discovery & Material Science: Predicting how small molecules interact, change shapes, and bind to protein targets—drastically accelerating how we find life-saving medicines. 2️⃣ Structural Biology (AlphaFold 2): AlphaFold 2 leveraged these exact principles of $SE(3)$-equivariant neural networks to crack the 50-year-old protein folding problem, famously earning its creators the Nobel Prize in Chemistry in 2024! 🏆 3️⃣ Computer Graphics & 3D Vision: Utilizing Mesh Convolutional Networks to process 3D point clouds and shape meshes, which are vital for autonomous driving, robotics, and VR. 🔬 Want to dive into the math? The full chapter goes deep into the elegant mechanics behind this framework—covering irreducible representations, Clebsch-Gordan coefficients, and discretizing manifolds to build mesh networks. If you have a background in AI and want to understand the architecture powering the next generation of physical AI, this chapter is a must-read. By Petar Veličković Michael Bronstein Joan Bruna Taco Cohen geometricdeeplearning.com/book/geometric… geometricdeeplearning.com/slides/Oxford_… #MachineLearning #AI #GraphNeuralNetworks #GeometricDeepLearning #DataScience #BioTech #AlphaFold #Science #Math -- Join the Conversation Subscribe to the Year of the Graph newsletter for quarterly insights on #KnowledgeGraphs, #GraphDB, Graph #Analytics, #AI, #DataScience and #SemTech . 📧 Subscribe: yearofthegraph.xyz/newsletter  💼 Sponsorship inquiries: yearofthegraph.xyz/contact/
The Year of the Graph tweet media
English
0
4
12
792
Connected Data
Connected Data@Connected_Data·
Exploring Types of Agent Memory As AI agents become increasingly sophisticated, their ability to maintain coherent, retrievable memory across conversations has become the defining factor between basic chatbots and truly intelligent assistants. The challenge isn't just storing information—it's about creating dynamic, interconnected memory systems that help agents understand context, discover relevant connections, and provide personalized responses. The goal of this masterclass is to take participants from traditional vector-based RAG systems to building production-ready graph-powered memory architectures for AI agents. We will start with conversational data and demonstrate how to extract meaningful entities and relationships, then progressively build a complete graph memory system that evolves with each agent interaction. Using practical examples with the Vercel AI SDK, participants will implement entity extraction pipelines, design graph schemas for conversational memory, and integrate both Neo4j and Dgraph as complementary solutions. We'll explore direct framework integration patterns versus tool-based approaches through the Model Context Protocol (MCP), giving participants hands-on experience with both architectural strategies. Once participants are comfortable with basic graph operations and memory retrieval, we will advance into GraphRAG implementations, dynamic context window optimization, and real-time memory evolution techniques. We'll examine how to balance memory persistence with retrieval speed, implement conversation summarization strategies, and handle memory conflicts across multiple conversation threads. This masterclass is targeted towards AI engineers, backend developers, and technical leads working on conversational AI systems. Participants will learn how to architect intelligent memory systems that transform static AI agents into context-aware, personalized assistants capable of maintaining long-term conversational relationships. The end result will be that participants can architect and implement graph-powered memory systems from scratch, integrate them seamlessly with modern AI frameworks, and deploy production-ready solutions that significantly enhance agent intelligence and user experience. Link to Masterclass - Hands On Building Intelligent Memory: Graph Databases for AI Agent Context and Retrieval: 2025.connected-data.london/talks/hands-on… Key Topics Graph modeling principles for conversational AI memory systems Entity extraction and relationship mapping from conversational data Comparative analysis of Neo4j vs Dgraph for AI agent architectures Direct integration patterns with Vercel AI SDK and other modern frameworks Model Context Protocol (MCP) implementation for tool-based graph access GraphRAG implementation strategies and optimization techniques Dynamic memory evolution and conversation summarization Production deployment patterns and performance optimization Target Audience AI Engineers and Machine Learning Engineers Backend Developers working on conversational AI Technical Leads and Engineering Managers AI Product Managers with technical backgrounds Goals Build production-ready graph-powered memory systems for AI agents that maintain context across conversations, discover relevant connections, and enable personalized, intelligent responses through hands-on implementation and architectural design. Session Outline: Introduction to AI Agent Memory Challenges Limitations of vector-based RAG for conversational memory Why graph thinking transforms agent intelligence Overview of graph vs. vector approaches for context retrieval Graph Database Fundamentals for AI Memory Modeling conversations as entity-relationship networks Schema design principles for conversational graphs Comparing Neo4j and Dgraph for AI agent use cases Entity Extraction and Graph Population Implementing entity extraction pipelines from conversational data Handling multi-turn conversations and context evolution Building relationships between extracted entities and conversation topics Integration Architecture Patterns Direct framework integration with Vercel AI SDK Tool-based approaches using Model Context Protocol (MCP) Trade-offs between integration strategies and when to use each GraphRAG Implementation Workshop Building graph-aware retrieval systems Optimizing memory queries for agent context windows Implementing conversation summarization and memory consolidation Advanced Memory Evolution Techniques Dynamic graph updates during conversations Handling memory conflicts and conversation branching Performance optimization for real-time agent responses Production Deployment and Scaling Deployment patterns for graph-powered agent memory Monitoring and debugging graph memory systems Cost optimization and scaling strategies Format This masterclass combines conceptual foundations with intensive hands-on implementation. The session begins with architectural concepts but quickly transitions to practical coding exercises. Participants will work with live Neo4j and Dgraph instances, implementing complete memory systems using the Vercel AI SDK and JavaScript/TypeScript. We'll progress from basic entity extraction to full GraphRAG implementations through guidedcoding sessions. All code examples will be provided in interactive notebooks and GitHub repositories. Participants will build working AI agent memory systems that they can immediately deploy and extend. The workshop includes real conversational datasets for testing and validation, plus debugging sessions to troubleshoot common integration challenges. Level Intermediate - Advanced Prerequisite Knowledge Basic level of understanding of modern AI frameworks Basic understanding of conversational AI concepts and RAG systems Some exposure to graph databases or willingness to learn Cypher quickly Experience with API integration and backend development patterns -- William Lyon. Developer Experience, Hypermode William Lyon is an AI engineer at Hypermode where he works to improve the developer experience of putting AI applications into production. Previously he worked as a software developer at Neo4j and other startups. He is also the author of the book “Fullstack GraphQL Applications” -- Welcome to Connected Data London's #TeaserTuesday Every Tuesday, we share teasers from #CDL25 on our channels Connected Data London 2025 brought together leaders and innovators. Were you there? 🎥 Watch the sessions: 2025.connected-data.london 📩 Join the community: connected-data.london Tune in and learn from leaders and innovators; subscribe and watch premieres as they are released!  Join community legends and new voices in #CDL25 for all things #KnowledgeGraph #Graph #analytics #datascience #AI #graphDB #SemTech #Ontology
English
2
0
5
439
Connected Data
Connected Data@Connected_Data·
Why Knowledge Graphs are Becoming a Key Investment Theme in the Next Wave of Intelligent Data Management The Global Knowledge Graph Market was valued at USD 1.34 billion in 2025 and is expected to reach USD 19.16 billion by 2035, growing at a CAGR of 30.8% during the forecast period 2026-2035.  Growth is driven by increasing demand for intelligent data integration and semantic search capabilities across enterprises. Rising adoption of AI, machine learning, and natural language processing is accelerating the use of knowledge graph technologies. The growing need for enhanced data analytics, recommendation systems, and decision intelligence is further supporting market expansion.  Additionally, advancements in graph databases and enterprise knowledge management platforms are improving scalability and performance. Expanding digital transformation initiatives are also contributing to exceptional market growth. Entity resolution represents the largest task segment because it enables organizations to identify, match, and consolidate duplicate entities from multiple data sources, improving data quality and supporting analytics, fraud detection, and customer intelligence initiatives. The entity resolution segment accounts for approximately 29% of the total market. AI & Machine Learning AI and machine learning represent the largest application segment as knowledge graphs significantly improve AI model accuracy, contextual reasoning, explainability, and retrieval-augmented generation (RAG). They have become a critical foundation for enterprise generative AI and intelligent automation platforms. Banking, financial services, and insurance (BFSI) is the leading end-user segment due to extensive use of knowledge graphs for fraud detection, risk analysis, customer intelligence, anti-money laundering (AML), and regulatory compliance. Financial institutions leverage knowledge graphs to uncover hidden relationships and improve decision-making across large datasets. Large Enterprises Large enterprises dominate the knowledge graph market due to their complex data ecosystems, extensive digital transformation initiatives, and growing investments in AI-driven knowledge management. These organizations increasingly leverage knowledge graphs to improve search capabilities, automate workflows, and enhance business intelligence. Structured Data Structured data dominates the market as enterprises continue to build knowledge graphs using databases, enterprise resource planning (ERP) systems, customer relationship management (CRM) platforms, and other structured business applications. Structured datasets provide high-quality relationships that simplify knowledge graph implementation. By DataM Intelligence openpr.com/news/4575021/w… #Market #Report #Business #Analysis #EmergingTech -- Connected Data London 2026 | 11–12 November | Leonardo Royal Hotel London Tower Bridge 🎤 Share your work with the world's most passionate data community. The Call for Submissions is open.  connected-data.london/2026-call-for-… 🎟 Tickets on sale now. Advance rate discounts up to 15%. 2026.connected-data.london 📺 Sponsorship opportunities available. Contact info@connected-data.london for details. #KnowledgeGraph #GraphRAG #Ontology #Graph #AI #DataScience #GraphDB #SemTech
Connected Data tweet media
English
0
2
3
258
Connected Data retweetledi
The Year of the Graph
Context Graphs are a Convergence, and Convergence Needs Architecture When Foundation Capital declared context graphs AI’s next trillion-dollar opportunity in late 2025, it looked like a new category arriving – and with it, a new set of questions about context graph architecture. What it was is something older arriving under a new name: the problem of structuring organisational knowledge to make it discoverable and usable. Forrester’s Charles Betz made this point in “Context Graphs Are A Convergence, Not An Invention.” He traced the entity graph lineage back 40 years through Enterprise Architecture (EA), the discipline responsible for mapping an organisation’s technology, capabilities and their relationships. Configuration Management Databases, Application Performance Monitoring and process mining are established disciplines with their own tooling. These disciplines have been building the pieces of a unified context graph in isolation for decades. The decision trace layer – who approved what, why, under what authority – isn’t missing. It’s fragmented: scattered across Slack threads, incident postmortems, Jira tickets, and people’s heads. What that fragmentation represents is something Jessica Talisman named directly in “Ontologies, Context Graphs, and Semantic Layers“: this is fundamentally a knowledge management problem. Eliciting tacit knowledge, encoding reasoning, and representing it in formal, machine-queryable form requires systematic knowledge engineering. Another conversation runs in parallel, largely unaware of decision traces and knowledge engineering. The BI world has its own semantic layer: the abstraction above the data warehouse that maps business terms to query logic, seen today in tools like dbt and AtScale’s semantic layers, or Cube’s universal semantic layer. These three threads – the context graph thesis, Betz’s EA-grounded convergence, and the knowledge graph and semantic technology tradition – are moving toward each other. The knowledge architecture problem is what connects them. In “Why Context Graphs Need Knowledge Architecture“, George Anadiotis maps that connection, and points to where the work is already being done. The follow-up, Context graph architecture in 2026, explores this in engineering terms. Context graphs are a convergence, and convergence needs architecture argues Kurt Cagle. -- 📩 Excerpt from The Year of the Graph Summer 2026 newsletter Read "Layers of Meaning: Context Graphs, Graph Memory, and Ontologies for AI" with more sections, references and attribution here 👇 yearofthegraph.xyz/newsletter/202… All things #KnowledgeGraph, #GraphDB, Graph #Analytics / #DataScience / #AI and #SemTech.
The Year of the Graph tweet media
English
1
5
29
1.3K
Connected Data
Connected Data@Connected_Data·
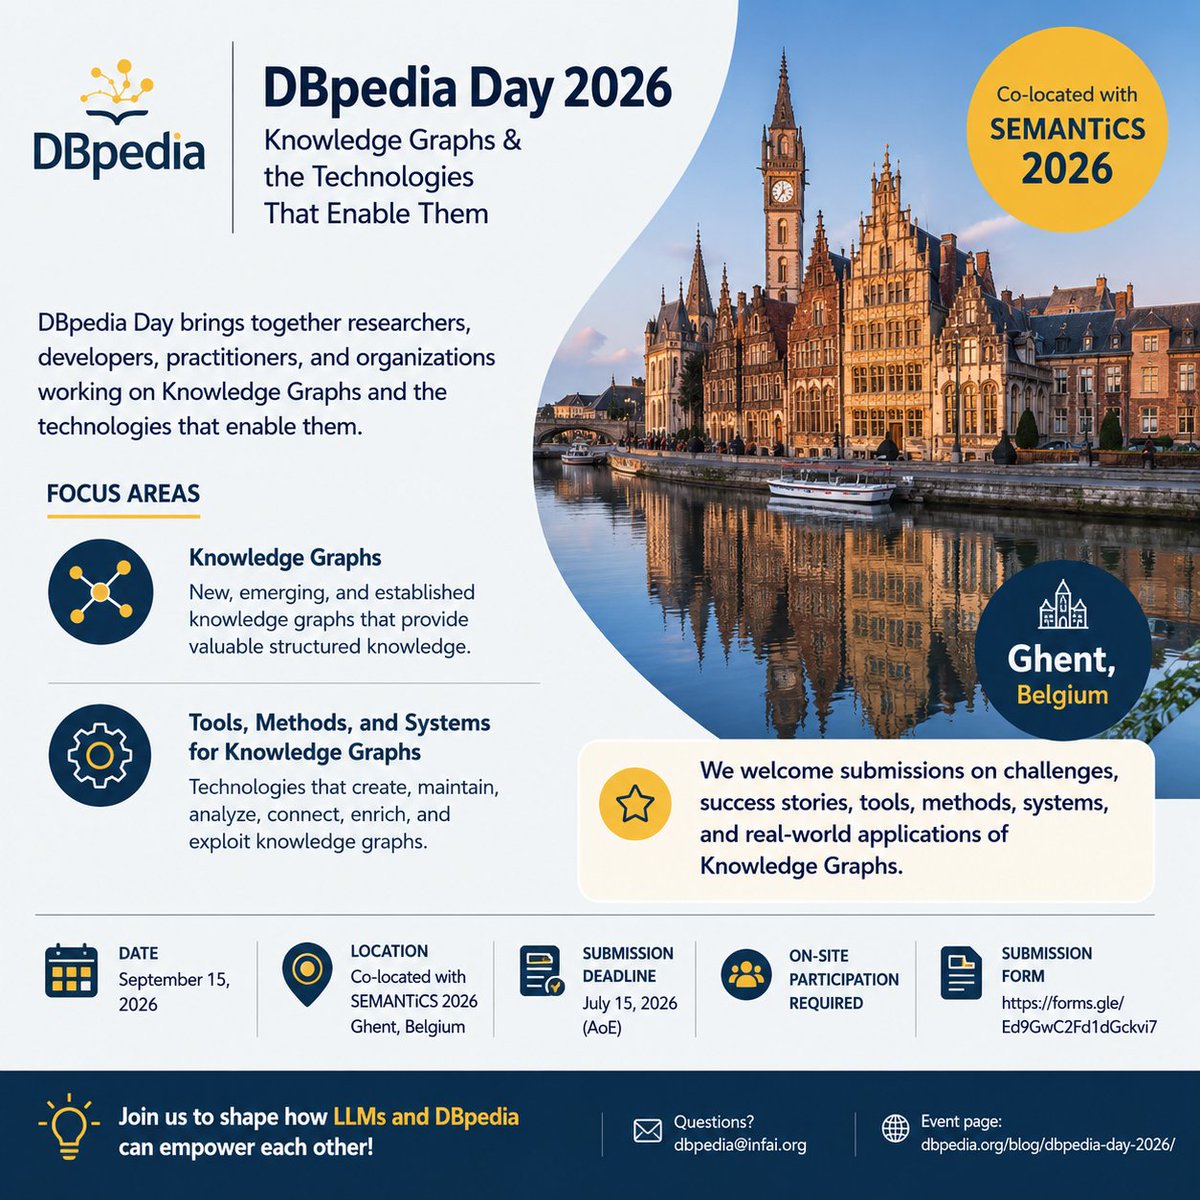
🚀 Calling all Knowledge Graph and AI practitioners! We are proud to support the DBpedia team in announcing the Call for Presentations for DBpedia Day 2026. As one of the pioneering open Knowledge Graph initiatives, DBpedia continues to drive the future of structured knowledge. This year’s event will dive deep into how Knowledge Graphs and Large Language Models (LLMs) can complement each other - paving the way for more reliable, explainable, and interoperable AI. Whether you are an academic researcher or an industry developer, if you are building innovative tools or driving real-world semantic applications, this is your stage to share your insights! Event Details Date: September 15, 2026 Location: Ghent, Belgium (co-located with SEMANTiCS 2026) Current Deadline: July 15, 2026 (AoE) - Get your submissions in soon! We highly encourage submissions exploring: New and established Knowledge Graphs AI-assisted Knowledge Graph construction & engineering Entity linking, reasoning, and analytics Real-world applications and lessons learned Let's shape the next generation of Knowledge Graph technologies together. 📩 Submit your proposal here: lnkd.in/dgB-hBGv?utm_s… 📖 Read the full Call for Presentations: dbpedia.org/blog/dbpedia-d… #DBpedia #DBpediaDay #KnowledgeGraphs #SemanticWeb #LinkedData #ArtificialIntelligence #LLM #KnowledgeEngineering #SEMANTiCS2026 #CallForPapers
Connected Data tweet media
English
0
1
7
256
Connected Data
Connected Data@Connected_Data·
The Biology of Knowledge Four billion years of evolution has already solved the problem enterprises are still fumbling: how to keep enormous amounts of information accurate, reusable and inheritable inside a noisy, resource-constrained world. No central database. No downtime. A fraction of the energy cost. The article maps that biological operating model onto enterprise knowledge management, layer by layer: 🧬 Data → the Genome. Your data is the durable, compact substrate of what makes the organization unique. Like DNA, it needs strong identity edges and weak, reformable associative edges, protected through constraint, redundancy and repair, not hope. 📄 Information → the Transcriptome. Data expressed in context, the way genes are transcribed into mRNA. Selective, clearly marked as "not the source," spliceable into audience-specific views, and disposable. One truth, many expressions, zero rewrites of the canon. 🧩 Knowledge → the Proteome. Information folded into working form, validated the way chaperones fold proteins and reject misfolds. False beliefs are misfolded knowledge, some just broken, some prion-like and self-replicating. Obsolete knowledge must be retired, gracefully, or it hardens into dogma. ⚡ Decision → the Metabolome. Knowledge acting on the world. Metabolism is a flow, not a stock, and hoarding is pathology. Every decision needs a feedback loop back to memory, or decision-making becomes ritual instead of intelligence. 🤖 Enzymes → AI Agents. Specialized catalysts, not one universal model. Their real job is signal transduction, sensing context accurately, and they must operate under governance: access control, provenance, validation before acting. 🛡 Membranes → Boundaries. Two of them. The outer membrane senses the world and decides what's relevant now, fast, porous, yours to build. The inner membrane guards the canon, slow and tightly gated. Context stays fast and plural; data stays slow and singular. The conclusion: in a fast-changing, increasingly predatory business environment, the goal isn't a tidier warehouse with a chatbot on top. It's growing a living organism, one that adapts without losing coherence, and forgets on purpose rather than accumulating dogma. By Cedric Berger The Biology of Knowledge biomedima.org/the-biology-of… Intelligent Data for Life Sciences - Beyond the Hype, how Tailored Graph-AI Solutions Change the Game 2025.connected-data.london/talks/intellig… #KnowledgeManagement #Biomimicry #EnterpriseArchitecture #DataGovernance #DigitalTransformation -- Connected Data London 2026 | 11–12 November | Leonardo Royal Hotel London Tower Bridge 🎤 Share your work with the world's most passionate data community. The Call for Submissions is open. connected-data.london/2026-call-for-… 🎟 Tickets on sale now. Advance rate discounts up to 15%. 2026.connected-data.london 📺 Sponsorship opportunities available. Contact info@connected-data.london for details. #KnowledgeGraph #GraphRAG #Ontology #Graph #AI #DataScience #GraphDB #SemTech
Connected Data tweet media
English
0
3
2
291
Connected Data retweetledi
The Year of the Graph
The Year of the Graph@TheYotg·
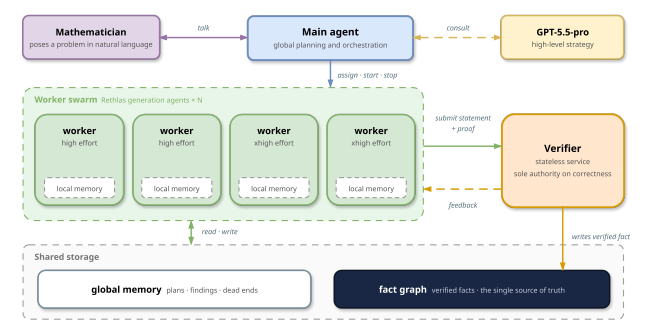
Verified fact graphs for multi-agent reasoning Most "agentic memory" is a retrieval index: store chunks, rank them, read the top. Danus, a new orchestration system for research-level mathematics, treats memory as the opposite. The graph is the work product, and nothing enters it unverified. Memory becomes useful when it stops being passive storage. A verified graph gives agents a shared work surface, which is very different from each worker dragging its own lossy summary through the run. A context window holds a conversation. A fact graph holds a proof. Danus coordinates a main agent, a swarm of parallel worker agents, and a stateless verifier around one shared structure: Every proposed claim is checked before it's admitted, and only verified facts, stored with their proof and dependencies, enter the graph. It becomes the system's single source of truth. The practical case for this architecture: 🔬 One proof reached 3,157 verified facts, dependency chains 54 nodes deep, in a five-day run. Another was solved end to end, unprompted, in about 90 minutes. On the largest case, the predecessor system, Rethlas, running the exact same models, failed three times where Danus produced a complete verified solution — the difference was the orchestration, not the model. Why a graph beats a shared document: A single blueprint forces every worker to carry the whole accumulated proof in context. The fact graph lets each worker retrieve only what its current claim needs, so context stays small even as the proof runs to thousands of facts. It also lets contributions from many workers accumulate into one structure instead of colliding over the same file. The verifier is the trust boundary, and it's stateless on purpose: a fresh instance judges each submission and retains nothing after, so correctness stays a pure function of the claim and its cited dependencies, not something workers can talk their way around. ⚠️ Where it breaks: the verifier becomes the system's single point of failure. A flawed cited reference can propagate errors into the graph until a human catches it. And width and depth of search only locate a path that already exists — several impasses in these case studies were only broken when a human expert supplied the missing idea. Human mathematicians remained essential throughout: posing the problems, supplying the occasional missing idea, and checking every finished manuscript line by line before release. H/T Anthony Alcaraz arxiv.org/abs/2607.06447 #AgenticAI #KnowledgeGraphs #AIOrchestration #LLMAgents #Research #Science #EmergingTech - 📩 The Year of the Graph Summer 2026 newsletter issue is out! Layers of Meaning: Context Graphs, Graph Memory, and Ontologies for AI. 👇 yearofthegraph.xyz/newsletter/202… All things #KnowledgeGraph, #GraphDB, Graph #Analytics / #DataScience / #AI and #SemTech. Subscribe and follow to be in the know. Reach out if you'd like to be featured
The Year of the Graph tweet media
English
2
2
19
835
Connected Data
Connected Data@Connected_Data·
7 Months, 7 Continents: The Complete Map of Graph Technology: Maya Natarajan Leaders and Innovators Defining the Agenda on Knowledge Graphs, Graph Data Science and AI, Graph Databases, Semantic Technology and Ontologies Maya Natarajan is the founder of node2node and co-founder of State of the Graph, a vendor-neutral initiative that maps and analyses the graph technology landscape.  With over 15 years of experience in graph technology, she specialises in connecting technical graph capabilities to real-world AI applications, with a current focus on knowledge graphs, GraphRAG, and graph memory for agentic AI. She holds a Ph.D. in Chemical Engineering from Rice University and five patents. Highlighting Maya's work: 7 Months, 7 Continents: The Complete Map of Graph Technology Across 7 categories, the State of the Graph catalogue has evaluated 128 unique products from 113 vendors. The ecosystem is genuinely interconnected; a graph database can double as a knowledge graph platform, and a GraphRAG engine can serve directly as a memory layer. Knowledge Graphs and GraphAI share the most significant overlap on the map. This active frontier is accelerating rapidly, generating new architectural patterns faster than any traditional industry blueprint can capture. Maya is a member of the Programme Committee for Connected Data London 2026. She is helping define the agenda and evaluate contributions for The leading global technology conference for those using Relationships, Meaning, and Context in Data to achieve great things. Join us in London for #CDL26 as we celebrate a decade of innovation in Knowledge Graphs, Graph Analytics, Data Science, AI, Graph Databases, Semantic Tech and Ontology. 7 Months, 7 Continents: The Complete Map of Graph Technology - stateofthegraph.com/2026/06/18/7-m…  -- Connected Data London 2026 | 11–12 November | Leonardo Royal Hotel London Tower Bridge 🎤 Share your work with the world's most passionate data community. The Call for Submissions is open. connected-data.london/2026-call-for-… 🎟 Tickets on sale now. Advance rate discounts up to 15%. 2026.connected-data.london/?utm_source=tw… #KnowledgeGraph #GraphRAG #Ontology #Graph #AI #DataScience #GraphDB #SemTech #CDL26 #ConnectedData
Connected Data tweet media
English
1
0
3
258
Connected Data
Connected Data@Connected_Data·
Your Knowledge Graph Is the One Thing That Should Survive a Harness Switch Models are commoditizing fast. Harnesses already have. Paul Iusztin makes the case that the knowledge graph sitting underneath your agent memory is the real asset worth owning, and everything else — the harness, even the model — should be disposable on top of it. The graph he's building for the Tree project fuses a POLE+O ontology (Person, Organization, Location, Event, Object) with vector and keyword search inside a single unified memory. Typed nodes, traversable relationships, and lineage back to the source document on every entity extracted. Three reasons a graph-anchored memory matters: * Switch harnesses and every entity, relationship, and learned preference the graph has captured stays intact — you don't start over * Skills and workflows built on top of the graph don't inherit one harness's quirks, so they don't quietly break when you move * The graph is what gives you lineage for free - where each node was extracted from, who owns it, how it connects to everything else On implementation, the piece makes a strong case against splitting memory across a graph DB, a vector DB, and a document store. A single database like MongoDB that indexes text, vector, and graph together beats stitching three specialized ones — one query joins across all three instead of paying a cross-database sync tax. Try your best to build your unified memory on top of a single database that supports text, semantic, and graph search. Start simple and add complexity only when your use case demands it. The RAM finding is the sharpest part: a knowledge graph has two snapshots, an append-only ingestion log and a materialized, queryable view. Vector-indexing both inflates memory footprint roughly 4x. Index only the materialized graph, leave the log on disk, and it collapses back down — same data, a quarter of the RAM. For deep multi-hop traversal or graph-native tooling, a specialized graph DB like Neo4j still earns its place — sync production data to it for exploration and visualization when 2-3 hop queries aren't enough. Get the ontology and the graph right, and swapping the harness on top becomes a one-line config change. By Paul Iusztin decodingai.com/p/the-context-… #AgenticAI #GraphRAG #Ontology #AgentMemory #POLE #EmergingTech -- Connected Data London 2026 | 11–12 November | Leonardo Royal Hotel London Tower Bridge 🎤 Share your work with the world's most passionate data community. The Call for Submissions is open. connected-data.london/2026-call-for-… 🎟 Tickets on sale now. Advance rate discounts up to 15%. 2026.connected-data.london 📺 Sponsorship opportunities available. Contact info@connected-data.london for details. #KnowledgeGraph #GraphRAG #Ontology #Graph #AI #DataScience #GraphDB #SemTech
Connected Data tweet media
English
1
8
18
2.1K
Connected Data retweetledi
The Year of the Graph
The Year of the Graph@TheYotg·
Stop Querying, Start Discovering Your knowledge graph holds answers your queries never reach. Graphlytic Cloud puts AI-aided exploration in the hands of knowledge analysts. Search for graph patterns, trace hidden connections, and surface insights across your data without writing a single query. – Natural language AI commands – no queries required. – Intuitive, fast graph exploration and discovery. – Built for enterprise knowledge graphs. Works with all major graph DBs. – Zero infrastructure setup, collaborative by default. 👉 Start your 7-day free trial now: go.linkeddataorchestration.com/yotg-graphlyti… #Analytics #KnowledgeGraph #GraphDB #AI #Cloud #Innovation #DataScience Graphlytic - helping bring Year of the Graph to life
The Year of the Graph tweet media
English
0
1
4
338
Connected Data
Connected Data@Connected_Data·
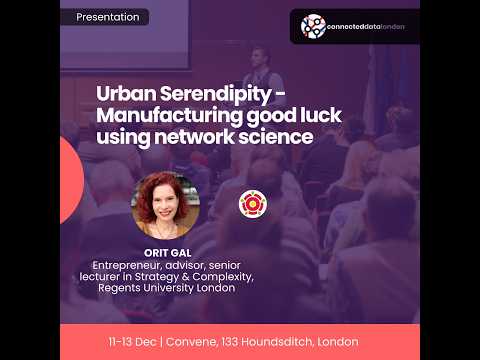
Urban Serendipity - Manufacturing good luck using network science Serendipity is the unintentional discovery of beneficial resources; in cities, this is all about discovering other people – random collisions between strangers leading to flows of ideas, resources, and, at times, further friendships and collaborations. This talk covers how we can increase urban serendipity and maximize positive social encounters. You'll learn about network science principles that you can apply to complex graph analysis and forge better outcomes.  Jeffery West famously described cities as simply the manifestations of their underlying human networks. From a social evolutionary perspective, they have evolved to maximise human collaboration and innovation across ever larger groups of people.  Urban networks feed on a density of interactions between strangers. Yet today's technological advances in the ways we work, live, and play have taken out many positive friction points via which previous serendipitous collisions occurred - from the daily trip to the shops, queuing for errands, simply being bored on commutes, or asking someone for directions or a lighter.  With 75% of humanity expected to live in cities by 2040, the big question is, how can we harness our new ways of living to introduce new serendipitous enablers? We'll quickly overview our study, which aims to identify new patterns in network behavior within the urban space. You'll hear how city leaders can use those patterns to encourage positive social friction using both physical and digital design.  You'll learn why all complex systems thrive best within Goldilocks conditions across multiple dimensions or systemic functions. With the right network structures, degrees of freedom, and information flows, such systems are perfect connectors that maximise opportunities. This is the true magic of cities and high-performing networks.  Join this talk and learn how to use network and graph theory to understand urban data, uncover patterns for complex problem-solving, and promote better outcomes. youtube.com/watch?v=Smq5KH… -- Orit Gal. Entrepreneur, advisor, senior lecturer in Strategy & Complexity, Regents University London Dr. Orit Gal is an entrepreneur, advisor, and senior lecturer in Strategy & Complexity at Regent's University London. She specialises in analysing trends and identifying potential for systemic change within complex environments. -- Welcome to Connected Data London's #ThrowbackThursday Every Thursday at 3pm GMT, we are releasing gems from our vault on #YouTube Tune in and learn from leaders and innovators; subscribe to our channel and watch premieres as they are released!  #knowledgegraph #graphdatabase #graph #AI #datascience #analytics #semtech #ontology
YouTube video
YouTube
English
0
0
3
239
Connected Data
Connected Data@Connected_Data·
The next 20 years of Linked Data July 2026 marks the 20th anniversary of Tim Berners-Lee’s seminal July 2006 design note on Linked Data. In that note, Berners-Lee set out four simple rules:  1) Use URIs to identify things,  2) Use HTTP so those things can be looked up,  3) Return useful data in standard formats such as RDF, and  3) Include links to other related resources. Twenty years later, those ideas look remarkably current. As AI agents, knowledge graphs, and data-centric systems become more important, Linked Data offers a practical way for software to discover ground-truth information across the web and across organisations. On July 29, our friends at GraphCentric are organizing an event for anyone interested in knowledge graphs, RDF, SPARQL, the Semantic Web, AI agents, and better ways to build software on the web. Agenda 6:00pm - Arrivals and introductions 6:15pm - Short talk: Linked Data was 20 years ahead of its time 6:45pm - Discussion, questions, drinks, and networking 7:00pm - Toast to Tim Berners-Lee and Linked Data meetup.com/london-graphce… -- Connected Data London 2026 | 11–12 November | Leonardo Royal Hotel London Tower Bridge 🎤 Share your work with the world's most passionate data community. The Call for Submissions is open.  connected-data.london/2026-call-for-… 🎟 Tickets on sale now. Advance rate discounts up to 15%. 2026.connected-data.london 📺 Sponsorship opportunities available. Contact info@connected-data.london for details. #KnowledgeGraph #GraphRAG #Ontology #Graph #AI #DataScience #GraphDB #SemTech
Connected Data tweet media
English
0
2
1
188
Connected Data retweetledi
The Year of the Graph
The Year of the Graph@TheYotg·
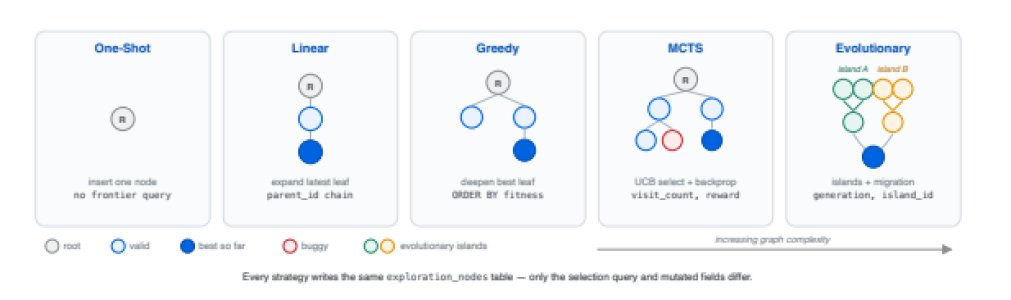
Experience Graphs: The Data Foundation for Self-Improving Agents Intelligence is Free, Now What? The database community has repeatedly advanced the state of the art by recognizing that new workloads demand new system architectures. Research from Meta and the University of Maryland argues that long-horizon agentic tasks -- code generation, scientific discovery, hardware design -- are such a workload.  These agents explore: they generate artifacts, execute tools, observe failures, branch, and repair over hundreds of steps. This search produces a structured object they call an experience graph: executable artifacts, tool outputs, rewards, sibling comparisons, and causal lineage.  Yet existing agent frameworks treat this experience as disposable state -- JSON checkpoints and session logs that cannot be recovered after a crash, queried across users, or materialized into training data.  Trellis is a data foundation that treats the experience graph as first-class, governed, queryable database state. The core insight is that search over experience graphs is a database access pattern.  Frontier selection is a query, cross-session reuse is vector-seeded graph retrieval, training-data extraction is a materialized view, and reconstructing what an agent knew at any past step is a time-travel query.  When the database owns the experience graph, agents become stateless compute, and crash recovery, horizontal scaling, and a closed-loop training flywheel emerge as architectural byproducts.  More broadly, Trellis turns inference-time search from disposable computation into a durable institutional asset: logs made databases reliable; experience graphs may make agents cumulative. Experience Graphs line up with a new publication from Berkeley's EPIC Data Lab: "Intelligence is Free, Now What? Data Systems for, of, and by Agents." This work splits the future into three: data systems for agents, of agents, and by agents.  The middle one — Data Systems Of Agents - is the substrate where swarms of agents store state, remember, coordinate, and recover from failure. This aligns almost point-for-point with the Experience Graph approach: 1. "Files are all you need" breaks at scale. Long-horizon agents don't just accumulate facts in Markdown — their search produces a reward-bearing experience graph: a causal tree of attempts, rewards, sibling comparisons, and mutable search statistics. That's a database object, not a log file. 2. Search over that graph is a database access pattern. Frontier selection is a query, cross-session reuse is vector-seeded graph traversal, training-data extraction is a materialized view, and reconstructing what an agent knew at step N is a time-travel query. 3. When the database owns the state, agents become stateless, serverless compute — crash recovery, horizontal scaling, and a training flywheel fall out as byproducts. Experience Graphs is more than a position paper. Trellis runs KernelEvolve, Meta's accelerator-kernel optimizer, where cross-session memory reaches a target speedup ~10× faster at 52% lower token cost per valid solution.  The team has already retargeted the same foundation to MTIA silicon validation by swapping only the fitness function and the skills. MTIA (Meta Training and Inference Accelerator) is Meta's homegrown silicon family designed to power the next era of AI experiences.  By Gang Liao Aditya G. Parameswaran Experience Graphs: The Data Foundation for Self-Improving Agents arxiv.org/abs/2606.29823 Intelligence is Free, Now What? Data Systems for, of, and by Agents bair.berkeley.edu/blog/2026/07/0… -- Join the Conversation Subscribe to the Year of the Graph newsletter for quarterly insights on #KnowledgeGraphs, #GraphDB, Graph #Analytics, #AI, #DataScience and #SemTech . 📧 Subscribe: yearofthegraph.xyz/newsletter  💼 Sponsorship inquiries: yearofthegraph.xyz/contact/
The Year of the Graph tweet mediaThe Year of the Graph tweet media
English
2
7
24
1.6K