Sabitlenmiş Tweet

$BTC
Projected Bottoming Structure
The $55.2k target is a structural target (minimal).
This ⬇️would actually make more sense as there really is no support at 55.2k currently. (And we never recovered the 49k wick prior to our current ATH if you remember).
This structure would serve as a deviation lower from our current range as a head structure.
My all-time high target will be above $163k if we get this.

CryptoGrim@CryptoGrim
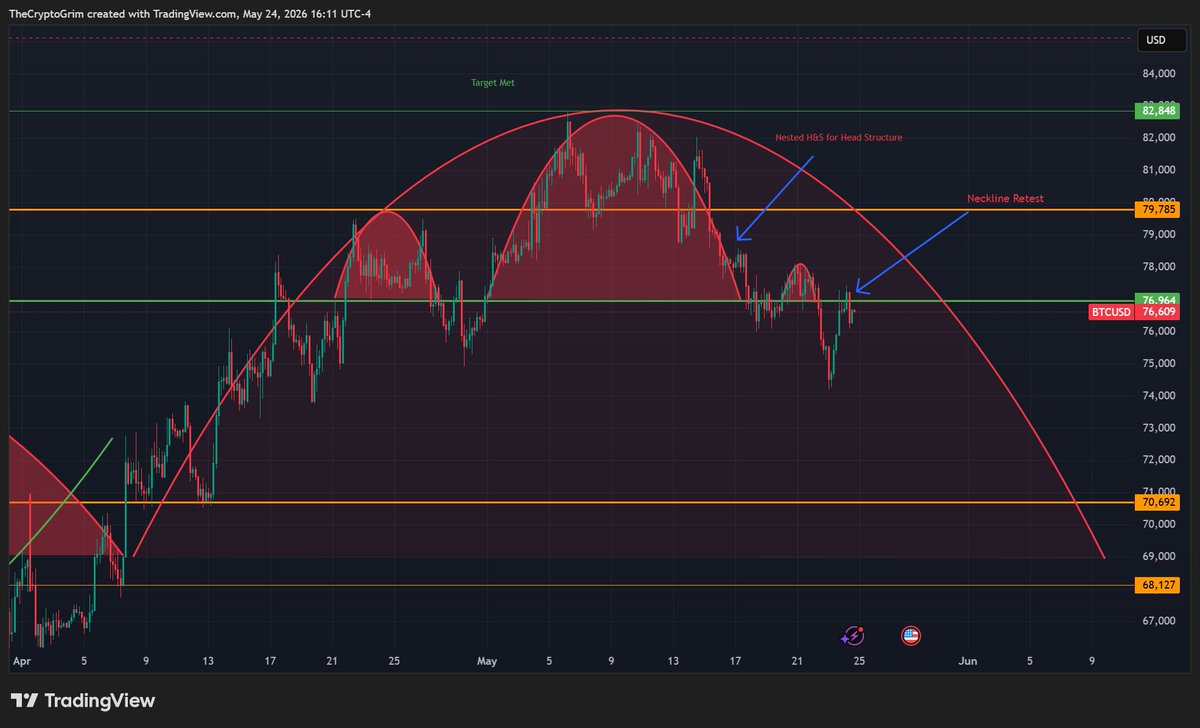
$BTC You have set a H&S ontop of the 76k green. As long as that green is 4hr continuous resistance, you are in the move. If we recover it, we can make another M structure ontop of the 76k green which allows for invalidation or just prolongs the process for the breakdown. The target is around 70.6k, but it could stretch to 66.4k if it wants to create a W structure to setup for a right shoulder. The bounce will give us the right shoulder play where 74600 will be the level as 4HR support to invalidate. If we can't get back above 74600 and later make 68127 4HR resistance, you are in target for $55.2k. Looks like it could be knife catching season next week.
English