
CryptoNation
2.5K posts

CryptoNation
@CryptonationN
The Future is Crypto | Building the strongest crypto community |
Katılım Mart 2021
466 Takip Edilen21.1K Takipçiler


🚨 BREAKING: $MSVP staking is now LIVE — and early movers could benefit big 👀
Right now, @metasoilverse is offering insanely high APY (up to 200%), and the token still looks undervalued from here 📈
From what we’ve analyzed, early stakers might unlock:
• Future airdrops 🎁
• Exclusive access 🔓
• Extra reward multipliers 💰
You can grab $MSVP on LBank, BingX, or any DEX, then stake here:
👉 staking.msvprotocol.com
Don’t sleep on early opportunities — this is where real gains are made 🚀
English
Coinbase Bitcoin Premium has almost recovered.
This is a sign that institution selling is slowing down, and could result in a relief rally.
But that doesn't mean a bull market will happen.
For that, ETFs need to bring huge inflows and that's not happening until US economy gets stronger.

English
BITCOIN SELLING IS SLOWING DOWN, BUT FEAR IS NOT AT PEAK YET.
Fewer people are taking profits right now compared to earlier weeks.
That means the big wave of selling pressure is cooling off.
But we’re still not at the stage where investors are panic selling or giving up.
In past cycles, major bottoms formed only when fear and forced selling got much worse.
So this looks more like a slowdown in selling, not a full market bottom yet.
English
Bitcoin accumulation is coming in weaker on this drop compared to past crashes.
During the first sharp leg down in Nov 2025, heavy sell pressure hit the market.
But buyers stepped in aggressively similar to the demand seen after the LUNA and FTX collapses.
That strong absorption helped stabilize price quickly.
On the recent move toward $60K, accumulation did appear but the intensity is clearly lower.
The bounce response is slower and less reactive.
This suggests dip buyers are still present...
Just not as aggressive as they were during prior panic phases.
English
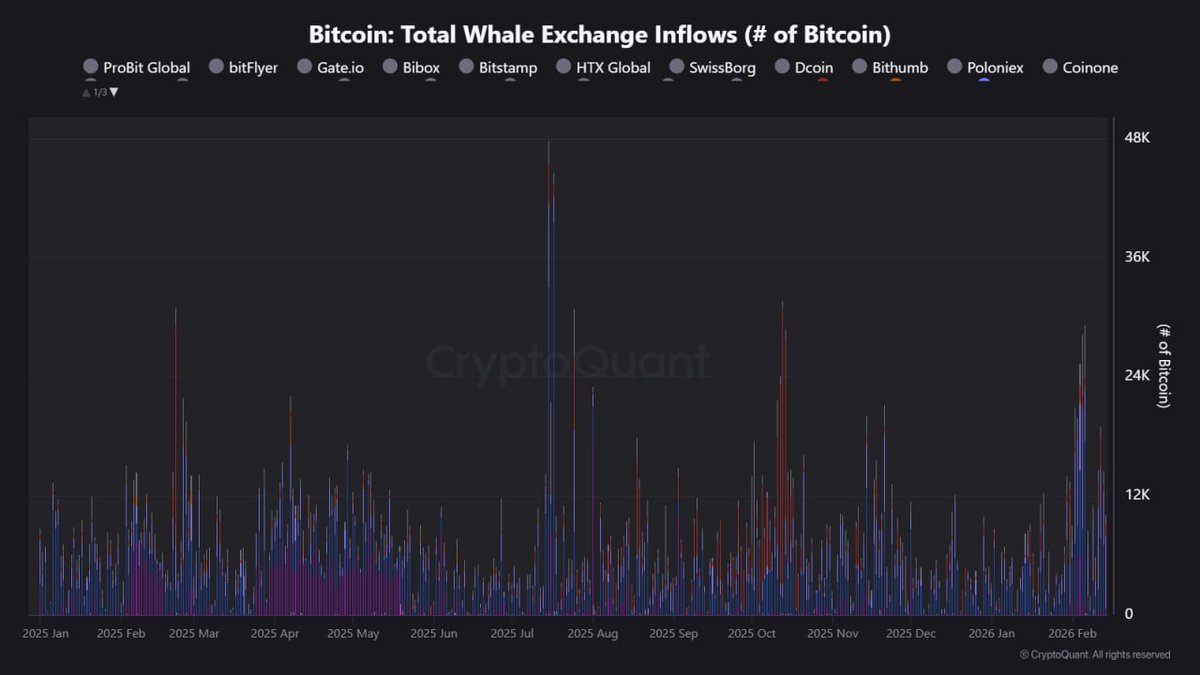
Big whales continue to sell Bitcoin.
In just 4 days, large whales have deposited 57,000 $BTC worth $4 billion to exchanges.
Until this changes, a sustained rally is difficult.
English
This is the Fed’s biggest policy risk right now.
Powell keeps repeating the same concern, inflation is still a threat and tariffs could push prices higher again.
But when you look at the actual data, the story looks very different.
The Fed only has two core mandates: unemployment and inflation. And right now, both are moving in the direction that normally justifies easing, not prolonged tight policy.
Starting with inflation, headline CPI is now around 2.4%, the lowest level since May 2025.
Core CPI is sitting near 2.5%, the lowest since early 2021, almost five years back when the economy had just started reopening from lockdowns.
So inflation is not accelerating, it is cooling steadily.
Now look at TARIFFS, which Powell has repeatedly warned could push inflation higher. Tariff revenue already peaked around September October 2025.
Monthly collections hit record highs and have declined since. Some tariffs, especially on food imports have already been rolled back, and there have been no major new tariff expansions.
Which means the tariff driven inflation impulse has likely already passed through the system.
But while inflation is cooling, the labor market is weakening.
Job growth for 2025 was revised down sharply from around 584,000 jobs added to just 181,000 for the entire year. That means average monthly job growth was roughly 15,000, the weakest non-recession hiring year since 2003.
Hiring rates are now sitting near multi-year lows, job openings have fallen significantly, and economists are already describing current conditions as a hiring recession.
A large share of job growth came from healthcare alone, meaning broader labor demand is much weaker beneath the surface.
Outside labor, other parts of the economy are also showing strain. Housing sales are sitting near 30-year lows as elevated mortgage rates continue to suppress demand.
Corporate bankruptcies have climbed to the highest levels since 2010, rising steadily every year since rate hikes began.
High borrowing costs are starting to pressure balance sheets across sectors.
Consumer stress is building as well.
Credit card debt is at record highs, delinquency rates are rising, and subprime auto loan defaults have reached the highest levels ever recorded.
Lower income households are facing the most pressure, which historically shows up late in tightening cycles.
And this brings us to the policy mistake risk.
In 2020–2021, the Fed kept QE running for too long. Even after the economy reopened, stimulus continued and liquidity stayed elevated.
Inflation eventually spiraled out of control, peaking at 9.1% in 2022, the highest in over four decades. The Fed then had to tighten aggressively, triggering a broad market crash.
The S&P fell over 25%, Bitcoin dropped more than 60%, and the total crypto market lost trillions. Powell later admitted the Fed should have ended QE earlier.
Now the risk is the mirror image.
Back then, the Fed stayed dovish too long. This time, they may be staying hawkish too long. Rates remain restrictive even as inflation cools and labor conditions weaken.
Cuts have been slow and delayed. Economists like Mohamed El-Erian have already warned the Fed may be “late again,” but in the opposite direction this cycle.
Because policy works with a lag, the danger is timing.
By the time the Fed recognizes economic damage is deep enough to require faster easing, the deterioration may already be widespread, across labor, credit, housing, and corporate balance sheets.
And recoveries from overtightening do not happen quickly. They take years, not months.
That is why this cycle matters.
Last time, the Fed reacted late to inflation. This time, the risk is reacting late to economic slowdown and markets may price that damage in before policy catches up.
English
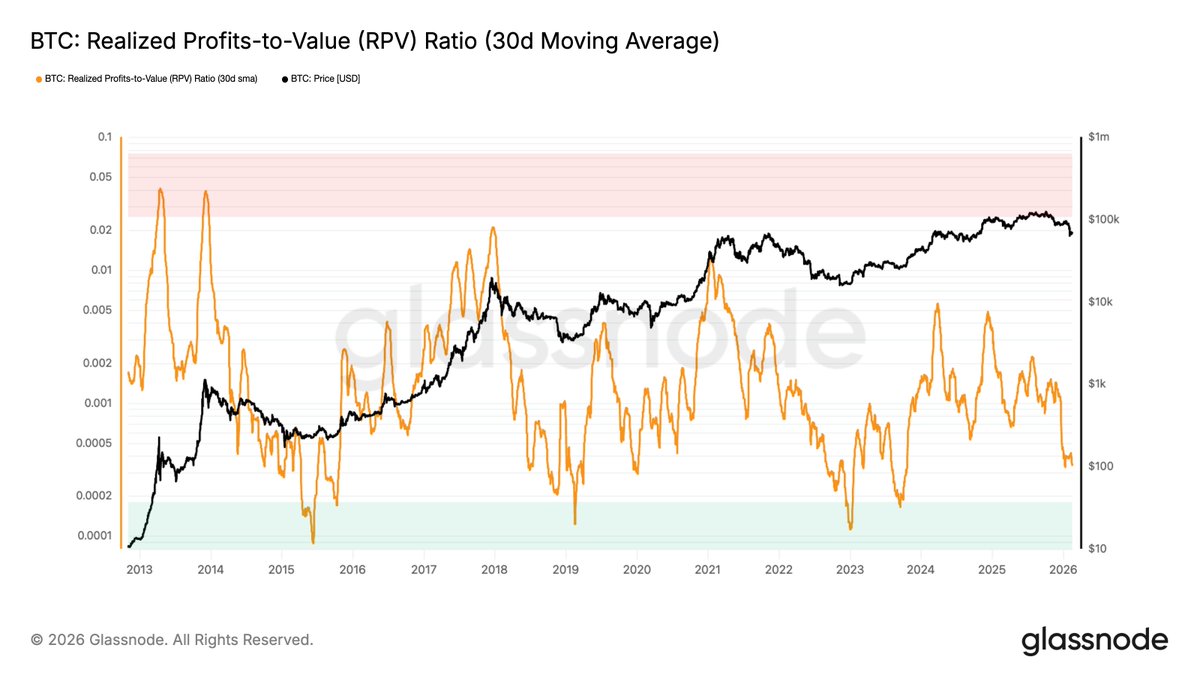
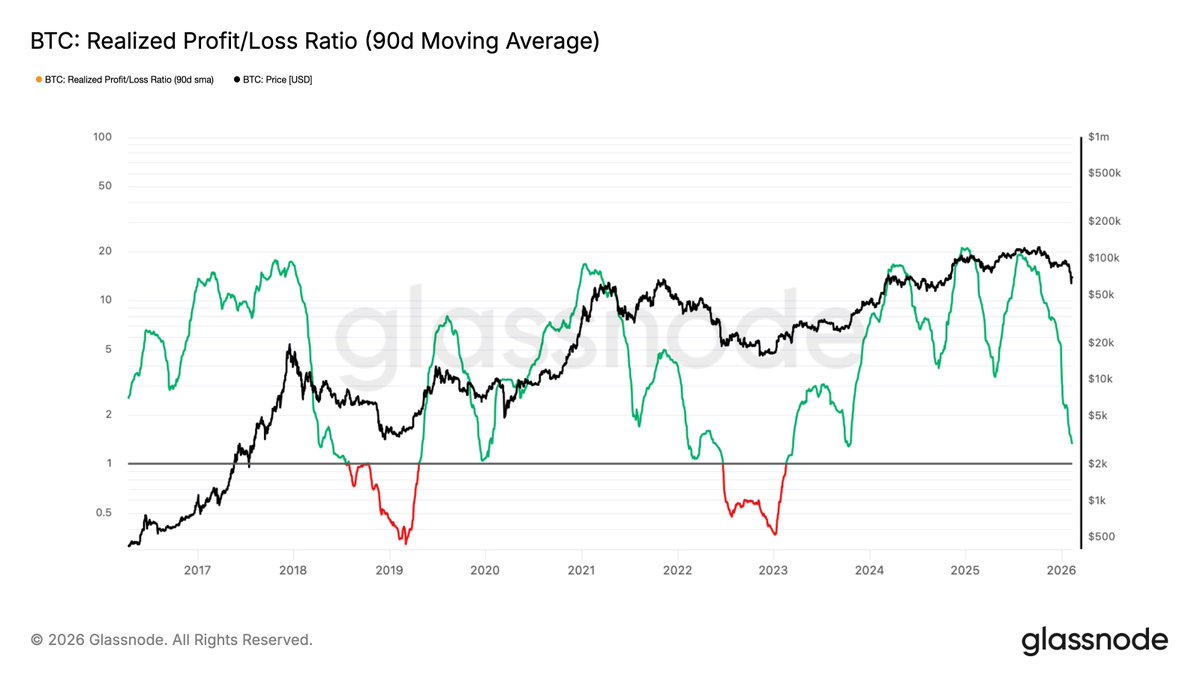
🚨 BITCOIN PROFIT SIGNAL IS COLLAPSING
The Realized Profit/Loss Ratio (90-day average) is now falling fast and sitting near 1.32, getting close to the critical level of 1.
This metric shows whether investors are taking profits or locking in losses.
Right now, the trend is clearly weakening.
When the ratio stays above 1, it means most coins moving on chain are being sold in profit.
That usually happens in strong bull phases where liquidity is flowing in and buyers absorb selling.
But when the ratio starts dropping toward 1, it shows profits are shrinking and fewer investors are able to sell at gains.
And if it breaks below 1, it means realized losses are now bigger than realized profits.
That is where market behavior changes.
Historically, sustained moves below 1 have lined up with broad capitulation phases:
• Late 2018 bear market bottom
• March 2020 crash
• 2022 cycle capitulation
In all these periods, investors were forced to sell at losses as liquidity dried up.
Looking at the current chart:
The ratio has been making lower highs since the last cycle peak.
Recent sell-offs are not being met with strong profit realization, meaning fresh demand is weak.
Instead of buyers stepping in aggressively, the market is slowly absorbing losses.
This is why the downtrend in the ratio matters more than the absolute level.
It shows momentum in profit-taking is fading.
In simple terms:
Less profit booking → weaker liquidity → higher stress on price.
If the ratio continues falling and loses the 1.0 level, it would signal a shift from distribution to capitulation conditions.
That doesn’t mark an instant bottom, but it historically signals late-stage stress where forced selling dominates.
For now, the key level to watch is clear:
As long as the ratio holds above 1 → market is under pressure but not fully capitulating.
A sustained break below → broader loss realization phase begins.
English
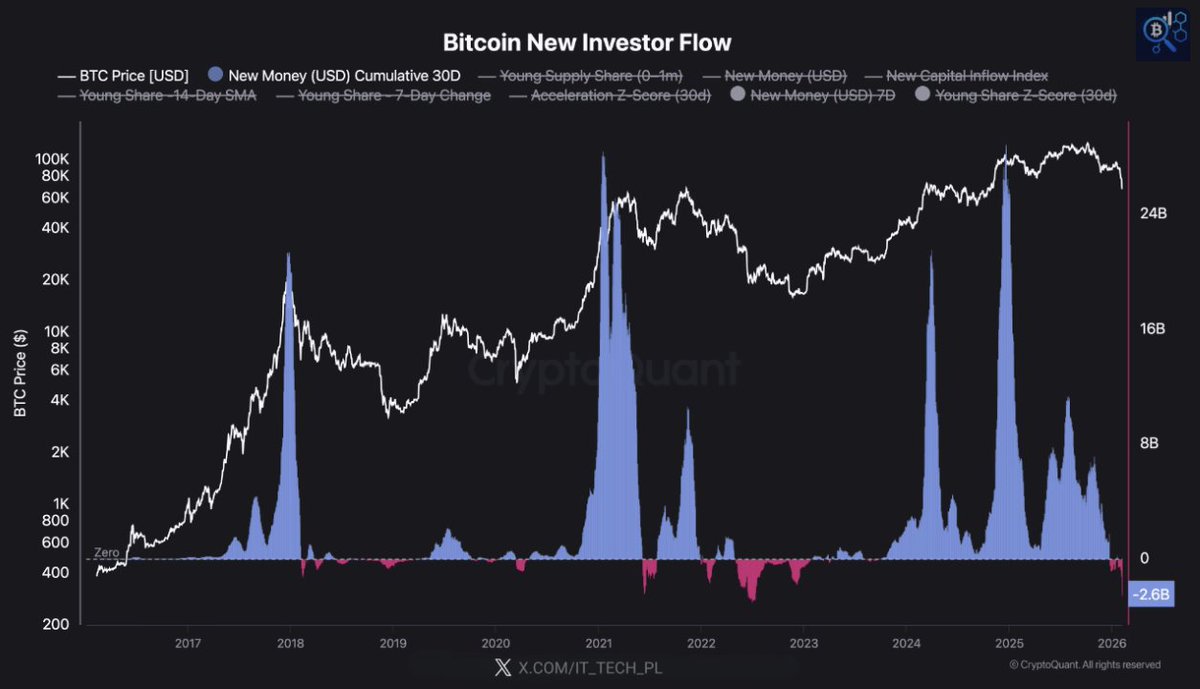
🚨 FRESH MONEY HAS STOPPED ENTERING BITCOIN
New investor inflows have now turned negative and this is one of the clearest early bear market signals. The chart shows Bitcoin new investor flow vs price across multiple cycles.
And the pattern is very consistent.
Every major bull run 2017, 2021, and 2025 was driven by aggressive new capital entering the market. You can see large blue inflow spikes during those periods.
That is fresh money absorbing sell pressure and pushing price higher. But right now, that is not happening.
Inflows have flipped negative again, shown by the red bars on the right side of the chart. This means more capital is leaving than entering.
And that changes market structure completely. In bull markets, dips get bought because new investors step in.
Fresh demand absorbs selling. That is why corrections stay shallow and price recovers quickly. But in early bear phases, the opposite happens.
When price drops, there is no new demand to catch it. Instead of buying the dip, capital pulls back.
That is exactly what this chart is showing now. You can see similar behavior in past cycle transitions:
• In early 2018, inflows turned negative right after the peak
• In mid-2021, inflows weakened before the deeper correction
• In both cases, price struggled because fresh capital disappeared
Now the same structure is forming again.
Recent sell offs are not being absorbed by new buyers.
Which means the market is relying on existing holders only.
And when existing holders sell without replacement demand, price weakens faster.
This does not automatically mean a full bear market is confirmed.
But it does signal weakening market strength.
For a strong recovery, inflows need to turn positive again.
New investors need to step back in.
Because Bitcoin bull markets are always liquidity driven.
No fresh capital = weaker dips
Accelerating capital = stronger rallies
Right now, the chart is showing withdrawal, not acceleration.
And that is why current conditions still resemble early bear market structure more than a renewed bull phase.
English
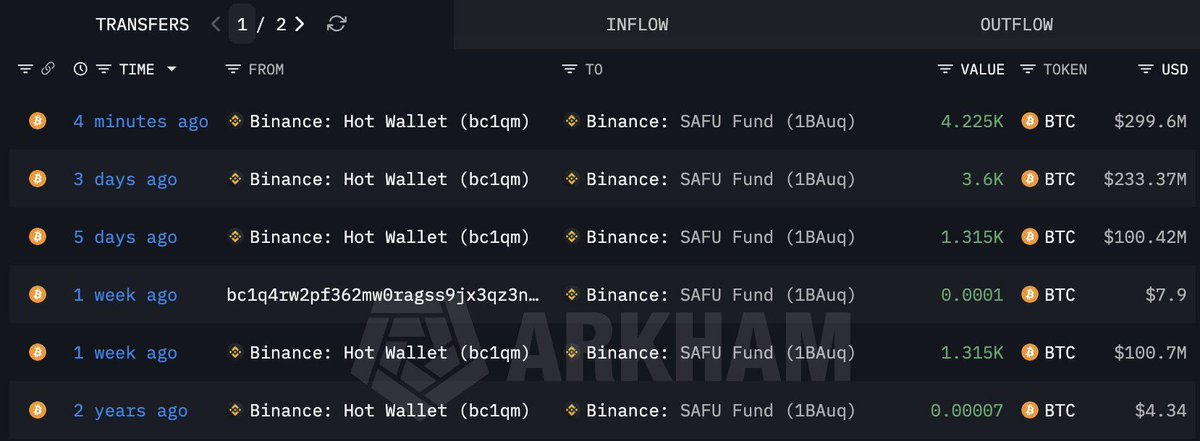
BREAKING: Binance SAFU Fund just bought another 4,225 BTC worth $299.6M.
This adds to multiple recent transfers from Binance hot wallets into the reserve.
Total Bitcoin held in the SAFU Fund now stands at 10,455 BTC.
English
$5.2 BILLION IN BITCOIN SHORTS ARE NOW AT RISK
Bitcoin’s liquidation map shows a massive cluster of short leverage building above current price.
If $BTC pushes toward the $80,000 level, more than $5.3 billion in short positions could be forced to liquidate.
This creates a potential short squeeze zone where liquidations can accelerate upside volatility.
Positioning is now heavily stacked above price, making $80K a key pressure point for bears.

English
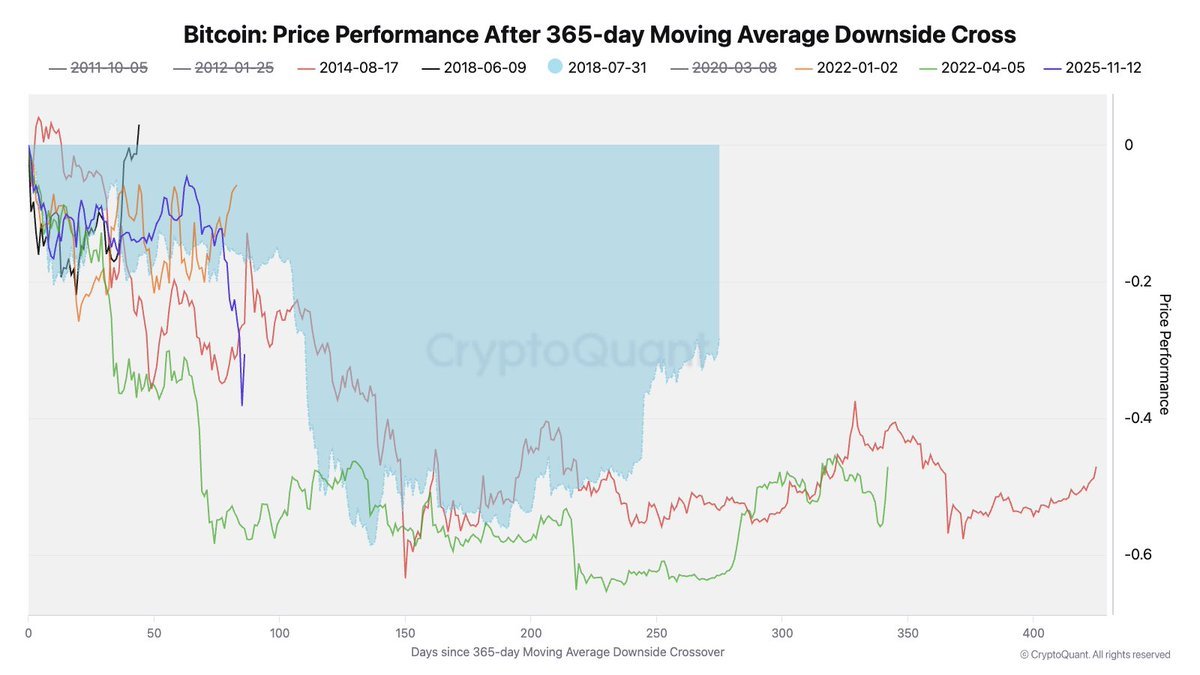
🚨 BITCOIN’S CURRENT BEAR MARKET IS NOW ONE OF THE WEAKEST IN HISTORY
If you compare Bitcoin’s current cycle with previous bear phases using one simple rule, price trading below the 365-day moving average, the data is starting to look concerning.
Right now, Bitcoin is down roughly -30% since losing the 365-day SMA.
And when you place this drawdown against similar periods from past cycles, the current decline ranks among the worst in comparable timeframes.
This metric matters because the 365-day moving average acts as a long-term trend line.
• When price trades above it → market is structurally bullish
• When price trades below it → market enters bear regime conditions
In previous cycles, once BTC lost this level, the depth and duration of downside varied depending on liquidity, demand, and macro backdrop.
For example:
In early 2022, the initial downside below the 365-day MA was relatively controlled in the first phase before accelerating later.
But in the current cycle, downside momentum picked up much faster after the breakdown.
That tells us selling pressure entered the market more aggressively this time, rather than gradually building.
Another important observation from the chart:
Most historical bear phases showed a period of sideways compression after the initial drop, a stabilization phase where long term buyers slowly absorbed supply.
In the current structure, that stabilization phase has been weaker and shorter so far.
This suggests that:
• Long-term demand is slower to step in
• Liquidity conditions are tighter
• Risk appetite across markets is weaker
It also aligns with broader macro conditions where global assets equities, metals, and crypto, have all faced synchronized pressure.
From a structural perspective, trading below the 365-day MA keeps Bitcoin in a long term corrective regime until price can reclaim and hold above it again.
That reclaim historically signals:
• Trend stabilization
• Demand returning
• Bear phase exhaustion starting
Until that happens, downside volatility and relief rallies both remain part of the same corrective structure rather than a confirmed new uptrend.
So while a -30% drawdown alone does not define the full bear market depth, relative performance versus past cycles shows this phase has started off weaker than most comparable periods.
Which makes the coming months critical in determining whether this remains a mid-cycle correction, or evolves into a deeper cycle reset.
English
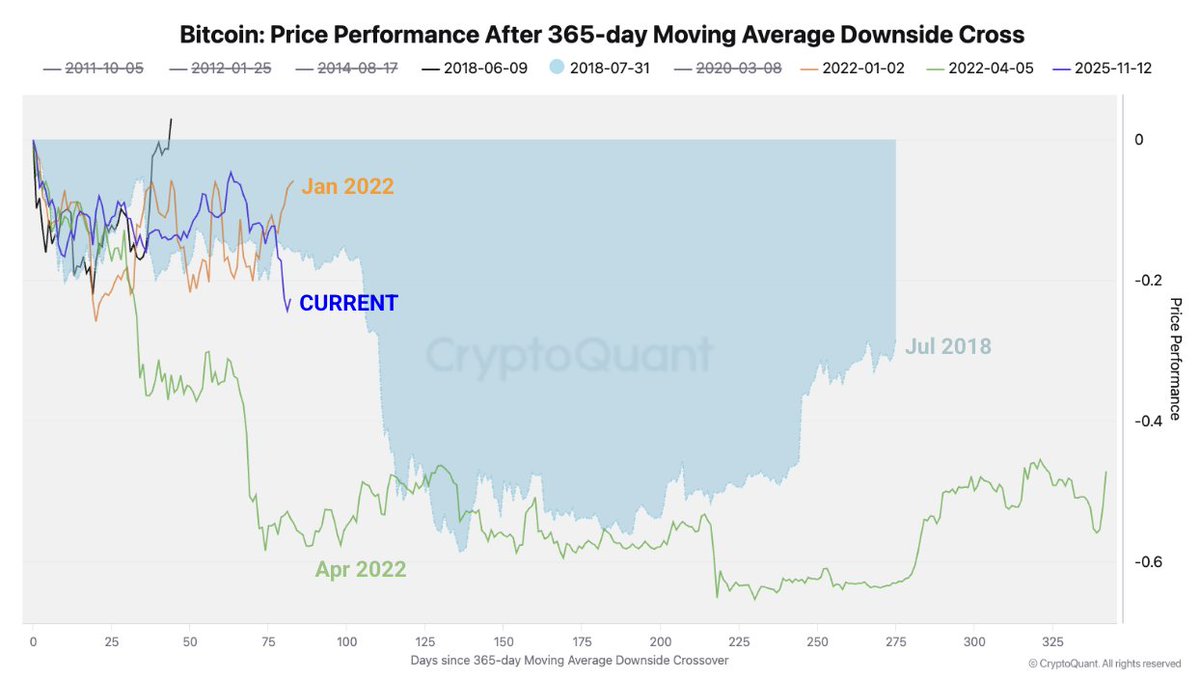
🚨 BITCOIN’S BEAR MARKET IS GETTING WEAK FASTER THAN LAST TIME
Bitcoin is not just down. It is weakening faster than it did in the 2022 bear market.
Since Bitcoin fell below its 365-day moving average on November 12, 2025, price is already down 23% in just 83 days.
In early 2022, Bitcoin was only down 6% over the same time period after losing this level.
This tells us one simple thing:
Momentum is deteriorating quicker in this cycle.
Here is what the data is showing.
First, the long term trend has officially broken.
Bitcoin has fallen below its 365-day moving average for the first time since March 2022. This level has historically separated bull markets from bear markets.
Once price loses it and stays below, the market usually enters a longer period of weakness rather than a quick dip.
Second, on-chain indicators confirm this is a bear market regime.
Bitcoin topped near $126,000 in early October when the Bull Score Index was at 80, which is clearly bullish.
After the October 10 liquidation event, that index flipped bearish and has now fallen all the way to zero, while price trades near $75,000.
This means strength has disappeared across most on chain signals, not just price.
Third, institutional demand has reversed in a big way.
At this time last year, US spot Bitcoin ETFs had bought around 46,000 BTC.
In 2026, they are net sellers, with roughly 10,600 BTC sold.
That creates a 56,000 BTC demand gap compared to last year. Instead of absorbing supply, institutions are now adding to selling pressure.
Fourth, US spot demand remains weak even after the drop.
The Coinbase Premium has stayed negative since mid-October, which shows that US investors are not stepping in aggressively. In past bull markets, strong rallies were supported by a positive premium, meaning US buyers were leading.
That support is currently missing.
Fifth, liquidity is tightening across the market.
USDT’s 60-day market cap growth has turned negative by about $133 million, the first contraction since October 2023. Stablecoin supply expansion peaked at $15.9 billion in late October 2025 and has now reversed.
At the same time, one year apparent spot demand growth has collapsed by 93%, falling from 1.1 million BTC to just 77,000 BTC. This is what liquidity contraction looks like in a bear market.
Finally, technical structure points to more downside risk.
The combination of losing the 365+day moving average, weak on-chain demand, negative ETF flows, and falling liquidity suggests Bitcoin may still search for lower support.
Based on historical behavior, the $70,000 to $60,000 range becomes a realistic downside zone if conditions do not improve.
Putting it all together, this is not just a normal pullback.
Compared to early 2022, Bitcoin’s bear market is starting weaker, faster, and with less support from institutions, US buyers, and liquidity.
That does not mean straight down every day.
But it does mean the market is operating in a clear bear market structure, and rallies should be viewed through that lens until the data changes.
English
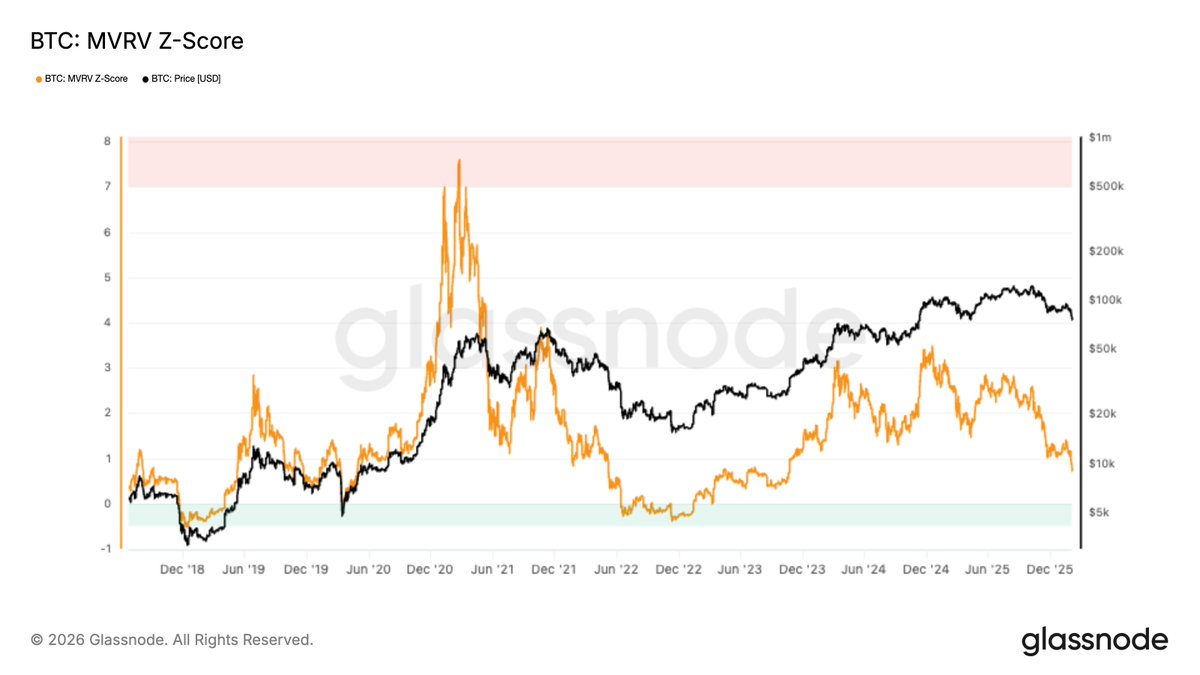
THIS BITCOIN METRIC JUST RESET TO BEAR MARKET LEVELS.
$BTC MVRV Z-Score has compressed to its lowest level since October 2022, when Bitcoin was trading near $29,000.
That period marked the end of forced selling, not the start of a new crash.
Here’s what this actually means:
MVRV Z-Score measures how far market price is from the average cost basis of all coins.
High values = overheated market.
Low values = profits flushed out.
Right now, unrealized profits across the network have been heavily reset.
Short-term holders have largely capitulated.
Excess leverage and euphoric pricing have been washed out.
This is what a return toward fair value looks like.
In past cycles, this kind of compression did not happen at market tops.
It happened after corrections, when price spent time digesting previous gains.
Notice the pattern:
• 2019 → reset → continuation
• 2020 → reset → expansion
• 2022 → reset → base formation
We are seeing the same structural reset again.
This does not mean price must go straight up.
It means the market is no longer stretched.
Risk has come down.
Profit pressure has cooled.
The system has rebalanced.
These conditions historically form before the next major directional move, not after it.
English
BREAKING: President Trump announces a major trade deal with India 🇺🇸🇮🇳
India has agreed to reduce tariffs on US goods to 0% and stop buying Russian oil.
In return, the US will cut tariffs on India from 25% to 18%.
India also committed to buying $500 BILLION worth of US energy, technology, agriculture, coal, and other products.
This is a massive shift in global trade flows, energy sourcing, and US-India economic alignment.

English
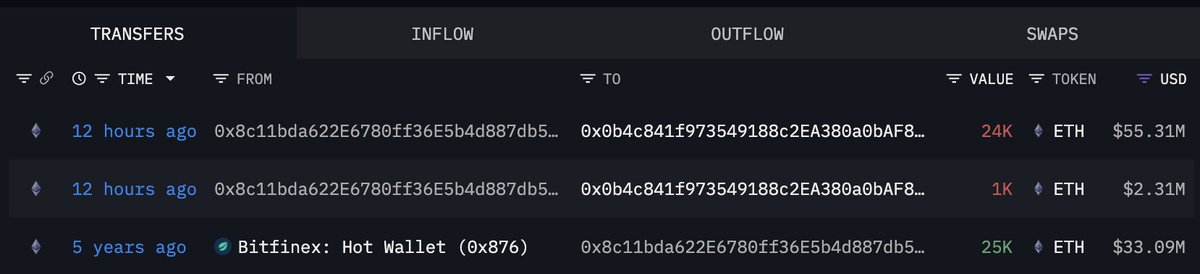
CryptoNation retweetledi

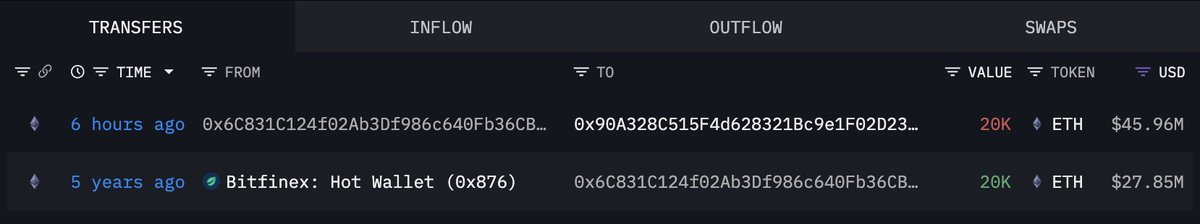
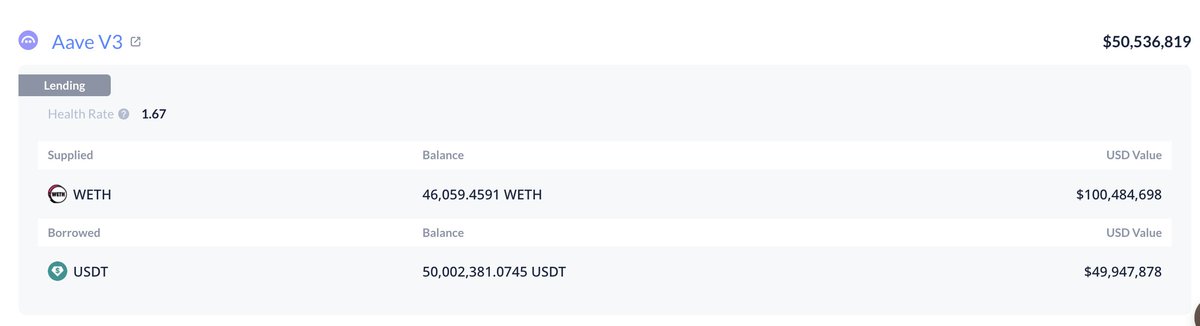
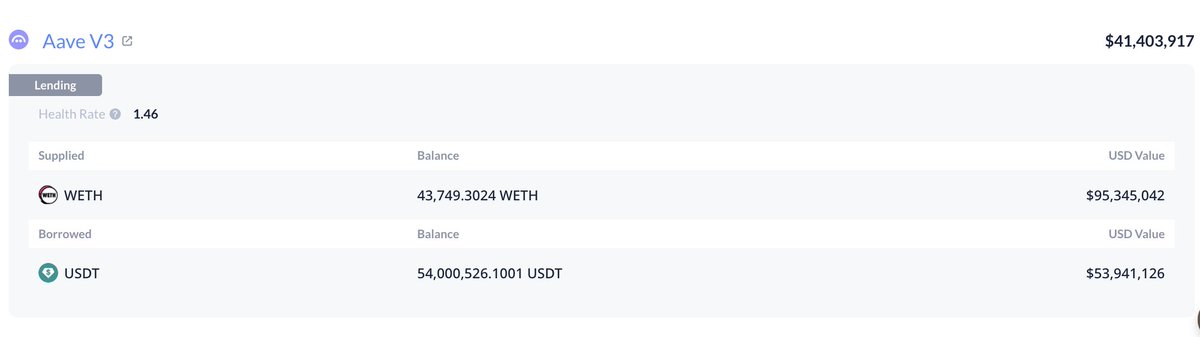
Ethereum OGs are buying $ETH using looped borrowing.
Two wallets that were dormant for 5 years deposited 44,490 $ETH($98.3M) into #Aave, then borrowed 104M $USDT to buy 45,319 $ETH at $2,295 avg.
intel.arkm.com/explorer/addre…
intel.arkm.com/explorer/addre…
English
SOMETHING IMPORTANT JUST CHANGED IN GOLD AND SILVER.
In just two days, gold fell almost 16% and silver dropped close to 39%.
This wasn’t a normal pullback. It was a sharp liquidation that damaged the price structure.
Here’s why this matters:
One major support for gold and silver was Fed uncertainty. That is now fading after Trump named Kevin Warsh as the next Fed chair. He supports rate cuts, but not aggressive liquidity that weakens the dollar.
Silver’s parabolic rally has clearly broken. In past cycles, when this happens, prices usually spend months moving sideways instead of making new highs.
Sentiment had reached extremes. Capital was rotating from other assets into gold and silver at once. That kind of crowding often appears near interim tops.
This does not mean gold and silver are finished.
But unless new uncertainty returns, the odds now favor consolidation, not new all-time highs, for some time.
The trade has shifted from momentum to patience.

English
THIS IS BULLISH
SEC Chair Paul Atkins says the time is right to allow crypto in 401(k) retirement accounts.
He said many Americans are already exposed to crypto through pension funds that are managed by professionals.
Now the focus is on giving access through 401(k)s in a “measured way,” with proper guardrails and protections.
The goal is to let people access these assets through trustees and professional management, not direct speculation.
English
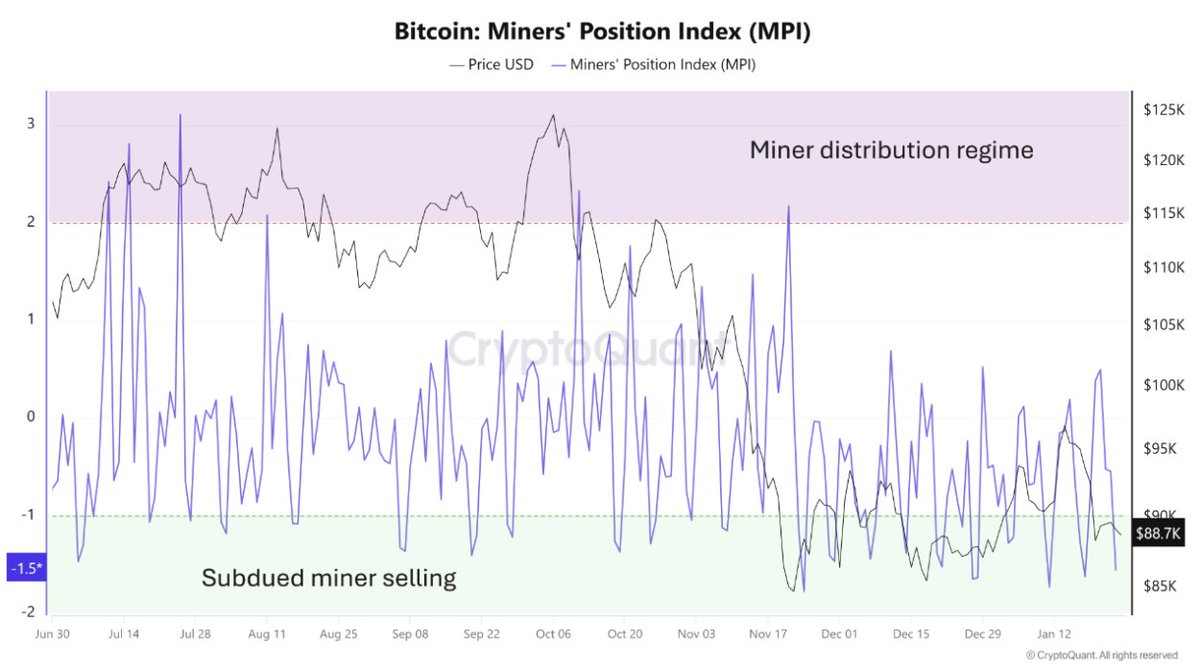
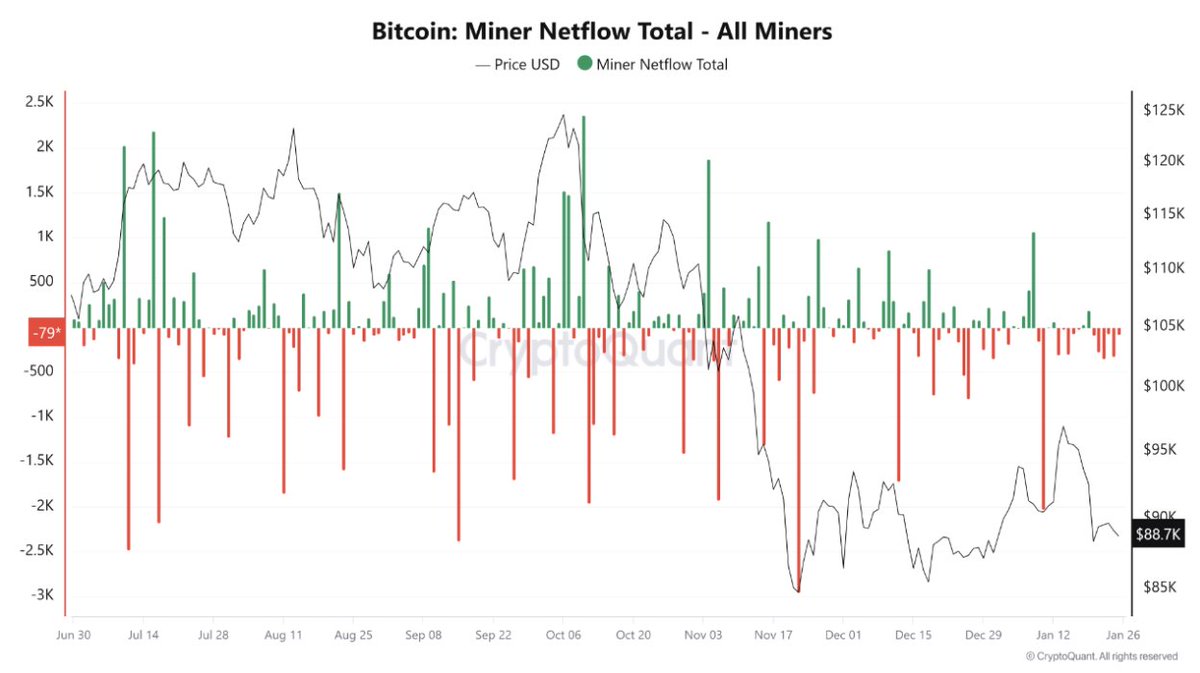
Who is actually selling into this weakness?
It’s not panic from the whole market. The data points to miners and opportunistic whales.
Look at the first chart: Miner Netflow Total.
When the bars are red, it means miners are sending more BTC to exchanges than they are receiving. That usually means selling pressure.
Recently, those red bars have been active again, especially on short rallies. That tells us miners are using small price jumps to reduce exposure and take liquidity.
Now look at the second chart: Miner Position Index (MPI).
MPI shows whether miners are distributing or holding.
When MPI is above +2, miners are aggressively selling.
When it is below -1, selling pressure is low.
Right now, MPI is in the subdued miner selling zone.
That means miners are not dumping in panic. They already reduced risk earlier.
But they are still selling selectively when price moves up.
So this is not forced selling.
This is controlled distribution.
Now combine this with what is happening in the broader market.
Exchange inventories are still very low.
That means there is not much BTC sitting on exchanges ready to be sold.
Liquidity is thin.
In thin markets, even small sellers can move price.
This is where whales come in.
Large holders who already de-risked higher are now selling into strength.
They wait for small rallies and place sell pressure where buyers appear.
That is what “opportunistic selling” looks like.
So the flow is:
1. Miners are not panicking, but they are selling on bounces.
2. Whales are using low liquidity to distribute slowly.
3. The broader market is not aggressively selling. It is absorbing.
This is why price feels heavy on rallies but does not collapse.
It is not fear selling.
It is positioning.
This structure usually means:
Smart money is rotating risk, not running from the market.
Supply is being transferred from early holders to stronger hands.
The market is building a base, not breaking.
If this was full capitulation:
MPI would spike hard upward.
Miner netflows would show massive continuous red.
Exchange balances would rise sharply.
That is not happening.
Right now, the selling is: Previously de risked miners and opportunistic whales selling into rallies against lean exchange inventories.
In simple terms: They are using strength to sell. Not weakness to panic.
That is a very different signal.
English
The market is sensing something big is coming.
And it could be bigger than the October 10th crash.
That’s exactly why money is shifting into risk-off mode.
Safe assets are flying.
Risk assets are barely moving.
Gold and silver are pumping hard, while BTC and ETH are struggling to gain momentum.
YTD performance:
• Gold: +15%
• Silver: +42%
• Bitcoin: −0.5%
• Ethereum: −5.5%
That tells you everything.
Right now capital isn’t chasing hype. It’s hiding in safety.
With Trump recently threatening Canada with imposing a 100% tariff and now the odds of another U.S. government shutdown by Jan 31 hitting 78%, a lot of uncertainty is dominating the market.
When money runs into metals and ignores crypto, it’s a clear sign:
fear is in control of the market.

English