DRS133

138 posts

DRS133 banner
DRS133

DRS133

@DRS133Crypto

Crypto analyst & swing trader Focused on technicals + eclipse cycle timing Tracking: $XRP / $XLM / $XDC / $XCN / $SHX / $VELO / $TEL Not Financial Advice

Katılım Ocak 2021
2.2K Takip Edilen378 Takipçiler
Sabitlenmiş Tweet
DRS133
DRS133@DRS133Crypto·
1/ 🌕 looks like the Eclipse Theory for #BTC is playing out in real time. Huge shoutout to @WatersAbve and @ChartingGuy — your work on these cycles inspired my own analysis, it’s been a game changer! Following the low on Feb 6th, the most recent Lunar Eclipse on March 3 was key. Historically, this phase marks a major bottom. 2/ At the end of every Lunar cycle, a bottom forms — and bullish momentum takes over. We’ve seen it repeatedly: once the cycle concludes, BTC finds support and begins its climb. We’re in that window right now. 3/ This momentum typically carries strong through until the start of the next Solar cycle. The next Solar cycle begins with the Total Solar Eclipse on August 12, 2026. That gives us a clear runway of bullish energy heading into summer and beyond. 4/ Translation: We’re in the sweet spot. Post-Luna bottom → pre-Solar acceleration. The stars (and the charts) are aligning for a strong move higher as we head toward summer. I’ll be sharing more historical overlays + current chart analysis in the coming days. The setup is bullish! 📈
English
0
0
7
781
DRS133
DRS133@DRS133Crypto·
$BTC Eclipse Cycle Theory (inspired by @WatersAbve) My bull target for mid-Aug 2026: $110,000 – $130,000 Why? Look at the last 3 post-Lunar low → pre-Solar Eclipse windows: 2015: $232 → $412 (+78%) 2019: (short cycle): $3,528 → $10,817 (+207%) 2022: $18,537 → $28,223 (+52%) Average historical gain: ~+112% We are currently in this exact window heading into the mid-August 2026 Solar Eclipse. I’m actively positioned for this move. The pattern has repeated reliably. Not many people are talking about this framework right now, but it’s one I personally follow and believe in. Of course the past doesn’t guarantee the future — but this is the thesis I’m backing. Invalidation: Sustained breakdown below $65k. Not financial advice. Manage your risk. This is my framework — what’s yours? 🌑📈
DRS133 tweet media
English
0
0
1
55
DRS133
DRS133@DRS133Crypto·
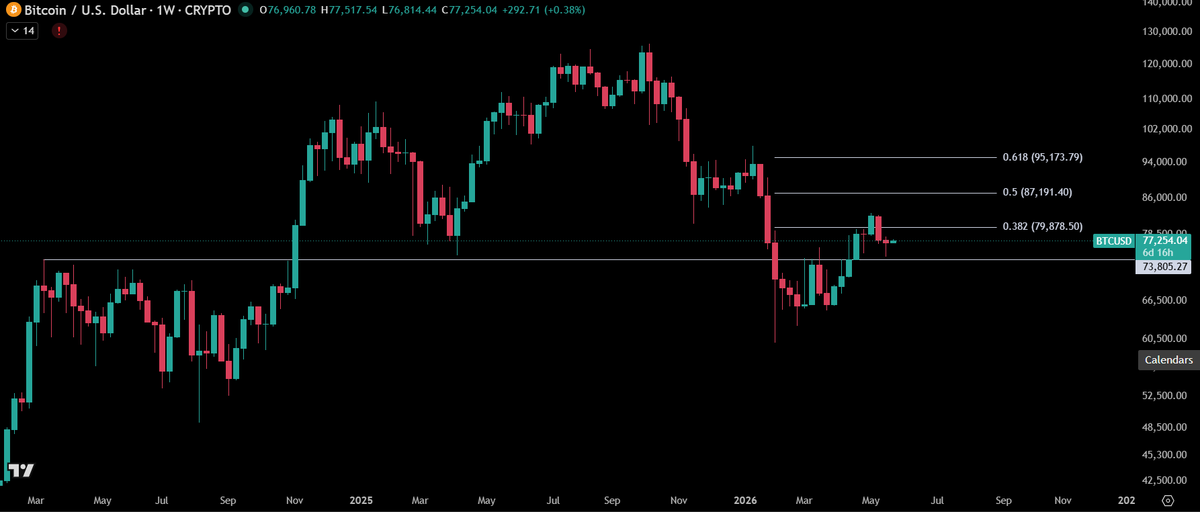
$BTC weekly structure looking positive. Price has successfully turned previous resistance (March 2024 highs) back into support — a key development on the higher timeframe. Next upside targets if momentum continues: 0.382 Fib - $79,800 0.5 Fib - $87,200 0.618 Fib - $95,200 We’re currently in the post-Lunar Eclipse window. Holding this key support zone through the Full Moon on May 31st would be a positive sign for continuation into the broader pre-Solar Eclipse bullish phase (until mid-August 2026). This aligns with the bounces I’m seeing in several alts as we build toward June. Not financial advice — always DYOR and manage your risk. What are your key levels on $BTC right now?
DRS133 tweet media
English
0
0
0
47
DRS133
DRS133@DRS133Crypto·
$VELO showing signs of bottoming IMO with a potential double bottom structure. Price has defended the $0.0033–$0.0035 zone again and is now pushing higher, looking to test the 200 SMA as first key resistance. Key levels to watch: Resistance: 200 SMA ($0.0048) → then long-term descending resistance ($0.0072) Invalidation: Breakdown below $0.0033 (double bottom support) This adds to the constructive price action I’m seeing across several alts — building bases after the recent Lunar period as we move toward the May31st full moon and the broader pre-Solar Eclipse window (until mid-August 2026). Watching for volume confirmation on a break above the 200 SMA. Not financial advice — always manage risk. What are your levels on $VELO?
DRS133 tweet media
English
0
3
14
759
DRS133
DRS133@DRS133Crypto·
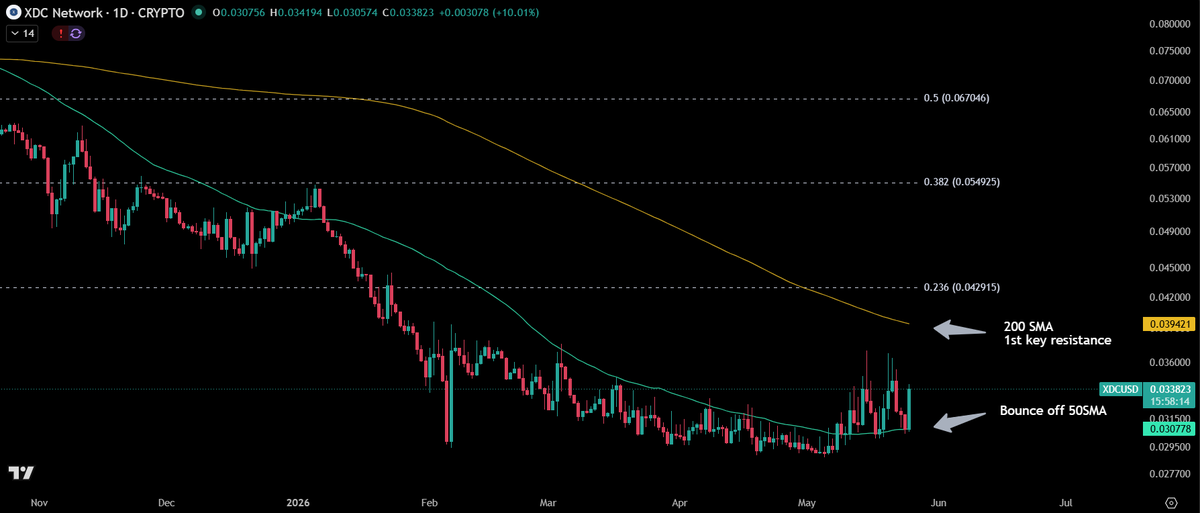
$XDC bouncing nicely off the 50SMA this morning (+10%). Price looking to test the 200SMA as first meaningful resistance. Key levels to watch: Resistance: 200 SMA ($0.0394) → then 0.236 Fib ($0.043) Invalidation: Loss of $0.029 – $0.030 support zone This fits the pattern I’m watching across several alts — relief bounces developing after the recent Lunar period, as we head toward the May 31st full moon window and into the broader pre-Solar Eclipse bullish phase (until mid-Aug). Watching for follow-through volume. Not financial advice — manage risk. What are you seeing on $XDC?
DRS133 tweet media
English
1
0
6
267
DRS133
DRS133@DRS133Crypto·
Time to stop staring at the charts... Touch some grass and wait for the notifications 😂 See you on the other side. 🌿📱
DRS133 tweet media
English
0
0
0
43
DRS133
DRS133@DRS133Crypto·
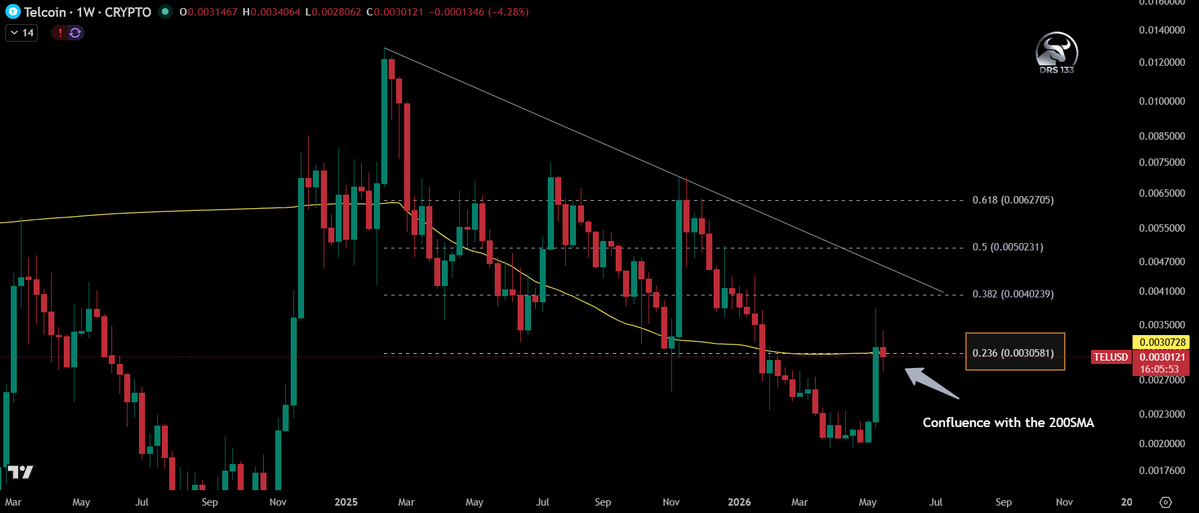
$TEL weekly view: While short-term price action remains choppy, it's important to zoom out and look at the bigger picture. The more important development I’m watching is a weekly close above the macro 0.236 Fib (~$0.00305). This level also has strong confluence with the weekly 200SMA. A convincing close above here would be a solid higher-timeframe bullish signal and help confirm we’re breaking out of the recent consolidation phase. Still patient 📈
DRS133 tweet media
English
1
5
46
1.8K
DRS133
DRS133@DRS133Crypto·
$TEL update: So we had a fakeout to the upside on Friday and then downside on Saturday, but we held for a solid daily close above the 0.382 Fib ($0.00294). First clear step forward after the recent chop. Right now the next meaningful move feels heavily tied to US-Iran news flow: Confirmed deal/ceasefire → risk-on, pushing TEL higher, start to look towards the long term resistance at $0.0045 No deal or escalation → more chop or retest of $0.0027 / $0.0025 We’re essentially waiting on a catalyst. Still holding through the chop and watching how price reacts to the headlines. All eyes on the weekly close 📈
DRS133 tweet media
English
0
6
48
1.7K
DRS133 retweetledi
Onyx
Onyx@Onyx·
Burn it 🔥 $XCN 👇 #deflationary-model" target="_blank" rel="nofollow noopener">docs.goliath.net/tokenomics/xcn…
Onyx tweet media
English
19
47
249
12.4K
DRS133
DRS133@DRS133Crypto·
chain-2:native Outlook & My Approach This Cycle: I believe we’re in a favourable window after the lows in Feb 2026. The post-Lunar bottom and pre-Solar acceleration until mid-August may well provide a bullish runway with strong momentum and big swings in select alts. chain-2:native is one I’m actively invested in and I will apply this strategy on the other tokens in my portfolio chain-2:native xdce-crowd-sale:native $SHX telcoin:native $VELO ripple:native stellar:native Macro Fib Ext Targets (from major high to cycle low): Primary Targets: 0.618 → $0.019 0.786 → $0.029 1.0 → $0.049 (Jan 2025 high) Stretched Targets: 1.272 → $0.096 1.414 → $0.137 1.618 → $0.228 My Swing Trading Plan: I’ll monitor the RSI, MACD, and Stoch RSI on daily/weekly timeframes for exhaustion signals. I plan to take partial profits at key levels to lock in gains, especially knowing how aggressively XCN can pump and then bleed. On 30-40% pullbacks I’ll look for re-entry opportunities. If momentum keeps running, I’ll rotate profits into lagging assets or simply stack stables for post-August setups. This disciplined approach will help me participate in the upside while reducing the risk of round-tripping — a hard lesson from previous cycles. These are potential zones only, not predictions. A lot needs to happen first (catalyst? / structure shift + breakout). Excited for the next few months, but staying disciplined. What’s your plan when things start moving? 📈
DRS133 tweet media
English
0
0
2
88
DRS133
DRS133@DRS133Crypto·
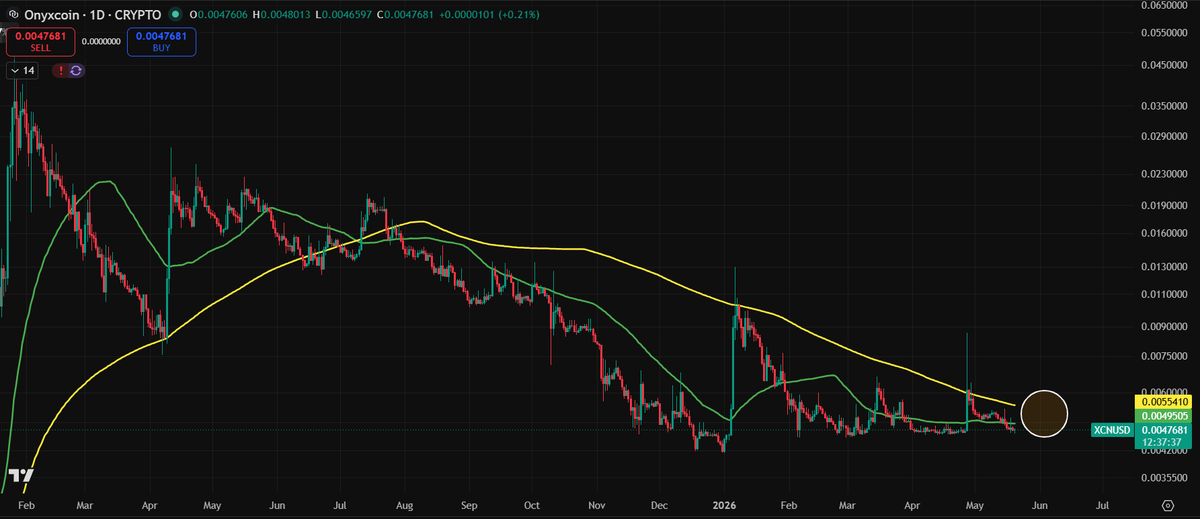
$XCN technical update: Potential pre-Golden Cross setup forming as the moving averages start to align. The immediate hurdle is clearing the 0.236 Fib (~$0.0074), which has strong confluence with the long-term descending resistance. A decisive break above this level would be the real trigger for the next leg higher. Watching closely. 📈
DRS133 tweet media
English
0
0
7
508
DRS133
DRS133@DRS133Crypto·
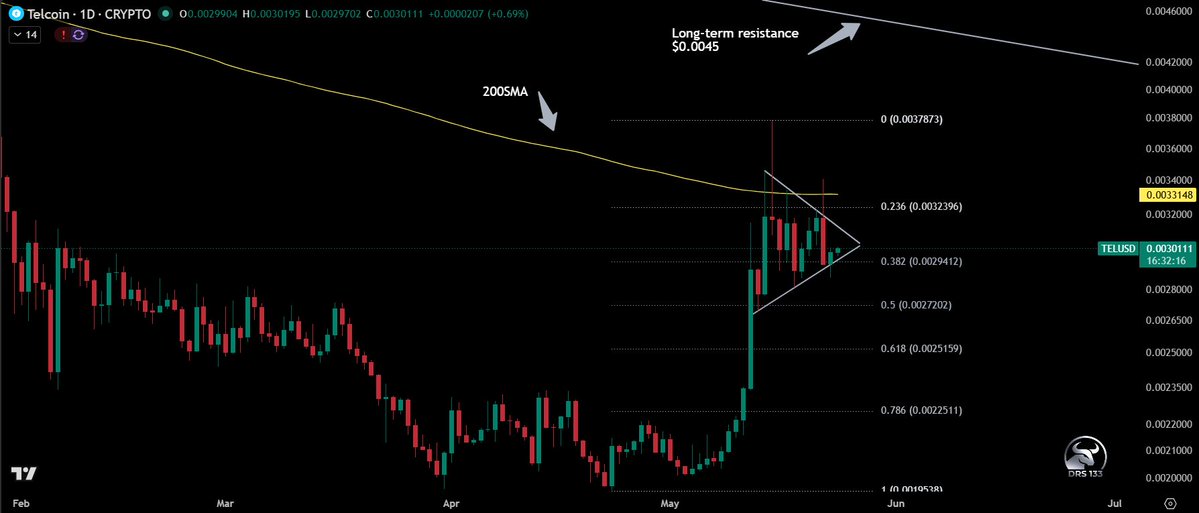
$TEL update: Price tried to break out of the triangle but was rejected and has pulled back inside the structure. We’re still in consolidation mode. For a bullish continuation, we want to see a convincing breakout above the 0.236 Fib (~$0.00323) and ideally a close above the daily 200SMA (~$0.00331) with decent volume. If we clear that zone, the next major resistance sits around $0.0045 (long-term descending resistance in play since Feb 2025). Still watching patiently. #TEL #Telcoin #Crypto
DRS133 tweet media
English
3
14
90
3.2K
DRS133
DRS133@DRS133Crypto·
Not financial advice — it really depends on your risk appetite. I’m personally holding through this chop and watching the structure. Key levels for me: holding the 0.382 Fib at $0.00293 keeps the bullish fractal intact. A break below that and I’d reassess. Therefore: 1) You can wait for confirmation (e.g. a strong close above the 0.236 Fib at $0.00323, and for extra validation closing above the daily 200SMA which sits at $0.00331). This lowers your risk but you might miss some of the early gains if it breaks out quickly. 2) Buying now increases the risk (we’re still in consolidation and could see more chop or a dip, and as you state in your comment, bad news, or BTC dropping can impact quickly). This also increases the potential reward however, should the pattern play out to the upside.
English
1
0
0
75
DRS133
DRS133@DRS133Crypto·
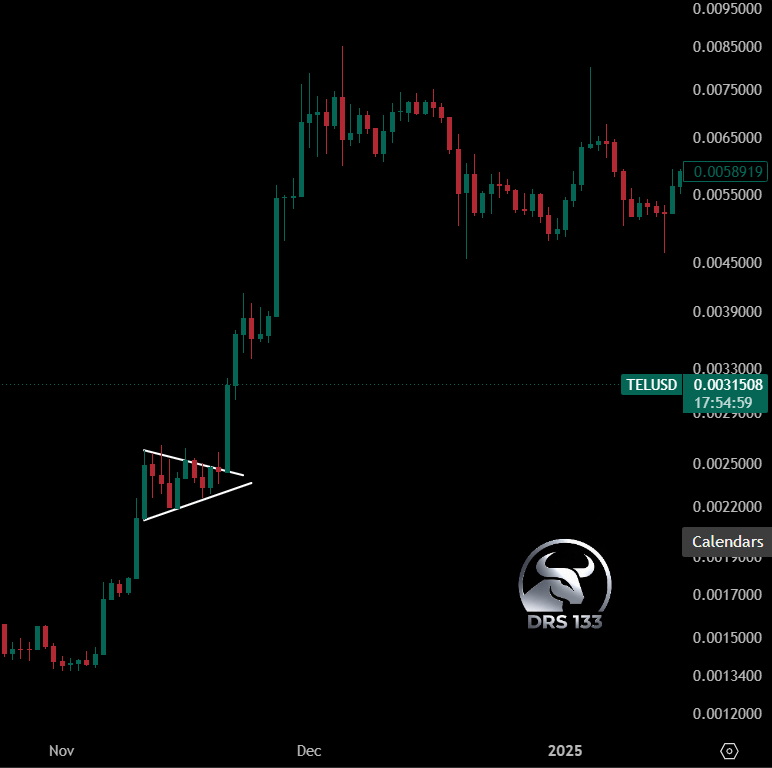
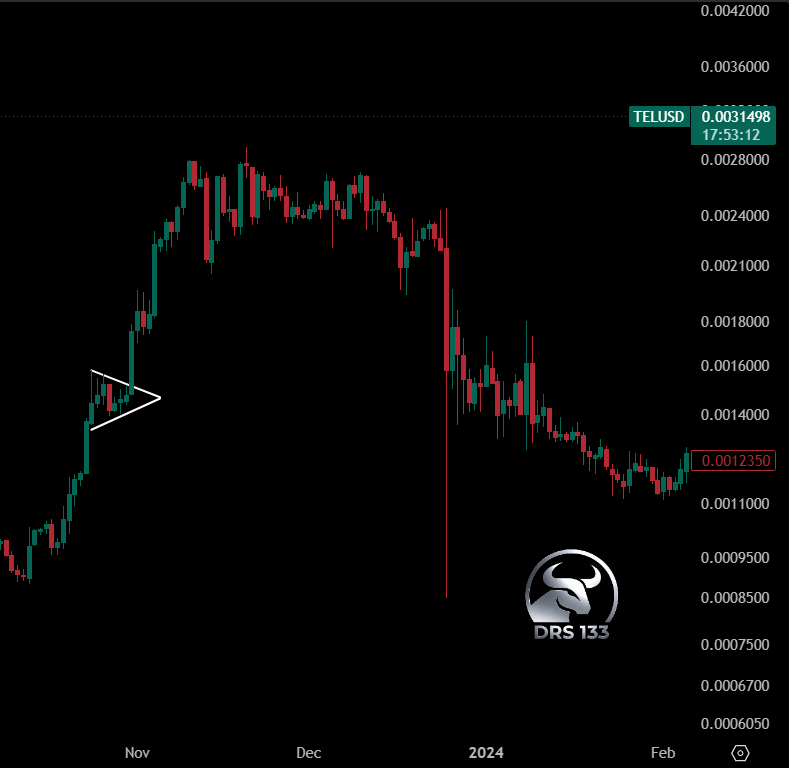
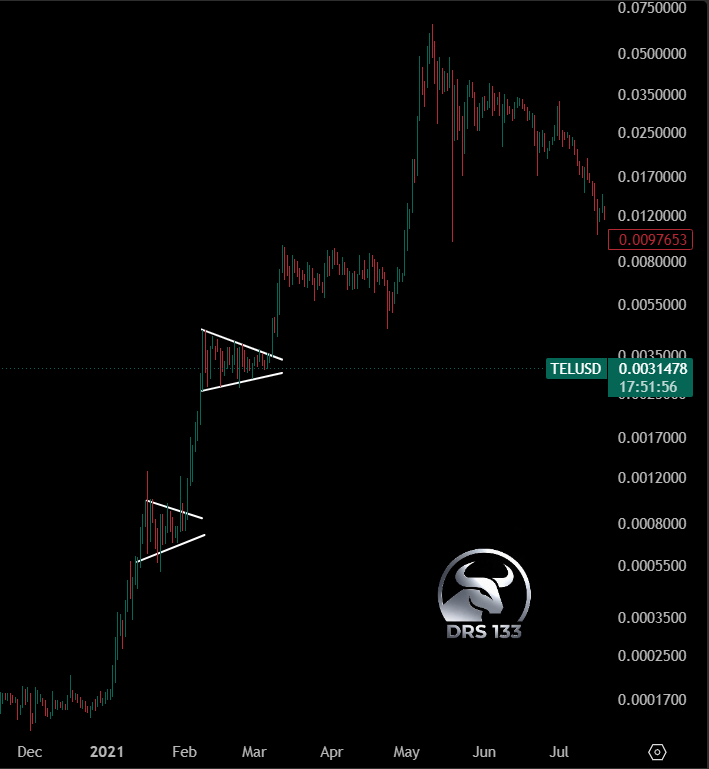
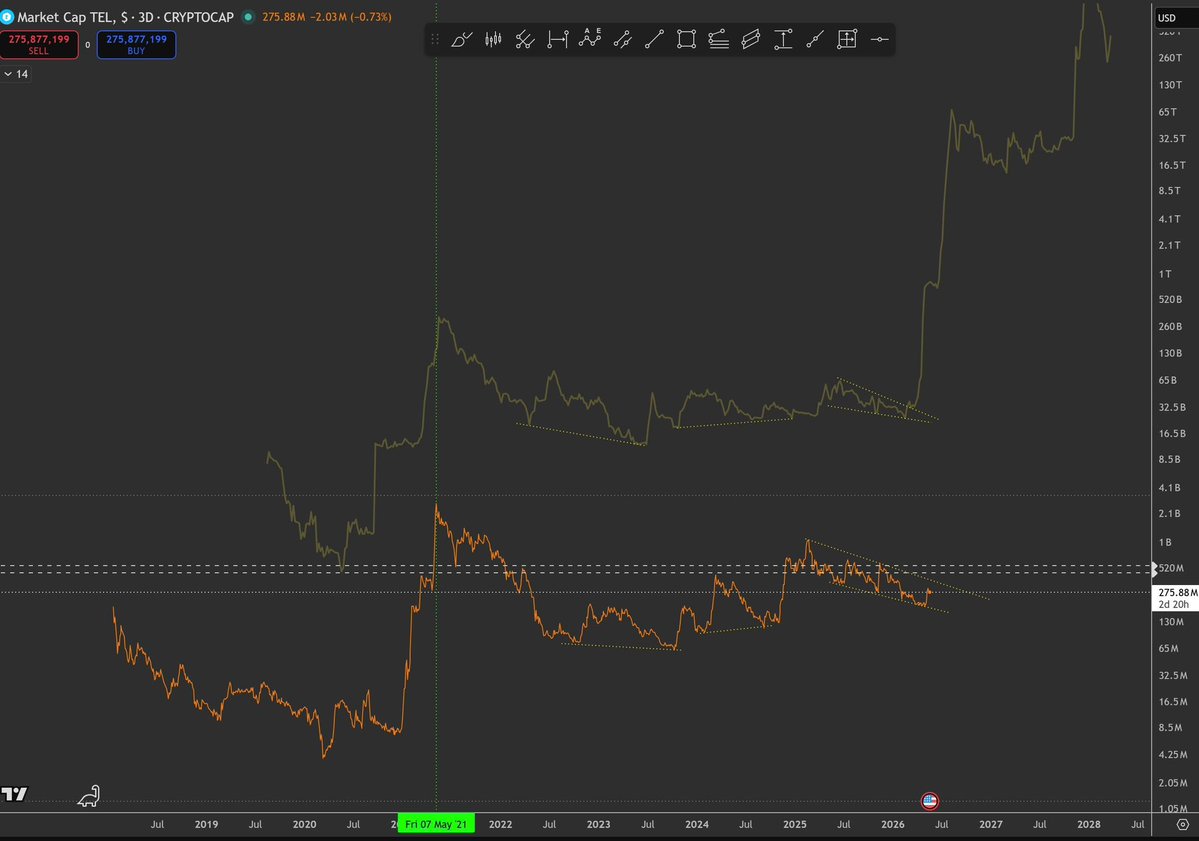
$TEL price behaviour update: The consolidation phase continues — exactly the kind of chop we’ve been expecting after an impulsive leg. Price behaviour has followed a similar pattern in 2024, 2023 and 2021. So far the fractal is holding up well. We’re still inside the triangle and the range is being respected. The May 31st Full Moon window (± a few days) is nearly upon us. All eyes on what $BTC does between now and then. Patience required here. Chart-led as always. 📈
DRS133 tweet mediaDRS133 tweet mediaDRS133 tweet mediaDRS133 tweet media
English
10
32
161
2.7K
DRS133
DRS133@DRS133Crypto·
$BTC 3D structure check: Still respecting the ascending trendline from the lows with higher lows intact. As long as we hold above the trendline + 0.382 Fib, my bias remains bullish toward a retest of $82k–$83k+. Key invalidation zone: A decisive break and close below the 0.382 Fib (~$73.2k) would increase the risk of breaking structure and shift the bias lower. Deeper invalidation sits at the 0.618 Fib (~$67.8k). What are you seeing on BTC right now?
DRS133 tweet media
English
0
0
0
70
DRS133
DRS133@DRS133Crypto·
Additional chart for context: Price continues to hold the 0.888 Fib level — strong support since the February lows, defence of this zone is encouraging.
DRS133 tweet media
English
0
0
1
78
DRS133
DRS133@DRS133Crypto·
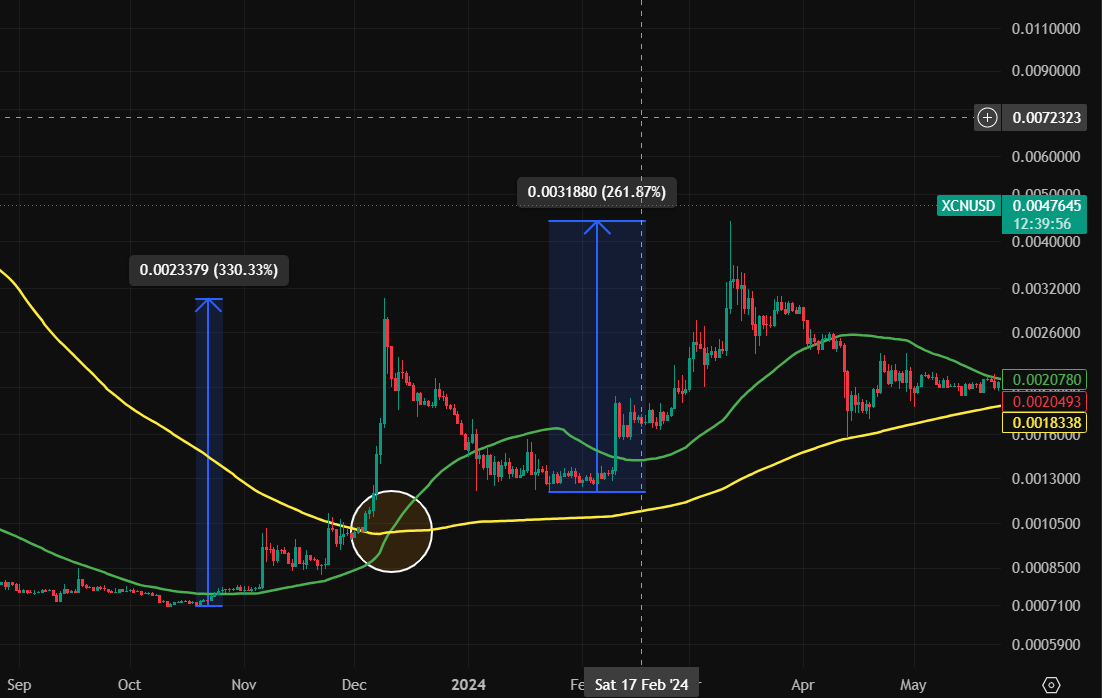
$XCN macro update (the pre- Golden Cross move): Here’s how similar setups have played out in the past: Nov / Dec 2023 → Held support after long term bearish trend → strong impulsive move higher (over 300% just before GC occurred) → 2nd peak 94 days later Nov / Dec 2024 → Similar low + reaction → another major leg up (over 260%, peaking a couple of days after the GC) → Huge catalyst to drive 2nd peak 53 days later (something we didn't have in 2023) Now (2026) → Could we be seeing the same technical behaviour? Price holding key support after a prolonged downtrend, awaiting the move higher ahead of the 50/200 SMA Golden Cross? Still early and speculative, but the structure is lining up once again in the post-Lunar window. As someone who has been accumulating at these lows and holding through the chop, I’m watching closely for that decisive break higher. 📈 #XCN #Onyxcoin #Crypto
DRS133 tweet mediaDRS133 tweet mediaDRS133 tweet media
English
1
0
6
568
DRS133
DRS133@DRS133Crypto·
$XDC update: Looking strong today with a solid green candle on the weekly. Zooming out, there’s still plenty of work ahead: - First resistance around $0.043 (0.236 Fib) - Then the 200SMA near $0.0475 - The major resistance zone at $0.055, where the macro descending trendline and 50SMA converge A clean break and hold above the descending resistance would be a big step forward and open the door to challenging those higher Fib levels toward the January 2025 highs. If we fail to break through soon, we could see continued chop inside the wedge while we wait for a broader market catalyst. Still early in the potential reversal, but the structure is improving. Watching how we handle these overhead levels. 📈 #XDC #Crypto
DRS133 tweet media
English
0
1
3
473
DRS133
DRS133@DRS133Crypto·
$XDC update: Price is breaking above the long-term descending resistance after last week's failed move — Success this week would mean a clear bullish structure shift. We don’t have a major market catalyst in play right now, but technical breakouts like this can still drive meaningful moves on their own (we’ve seen it before in alts). Next step is holding above the broken trendline and building higher lows. Still early, but the weekly picture is looking stronger. Watching for follow-through 📈 #XDC #Crypto
DRS133 tweet media
English
0
7
18
958
DRS133
DRS133@DRS133Crypto·
@Zap_oracal Appreciate the chart, thanks for sharing.....Yes, I've been looking at that long-term resistance overhead. We’d need roughly a 60-70% move from current levels just to test that zone. Still has work to do, let's see if we get the next leg higher after this period of consolidation.
English
0
0
1
23
DRS133
DRS133@DRS133Crypto·
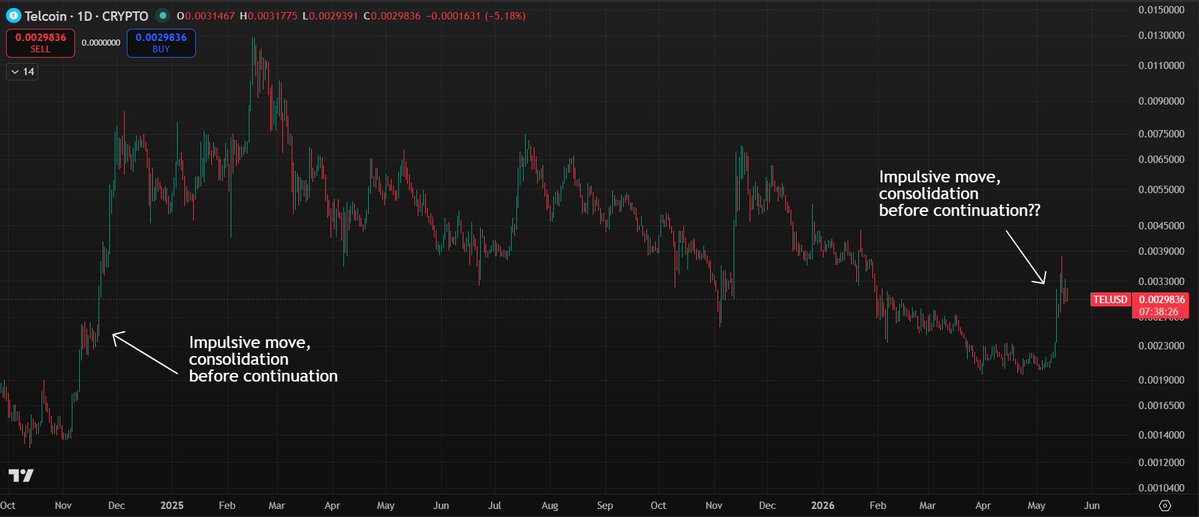
$TEL price behaviour observation: Looking at the longer-term structure, we’re seeing the start of a similar pattern to previous moves — a strong impulsive move followed by a short period of consolidation. In the prior instance back in November 2024, price consolidated for 9-10 days before the next leg higher. Other similar moves can be found in October 2023 and February 2024. We appear to be in a comparable consolidation phase now after the recent pump. Key context: This next move remains somewhat dependent on BTC holding key support. If Bitcoin holds the line, it should help TEL maintain a relatively shallow retracement. A break below $0.0027 would shift the structure more bearish for me, and prompt a reassessment. Still early. Watching how this consolidation resolves. 📈 #TEL #Telcoin #Crypto
DRS133 tweet media
English
5
3
58
2.5K
DRS133
DRS133@DRS133Crypto·
Thanks mate, appreciated. I actually held through this recent pump. I was leaning toward this being a more shallow correction so I’m riding this one. If we do break down then $0.0027 and $0.0025 would be the key levels to watch for entry if you’re accumulating. I’ll be watching for the impulsive leg higher, then looking for signs of exhaustion — particularly RSI divergence or clear loss of momentum on the higher timeframes. I’ll let the chart show me when the move is tiring. If we get another strong push I’ll share my thought process as it develops.
English
0
0
0
20
AussiEx.au
AussiEx.au@aussiExau·
@DRS133Crypto Nice breakdown, spot on mate. Feels like TEL’s repeating that impulsive push then about 9 to 10 days of chop. How are you thinking of timing entries this round?
English
1
0
0
49