Sabitlenmiş Tweet
Crypto Sander
3.5K posts


Crypto Sander
@DeCryptoTrader
Crypto investor decoding markets | Quick insights, bold strategies | Let’s profit together 🚀 | My stocks profile: @404Returns
Katılım Temmuz 2015
382 Takip Edilen939 Takipçiler
Crypto Sander retweetledi
$USAR - Nice when TA and FA align together. I will hammer more entries sub $20 if we get it, otherwise will enjoy the ride up if the bottom is in.
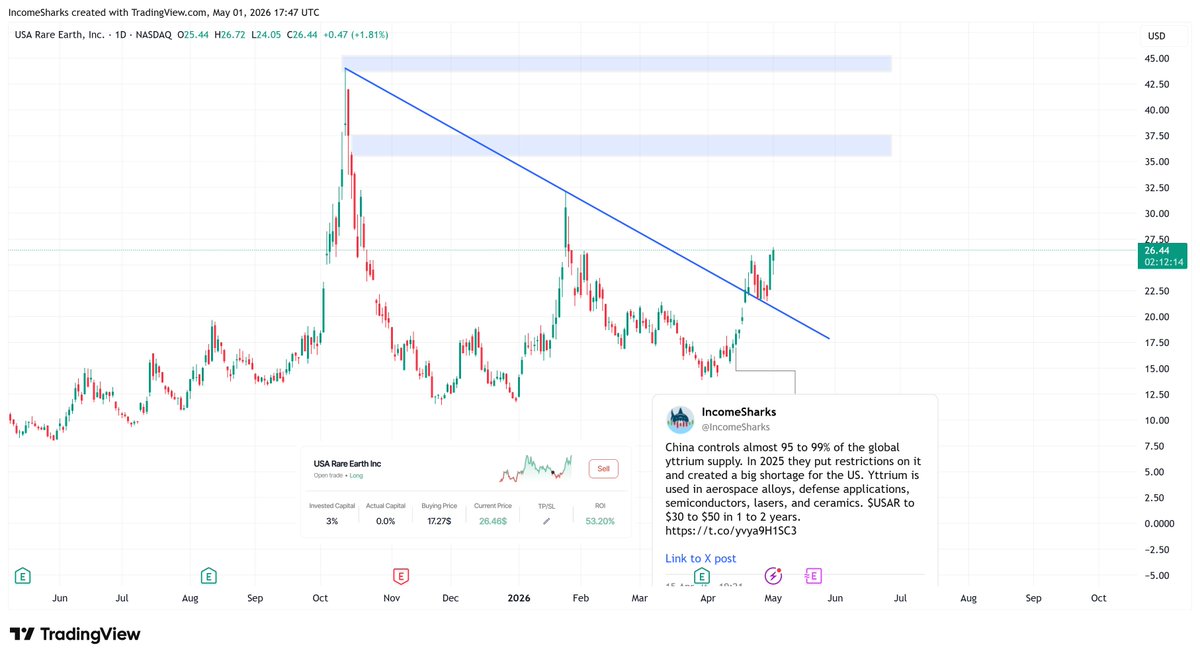
IncomeSharks@IncomeSharks
China controls almost 95 to 99% of the global yttrium supply. In 2025 they put restrictions on it and created a big shortage for the US. Yttrium is used in aerospace alloys, defense applications, semiconductors, lasers, and ceramics. $USAR to $30 to $50 in 1 to 2 years.
English
Crypto Sander retweetledi

I've been heavily speculating in the markets (not full time) since 1992. My first trades were before online brokerage, you had to call in for quotes and to place orders. 4% commission in AND out.
I had a great run during the DOT COM era. By 1999, I had a really chunky (for my age) portfolio and thought it was easy. By late 2000, the account was $0. That part was fun, at least. For the next 10 years I was super active, some good runs, some big drawdowns. Overall, nothing exceptional. Just decent.
Then something shifted. The need to speculate faded and that’s when things actually got better.
Once I stopped chasing it, opportunities started coming to me. Not just in trading. As I’ve gotten older and less interested in money itself, seeing opportunity has become clearer. And more than anything, removing that constant need elevated how I experience life.
This isn’t meant to be spiritual (for some it is). But for a lot of people who are active and still underperforming, it’s worth asking what purpose this is really serving.
Most of the time, it’s just a dopamine loop. And for many, it’s closer to an addiction than they would like to admit. And that could be what’s holding you back.
English
Crypto Sander retweetledi
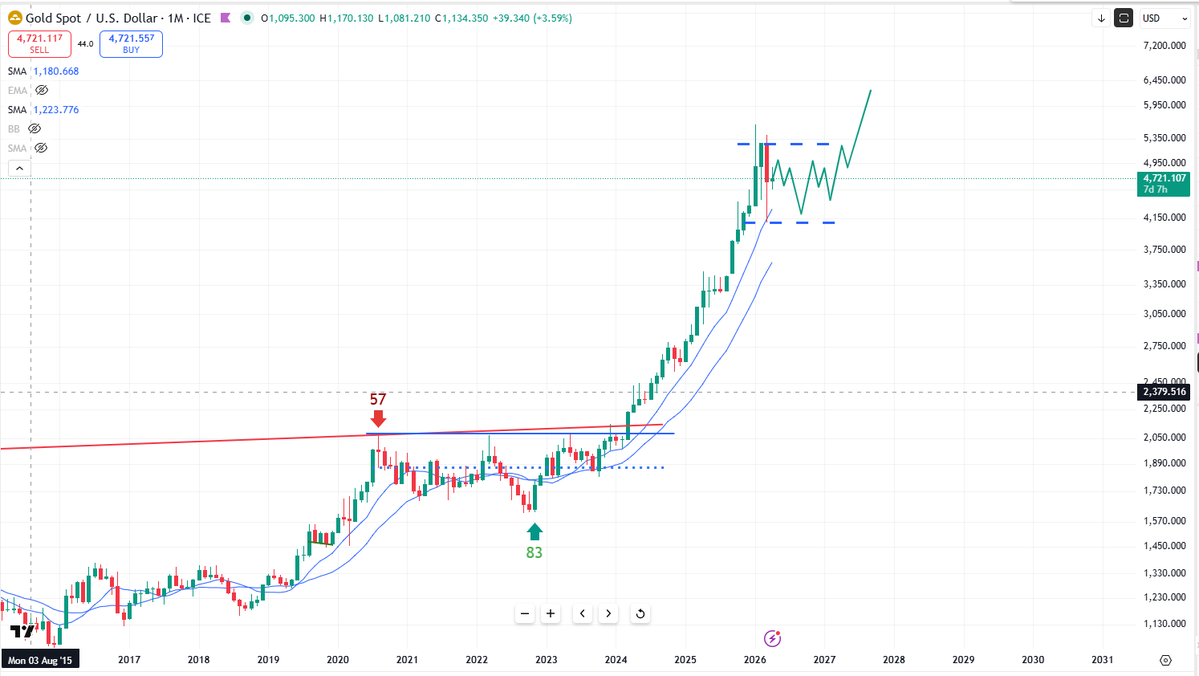
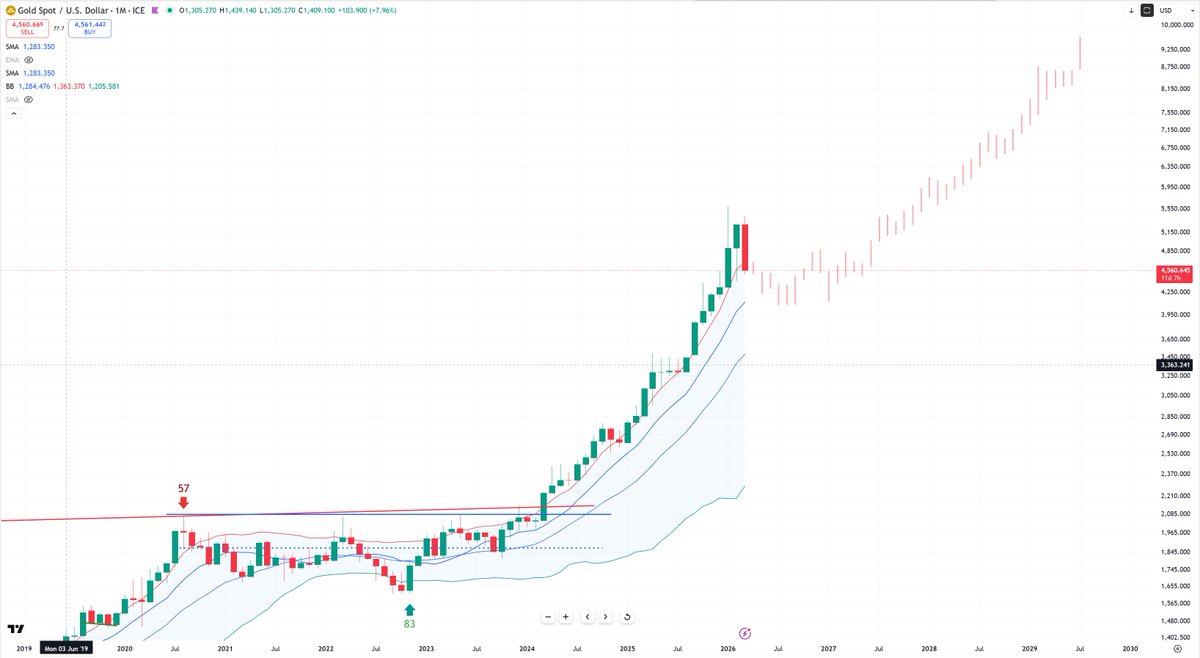
40 months into the Gold bull market, a mid-cycle pause and consolidation is likely developing. 48 months marks the midpoint which is towards the Nov window. Lot of confluence in that area across many asset classes.
English
Crypto Sander retweetledi
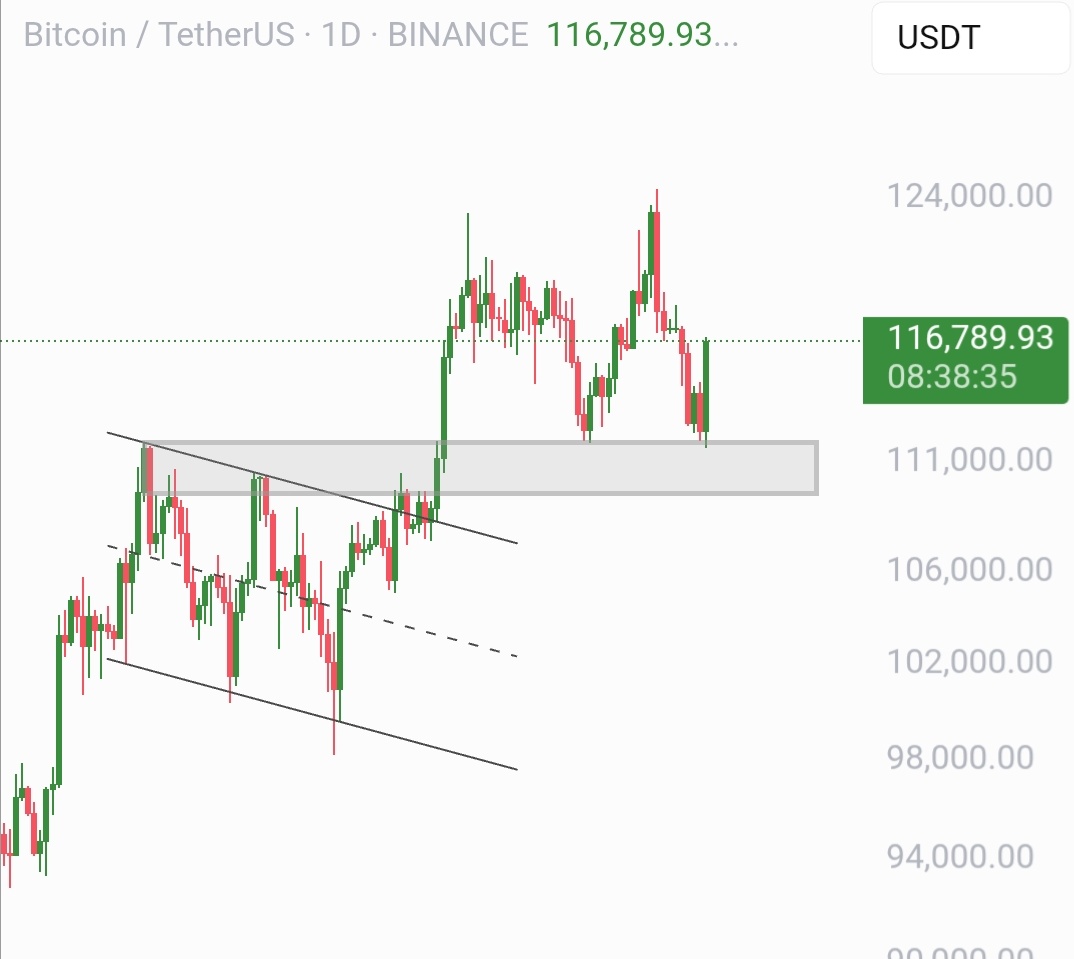
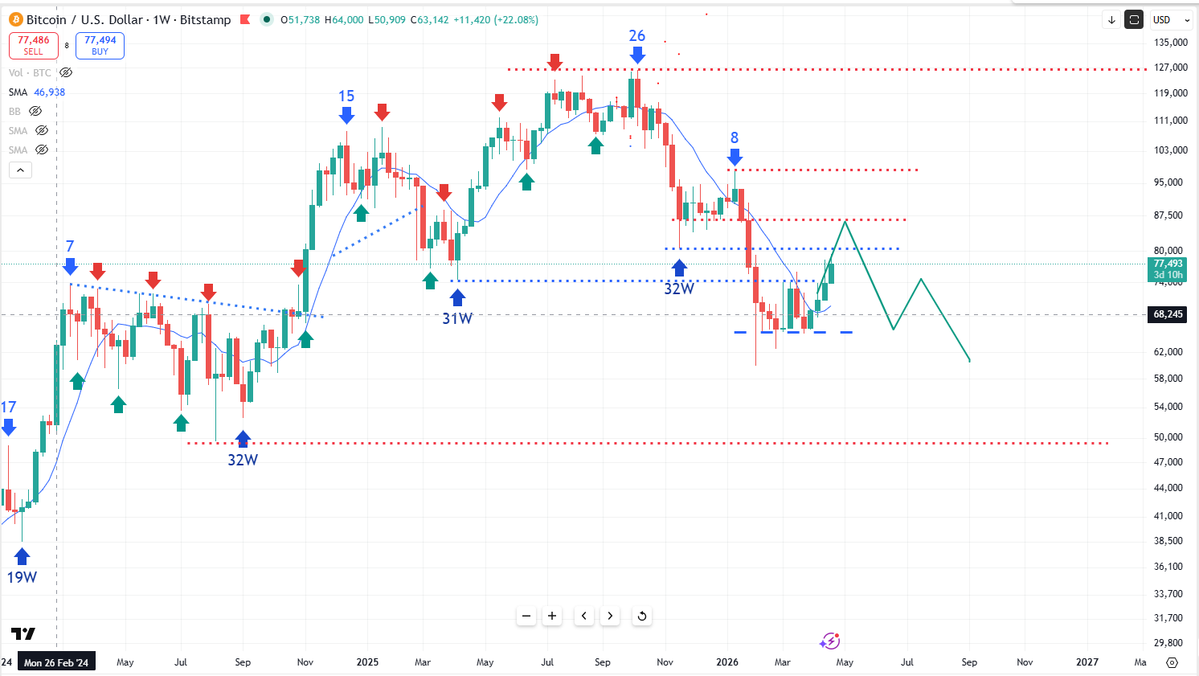
Typical script for Bitcoin in the declining phase is around the $85k level before resumption of the trend.
English
Crypto Sander retweetledi
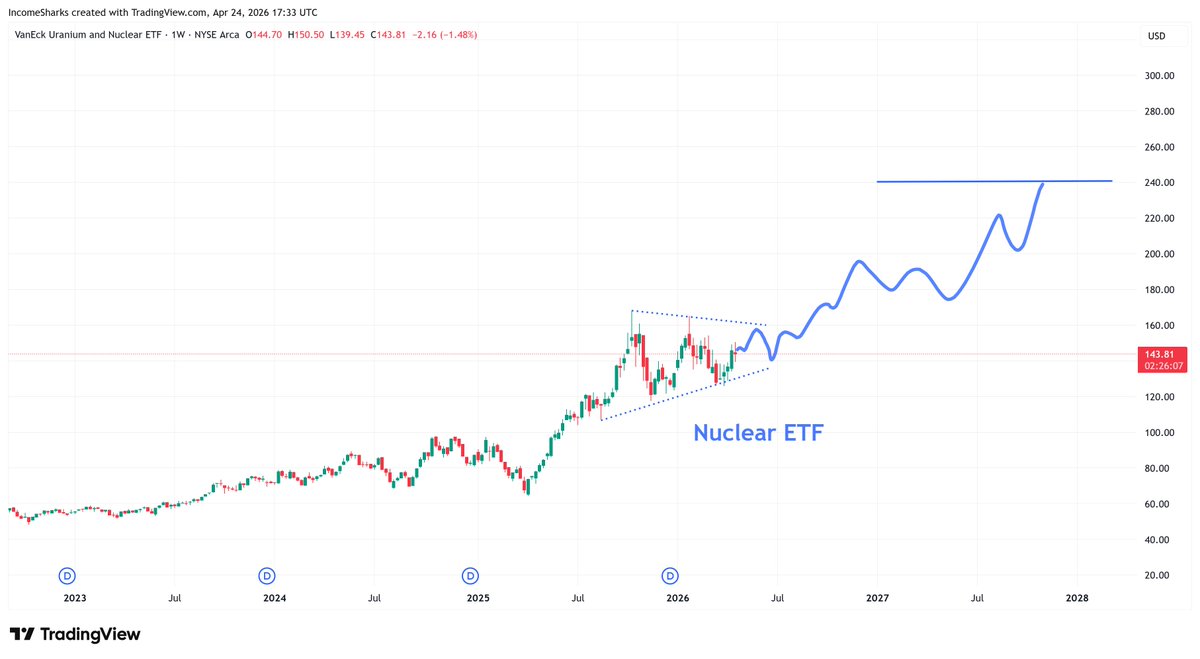
A lot don't have patience for Nuclear but it's something I'd make sure I'd have exposure in before 2030.
English
Crypto Sander retweetledi

🚨 WOW! Joe Rogan reveals President Trump IMMEDIATELY offered him FDA approval for a psychedelic treatment in a text chain
Because the data was SO CONVINCING and STUNNING
"I wanna tell everybody how this happened. I send President Trump some information."
"With one dose of Ibogaine, more than 80% of people are free of that addiction. With two doses, it's more than 90%. I sent him that information."
"The text message came back, sounds great. Do you want FDA approval? Let's do it. It was literally that quick!"
"For 56 years, we've lived under those terrible conditions. We're free of that now."
"We're free of that now, thanks to all these people that you see next to me, and thanks to President Trump!" — @joerogan
English
Crypto Sander retweetledi

You guys must understand, altcoins have been in a downtrend against $BTC for nearly 5 years.
That kind of compression doesn’t last forever.
The structure looks appealing here and bottomed out, and sentiment is still extremely pessimistic. which is typically where major reversals form.
I’m bullish at these levels.
Any small pullbacks, in my opinion, are opportunities to accumulate quality, fundamentally strong altcoins and not reasons to panic.
The biggest moves usually start when the majority is still cautious.
#ALTS
English
Crypto Sander retweetledi
$KHC - Consumer staple play. Run it back to the top of the channel with a bowl and ketchup breakout.
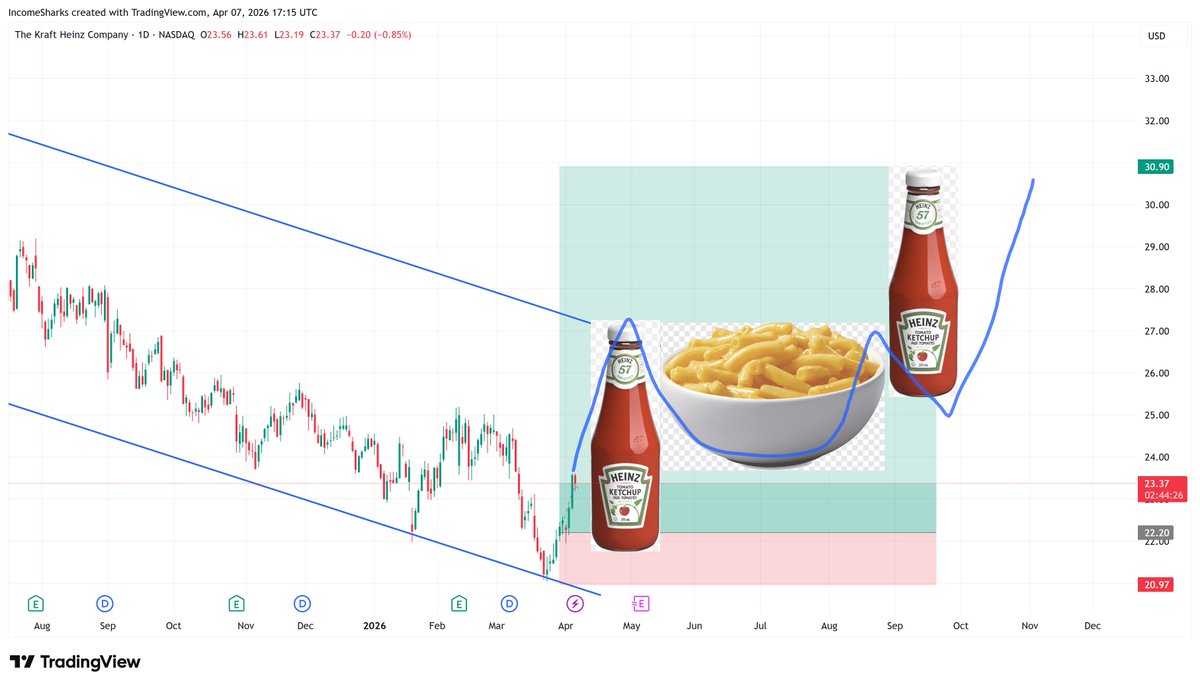
IncomeSharks@IncomeSharks
$KHC - Bullish on ketchup and Mac n Cheese here. People still have to eat.
English
Crypto Sander retweetledi
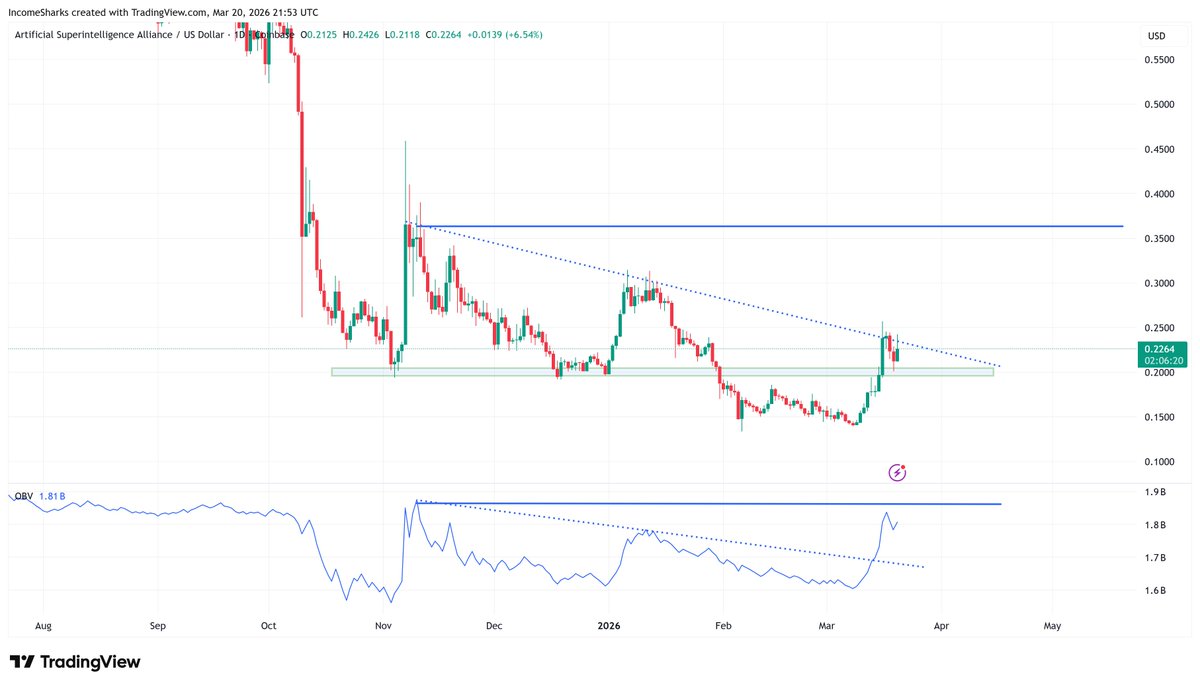
$FET - If you had been living under a rock for a year and saw this chart what would your thoughts be. If you like OBV it's been a leading indicator.
English
Crypto Sander retweetledi
Nothing unusual about gold selloff. Profit taking a 3yr move and raising cash as we go risk off. Think it spends most of the year building the next base.
English
Crypto Sander retweetledi

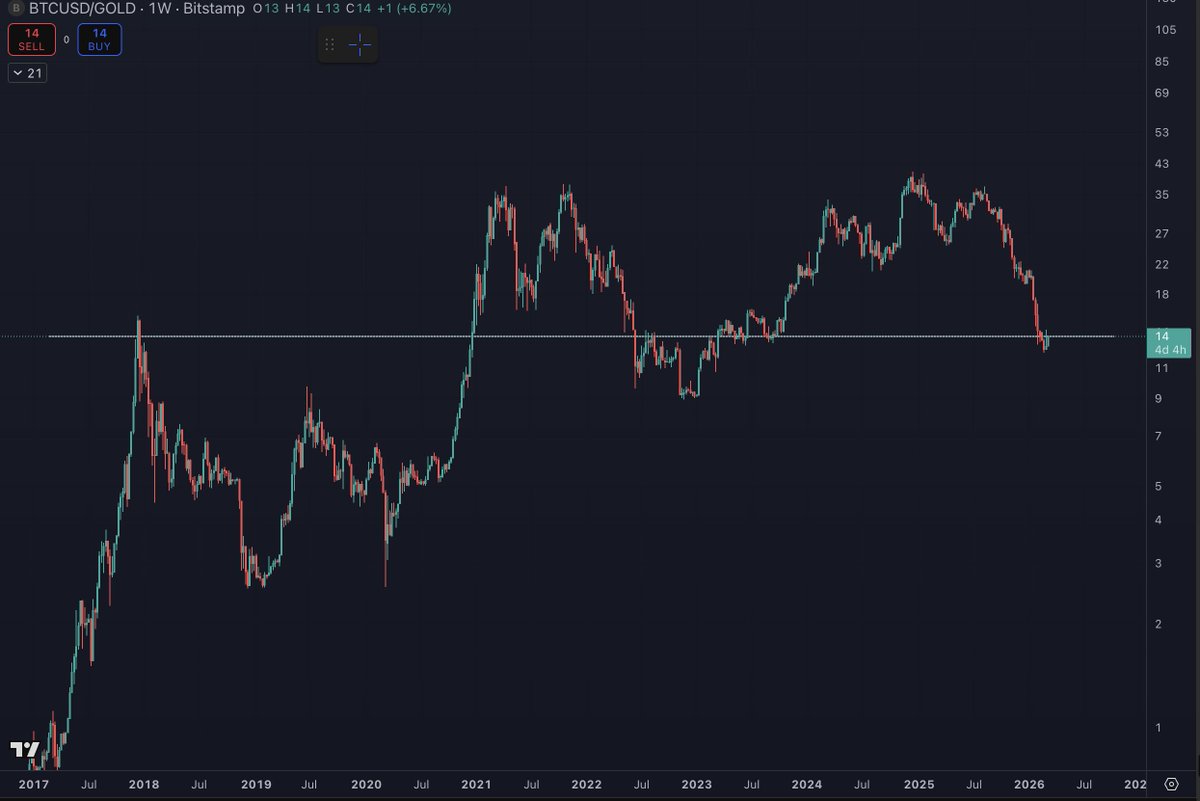
Bitcoin is at the same valuation against Gold as it was in late 2017.
English
Crypto Sander retweetledi
I swear it feels like we live in a simulation.
Same playbook as 2022.
Bitcoin sells off during the start of a new conflict, finds a low in February, then bounces into March.
Benjamin Cowen@benjamincowen
Often times, risk assets sell off, then bounce as major conflicts start. If a rally for Bitcoin does materialize, it will likely yield a lower high in March, just like it did in 2022. Bear markets tend to take a while to play out.
English
Crypto Sander retweetledi
This chart is of great importance.
The 2023–2024 altseason took place within a macro downtrend on $OTHERS / $BTC, which is why alts were weak overall.
The upcoming Alt season should rival 2018 and 2021.
Very few are prepared for what’s to come.
I expect the next big downside move in this market to mark the bottom.

English
Crypto Sander retweetledi
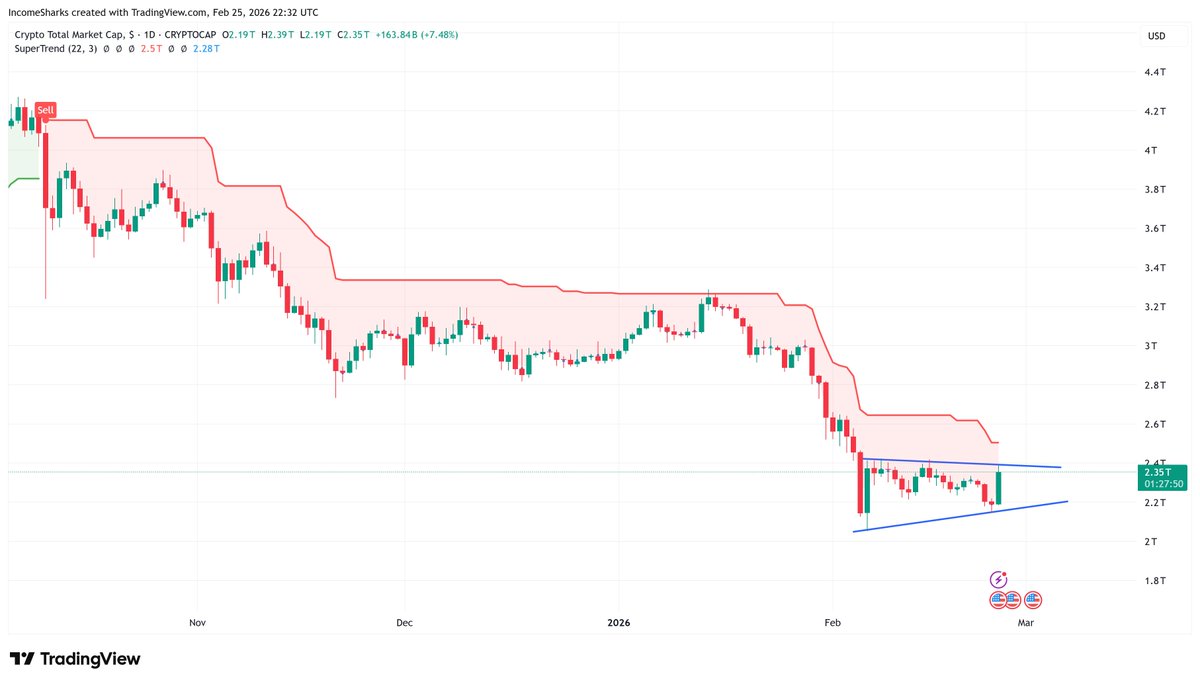
Supertrend has been red on Crypto since the events of October 10th. A clear signal to get out and wait for a reversal. Bulls having a good day but I'd wait for at least it to flip green before any celebrating happens.
English
Crypto Sander retweetledi
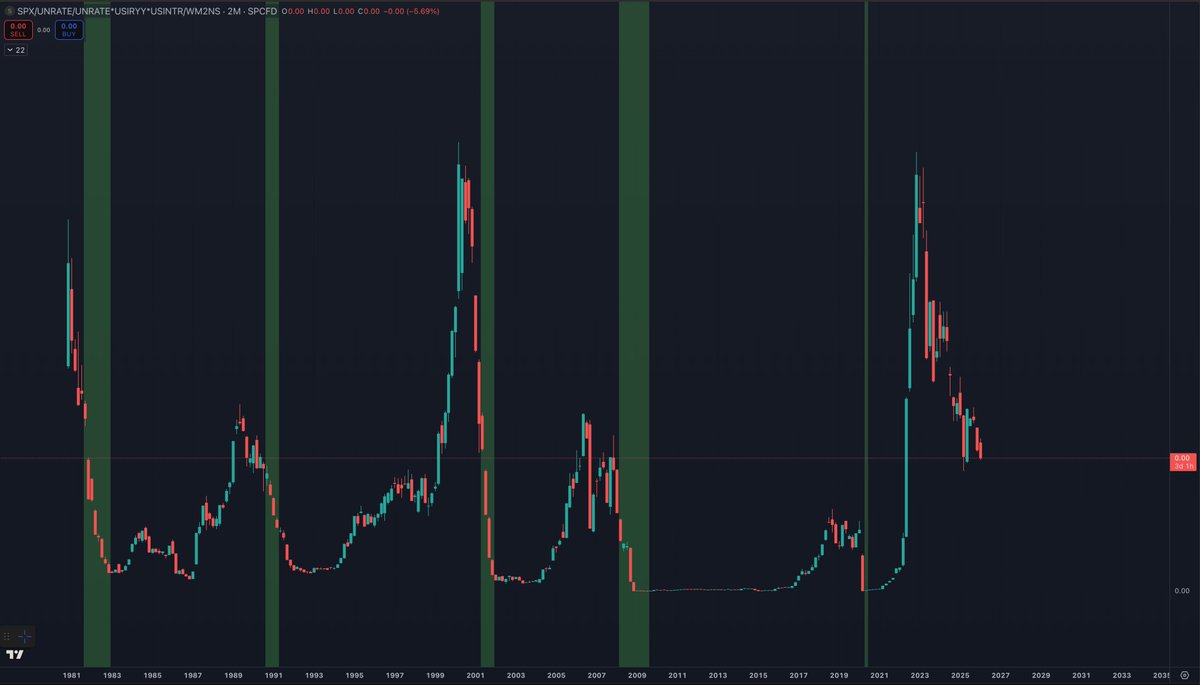
If you normalize this chart with respect to M2, you get a cleaner look at the current late business cycle environment.
Within the next 2-3 years, the current business cycle should end and a new one begin.
Until then, select deployment of capital and preservation is warranted
Benjamin Cowen@benjamincowen
I have mentioned this chart a few times in the past, but it does really go to show just how extreme things got the last few years. The chart is SPX/(UNRATE^2)*USIRYY*USINTR Unravelling things after extreme euphoria is never an easy process. As things have been unwound over the last several years, most markets have gone higher on hopes of a soft landing. But there has generally been a flight to quality within each asset class as people buy what they better understand and think has value long-term, rather than short-term speculative investments. Unwinding euphoria has never been an easy or a fun process, but it is a process we have been going through for the last several years. As liquidity and monetary policy has stayed relatively tight the last several years, it has led to a general flight to quality within each asset class. This is why BTC outperformed most other things in crypto and why the MAG7 generally led the S&P 500. Starting out far on the risk curve, altcoin weakness was observed first as they bled to BTC for years. Then as the BTC bull market came to an end, BTC was noticeably bleeding to SPX. Then it became apparent that SPX was bleeding to Gold (which it already had been but more people started to notice). Notice how we are basically just working our way down the risk curve? As this chart falls back down to prior support levels, it represents us going back to normal times. What I love about this chart is that you can clearly see each business cycle and how every single one of them ended in a recession before the next business cycle began.
English
@XRPARMY598 I tried to check eligibility and only claimed like 56k tokens....I have been supporting this token since start day and night bruh. Some people claimed 300k+ with 1 month holding 😑
English
Crypto Sander retweetledi

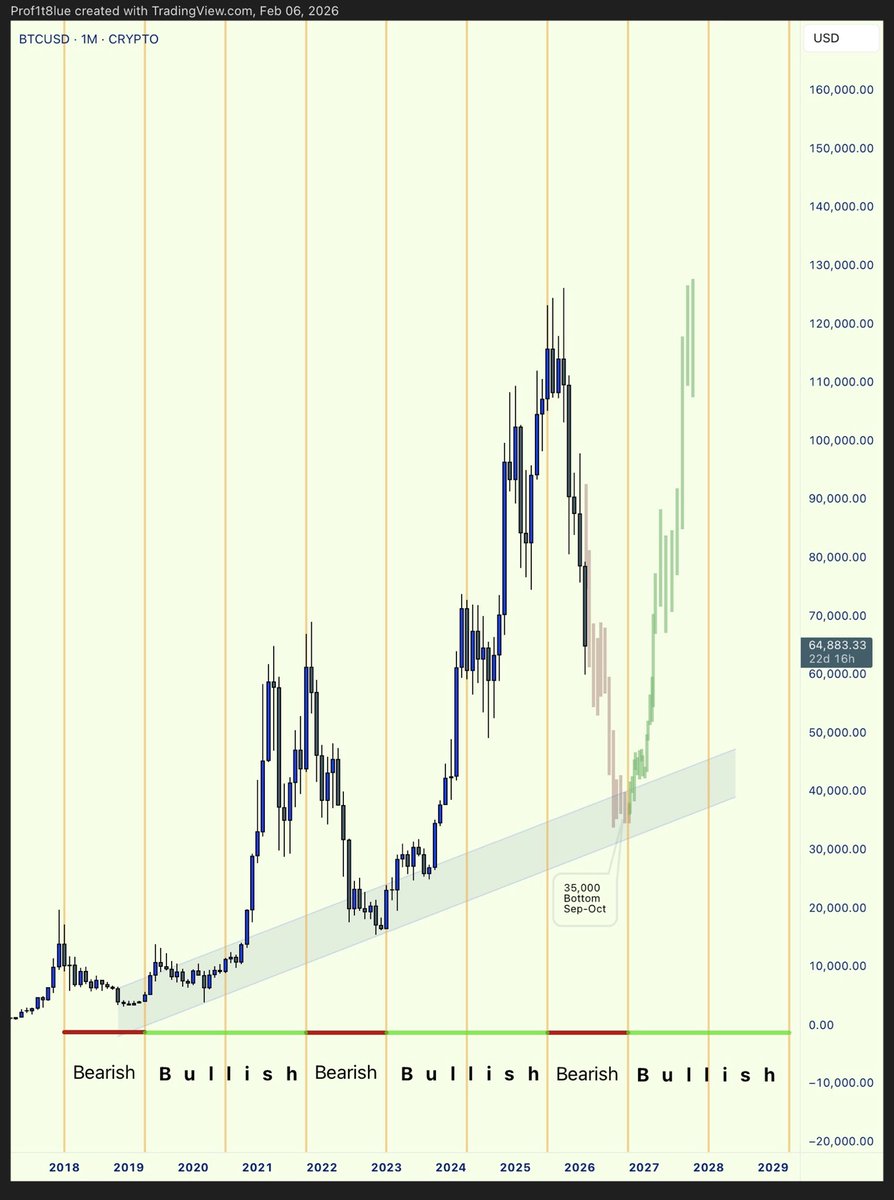
The #Bitcoin four-year halving cycle is active.
A break below $55,000 would increase the probability of a generational bottom near $35,000 forming between September and October this year.
English
Crypto Sander retweetledi
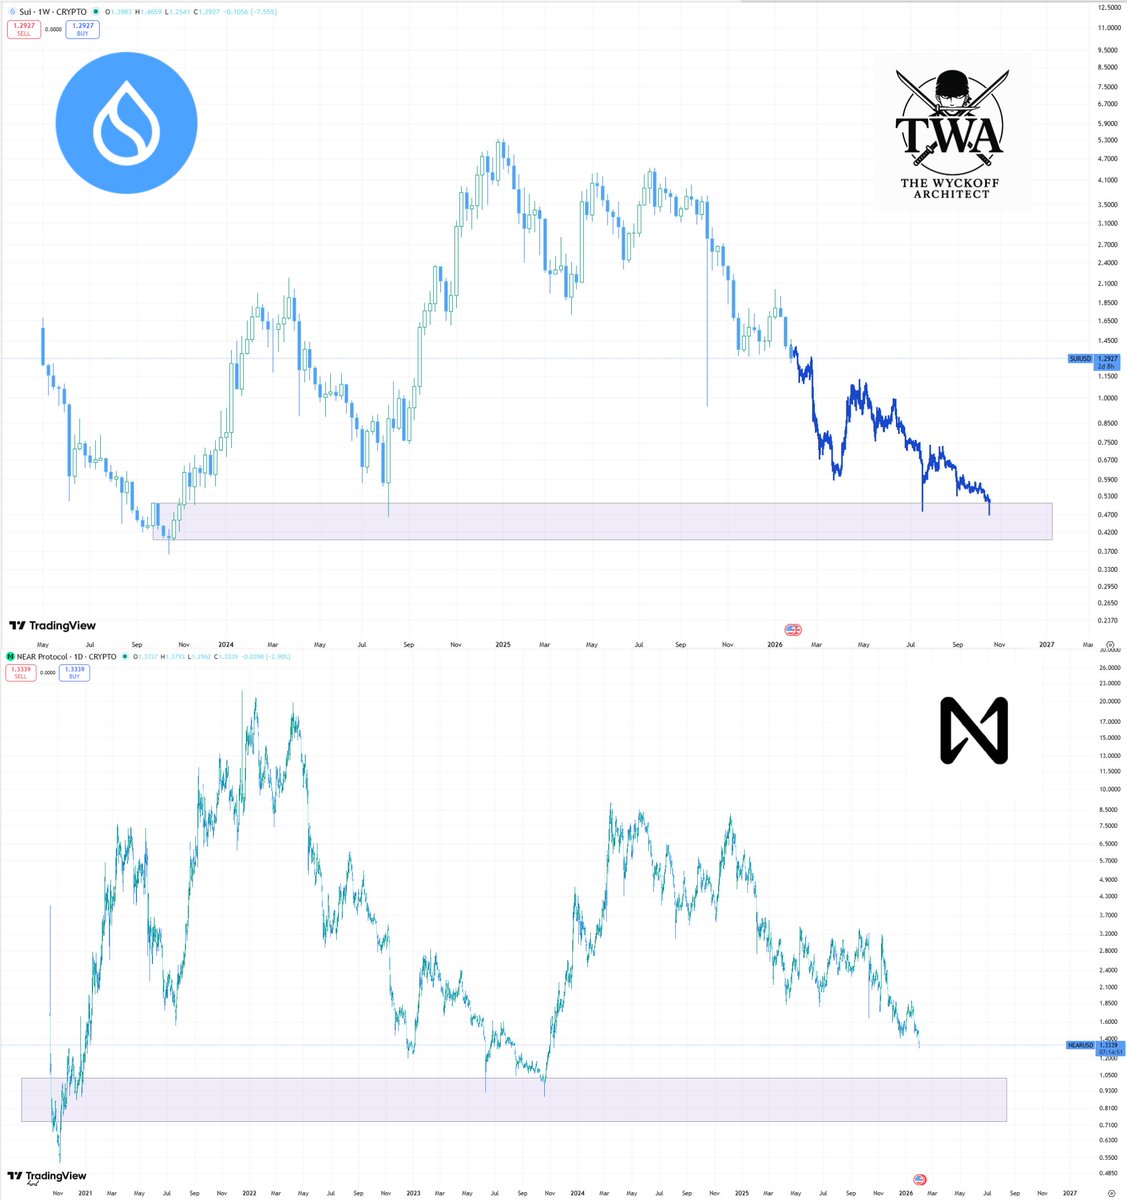
$SUI x $NEAR Fractal
So far this has been tracking the fractal almost perfectly.
If it continues to play out, we could be looking at a bottom forming somewhere around $0.50.
English
Crypto Sander retweetledi
Crypto Sander retweetledi
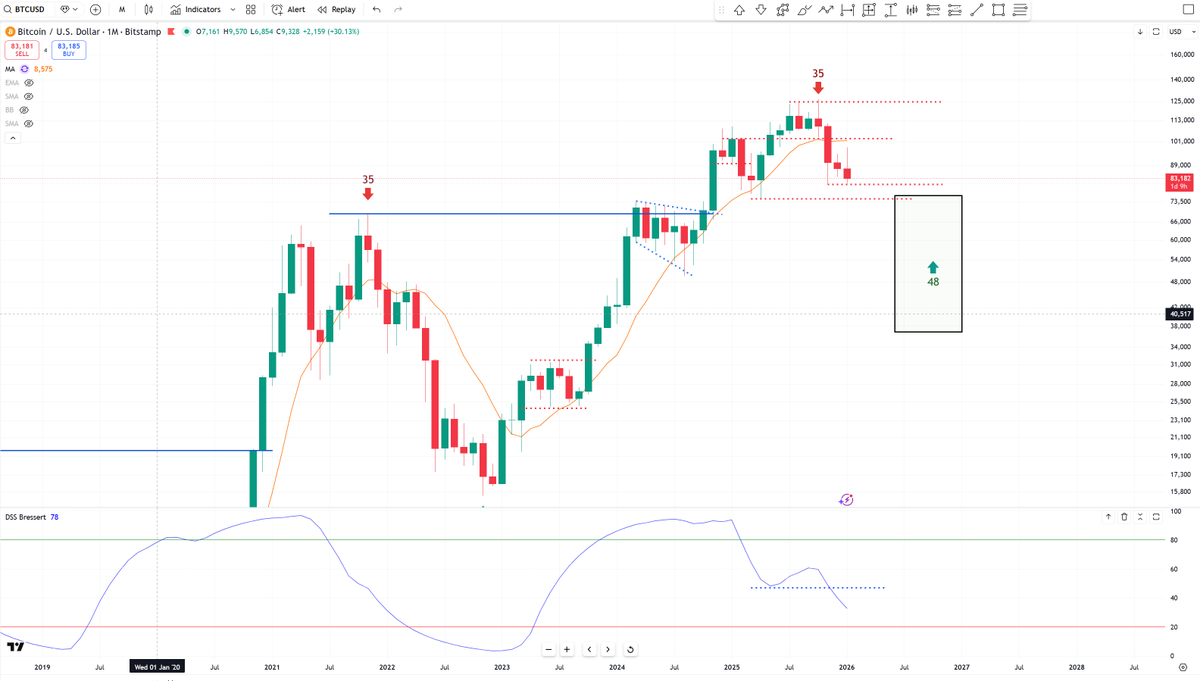
Bitcoin 4 Yr Cycle update.
On month 38 of 48(avg). Closing 3rd month below the 10ma. About to close 4 red months in a row, not seen since 2018. Looking like the recent move to $98k was the counter-trend move. Clear divergence from all other assets.
I hate being bearish any asset, especially bitcoin. I rarely short markets or believe any decent asset class stays down for long. I always want to be a bull in general. But this "currently" is a perfect 4yr cycle and mirrors all priors. Remember you can be very bullish on the fundamentals, but also realize that everything is cyclical and respecting there is a time and place.
Ofc, markets can change in a heartbeat, every strategy is breakable, and it's our job not to get hung up on any narrative or bias. In that regard, on the positive, Bitcoin's declining phase is likely accelerated now, as sentiment has been repeatedly killed. Cycle declines are ALL about sentiment clearing events, and on that front we could be looking at an earlier (month 44?) low as a result.
But many of the bulls on X are just selling services, funds/DAT's, clout, etc, choosing personal gain/bias over reality and price action. Shifting narratives to keep the hope alive. They're human after-all.
I think that if this consistent historical structure were to change, then we would see a close back over the 10ma and i would want to quickly start to shift focus to the bull side. If such a change is structure were to happen, then I believe it would be signaling something massive afoot. I'll never say it can't happen here, I have strong convictions that I want to constantly challenge. I also think you're not giving up (besides some upside) being defensive and risk adverse here, even if this reverses and goes on to new highs.
Lastly, I also think most investors are still better off socking bitcoin away and ignoring all the volatility. And just use long drawdown period to aggressively accumulate.
English