Alex Mason 👁△@AlexMasonCrypto
🚨 BITCOIN IS BEING MANIPULATED, AND I HAVE PROOF
Everyone is talking about how Bitcoin went up $5,000 in 10 minutes.
Everyone’s posting about it…
But almost nobody is explaining what actually caused it.
Stop staring at the chart. Look at the flows.
Within minutes, wallets tied to Wintermute, Binance, Coinbase, and ETF-linked addresses all became active simultaneously.
Large blocks moving between exchanges.
MASSIVE market buys hitting thin order books.
Then suddenly…
THEY FLIPPED AND STARTED SELLING EVERYTHING.
Here’s what really happened:
– Liquidity was thin
– Leverage was stacked heavily on one side
– Funding rates were already stretched
So price gets pushed higher aggressively.
Why?
To trigger FOMO and, more importantly, force shorts out while pulling new longs into the market.
Once enough leverage was trapped…
They started unloading.
The data shows it clearly:
– Coordinated inflows to major exchanges
– Large market buys clustered within a narrow window
– Immediate reversal after stop levels were cleared
– Heavy selling right after liquidation zones were hit
This is how INSIDERS DUMP without crashing price.
They move the market toward liquidity, trigger liquidations, and then sell directly into the chaos they just created.
And it wouldn’t surprise me if they were running long and short positions simultaneously through separate wallets.
If you’re new to this market, understand one thing:
Bitcoin almost never moves like this because of headlines.
It moves when leverage builds up and someone with enough size decides it’s time to wipe everyone out.
Watch funding rates. Watch open interest. Watch where coins are moving, not who is posting charts.
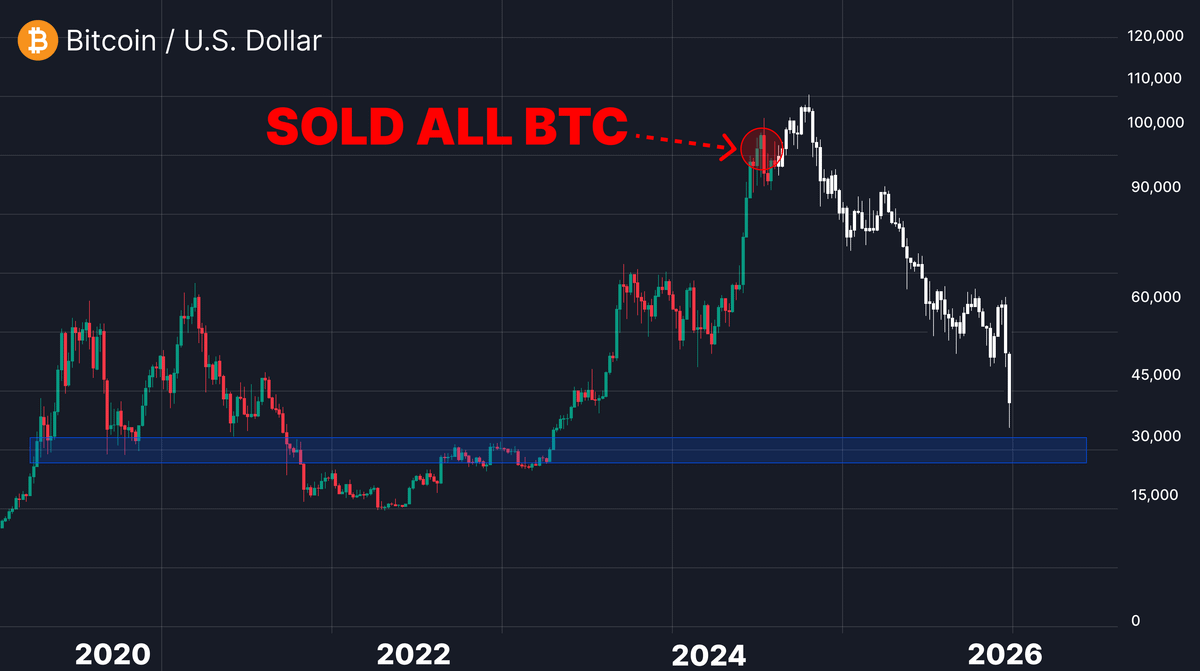
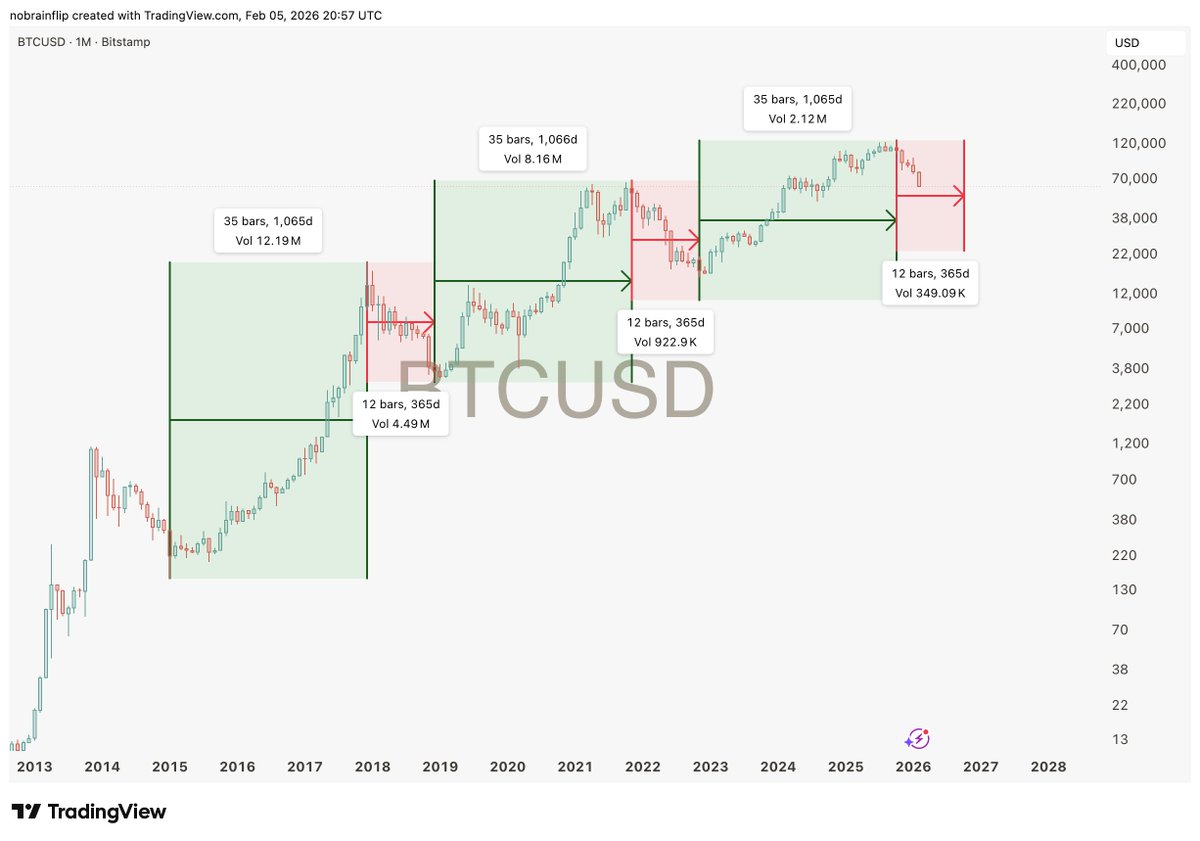
For the record, I was the only one publicly calling the exact bottom at $16,000 three years ago and the top at $126,000 in October.
If you missed those calls, don’t worry. I’ll call the next one too.
Turn notifications on. If you’re not following yet, you’ll understand why that was a mistake later.