Drew retweetledi

Drew
3.5K posts


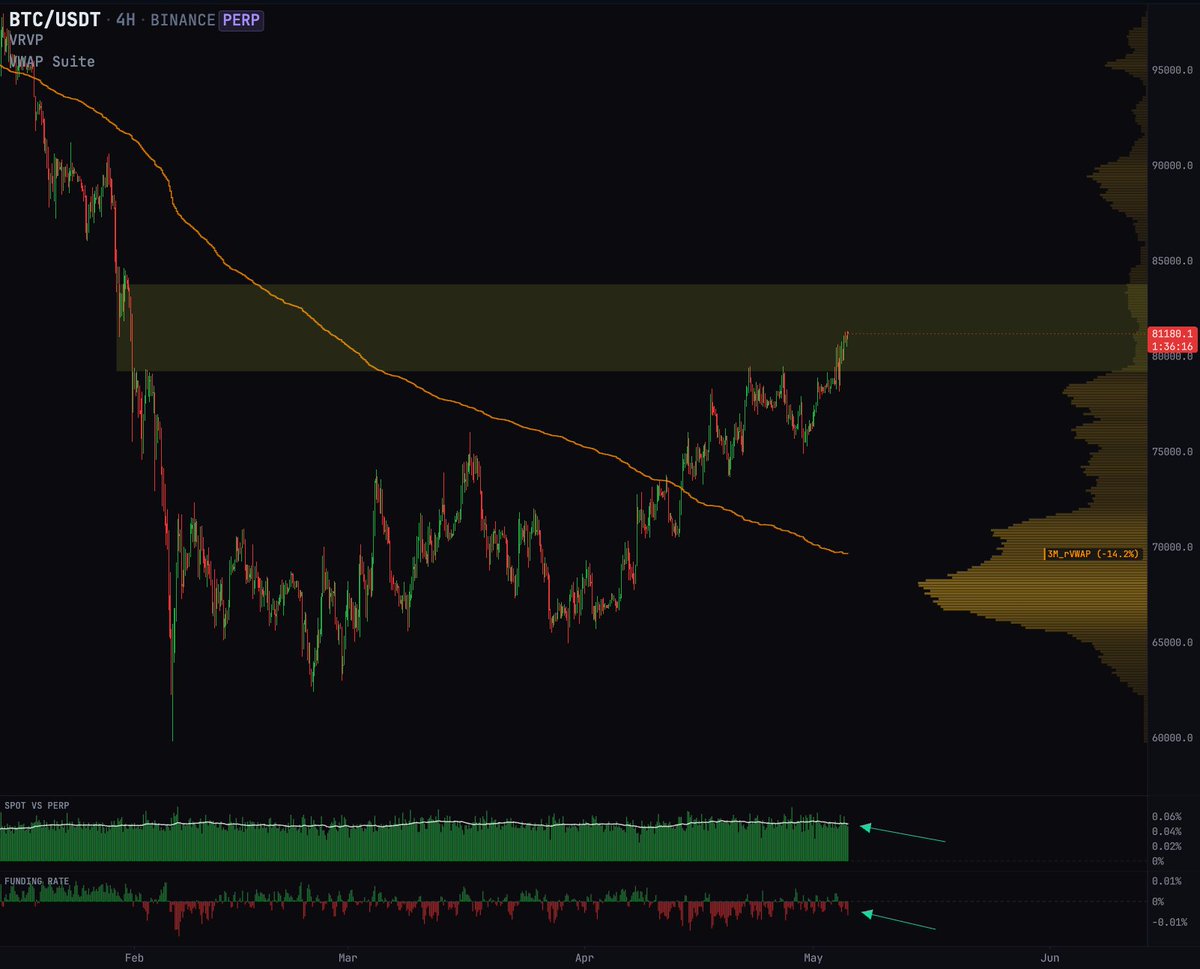
$BTC Funding still negative, basis still spot skewed & orderbooks thin Bulls are butting up against a clear liquidity void Acceptance over 79.5k and I think mid 80s comes fast
$BTC On LTF kind of a perfect bounce from 0.75 and demand, structure held so far. Big trouble zone here at the bearish retest of the 1H trend, need to flip it. At least it has reclaimed local range low. On 12H the trend held as support so far, as the 50 level on RSI. Now we need to invalidate the divergence. On daily, the multi trend held, now the question remains what will happen at 80K if we have the strength to move there! My TP1 is at around that level.


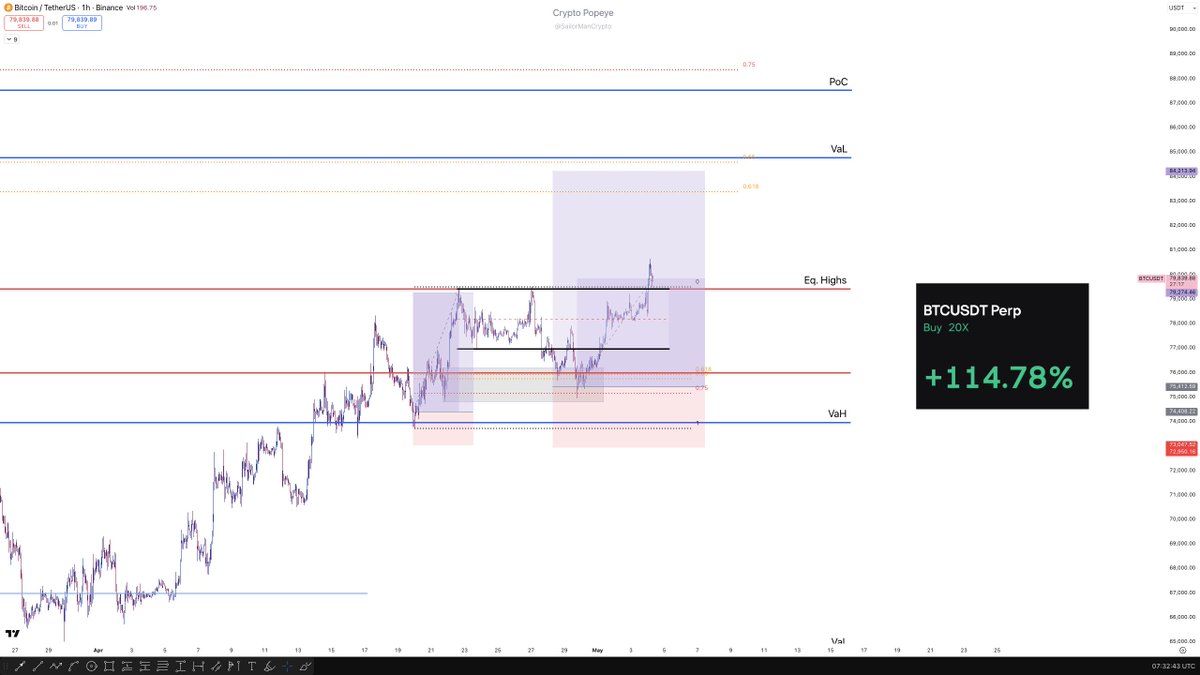
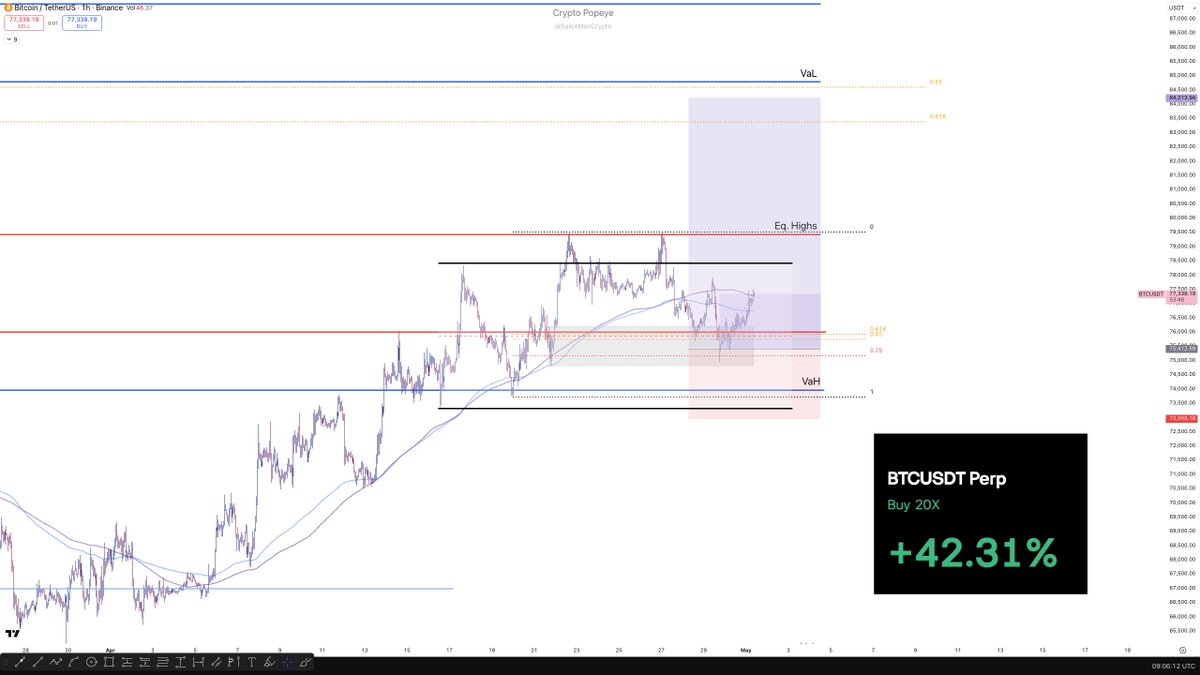
$BTC Bit of a choppy flip but if we stay above grey here, I think we have a fair shot at low 80's
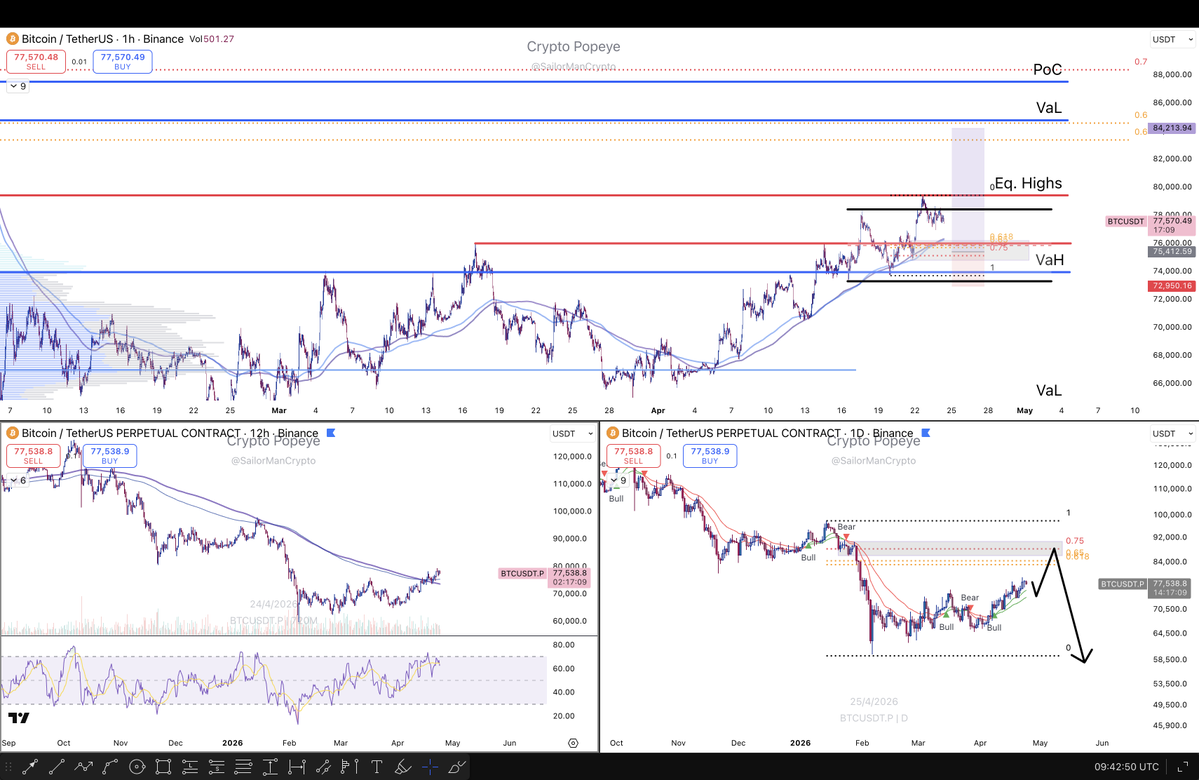
$BTC On LTF kind of a perfect bounce from 0.75 and demand, structure held so far. Big trouble zone here at the bearish retest of the 1H trend, need to flip it. At least it has reclaimed local range low. On 12H the trend held as support so far, as the 50 level on RSI. Now we need to invalidate the divergence. On daily, the multi trend held, now the question remains what will happen at 80K if we have the strength to move there! My TP1 is at around that level.
Another trading week is over for me. I have not traded much but got some pretty good results. Total Trades - 5 Win - 4 BE - 1 Loss - 0 All shared publicly and in advance. Transparency is key! 👇


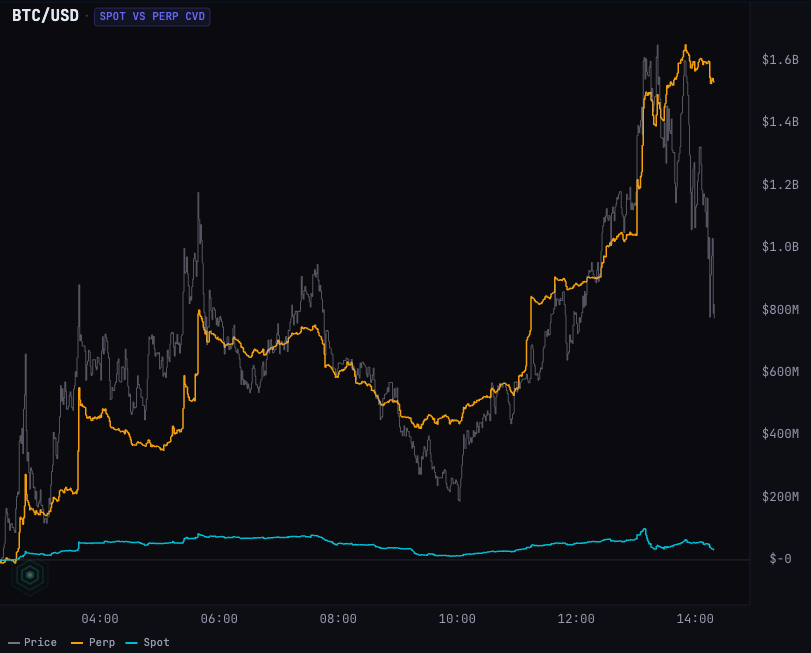
$BTC Bulls have slowly accepted out of the two month boring range Despite the ~20% move in April, funding is still negative & spot premium is still positive... No signs of froth My eyes stay at ~79K. Bull acceptance over that will enter a low volume liquidity void where price would likely move fast towards 84K Order books are also slim north of 79k, so the only roll over concern would be exhaustion from buyers
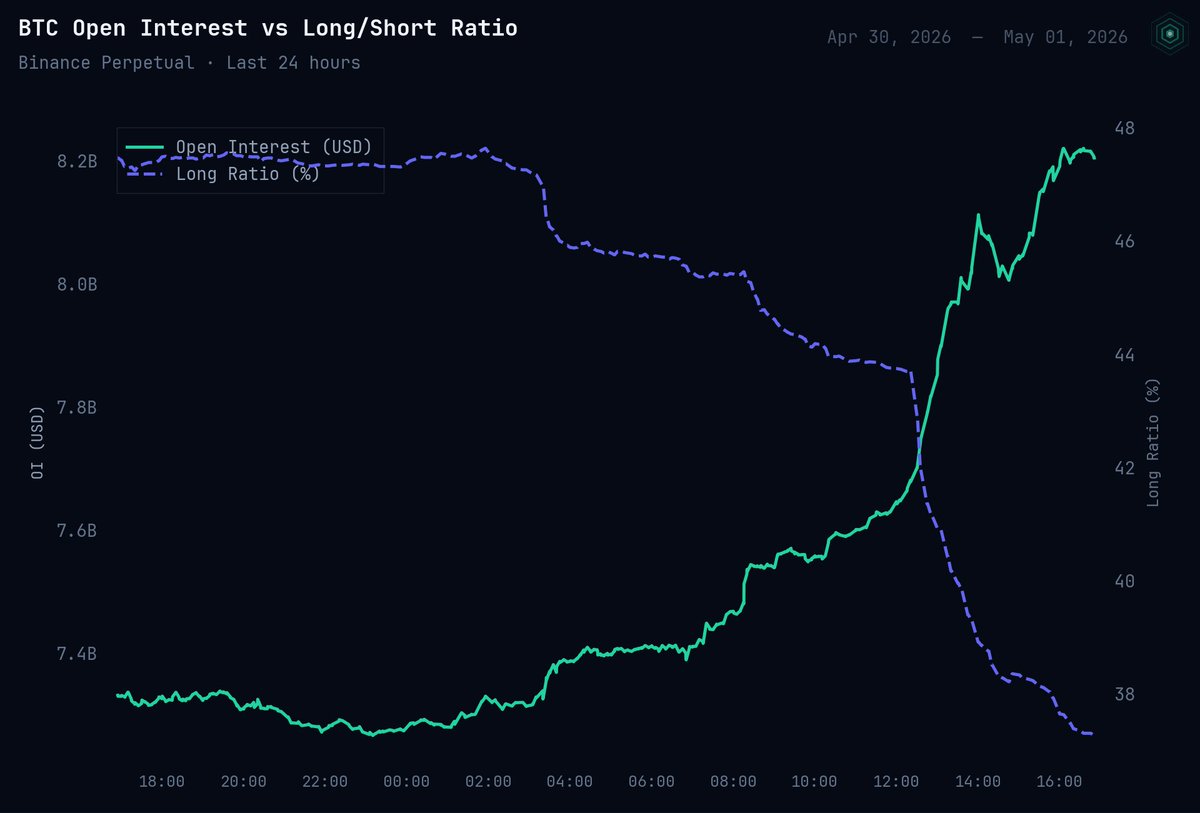
$BTC Funding still negative, basis still spot skewed & orderbooks thin Bulls are butting up against a clear liquidity void Acceptance over 79.5k and I think mid 80s comes fast


on one hand it’s depressing that google can add 500b in a day while crypto genuinely has zero bid and it’s all i’ve been trading for five years on the other hand it’s electric thinking about how small these crypto tokens are relative to the amount of money floating through the market. which way man which way
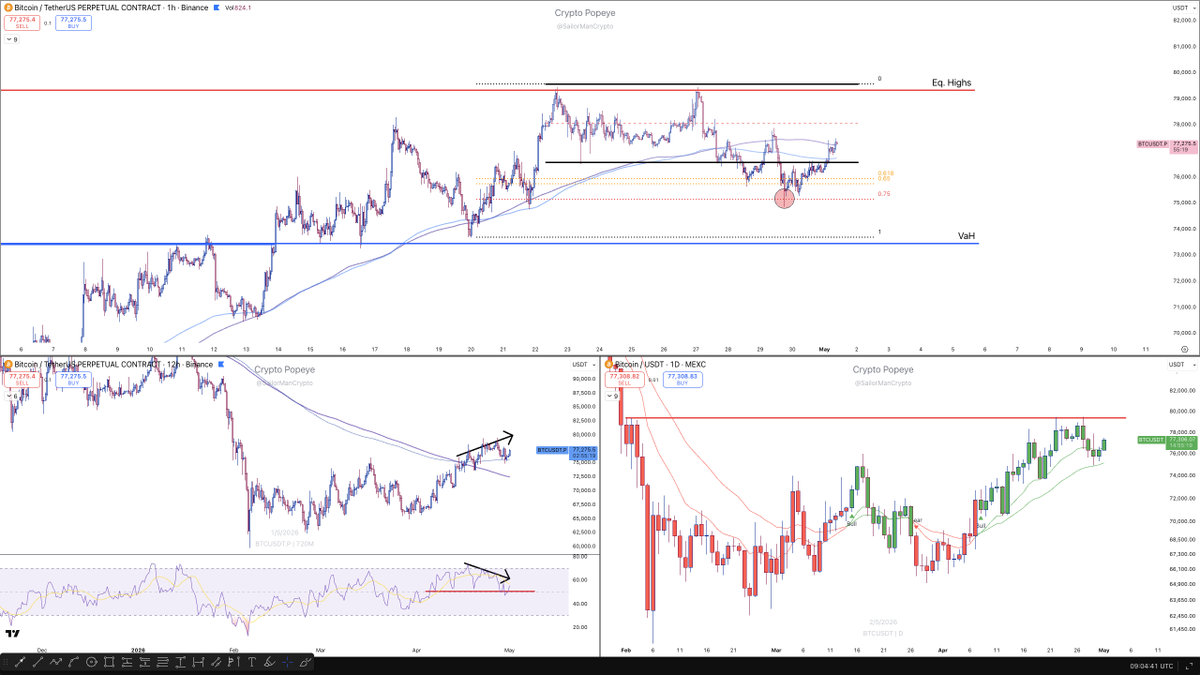
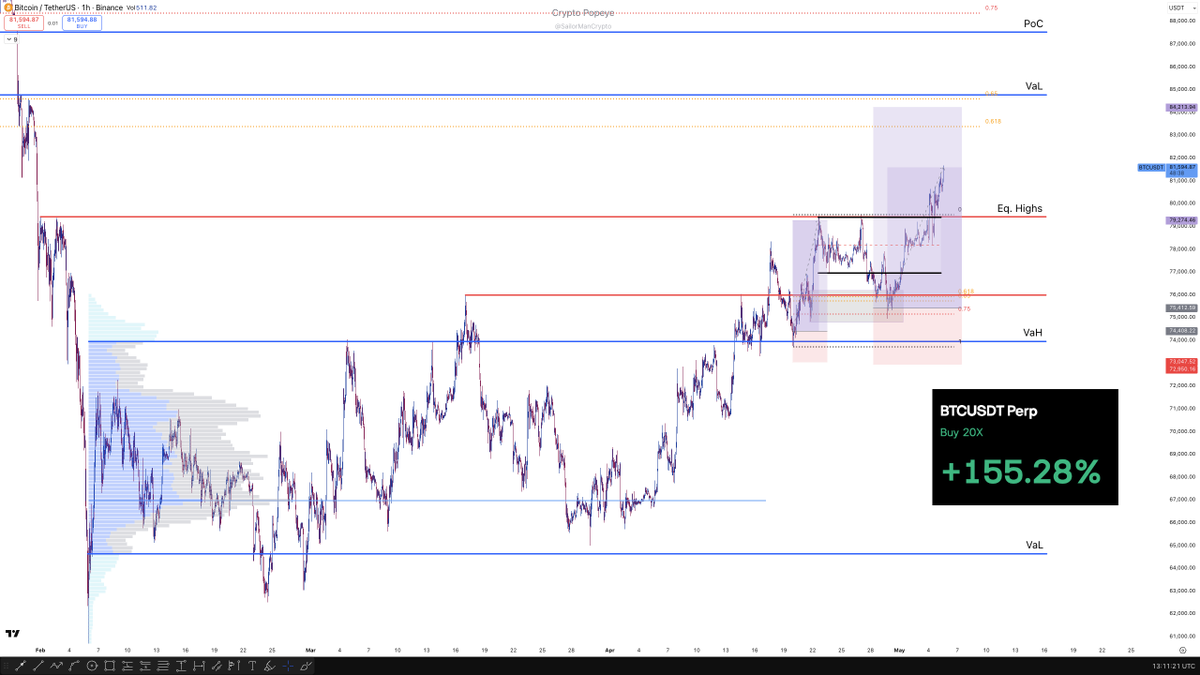
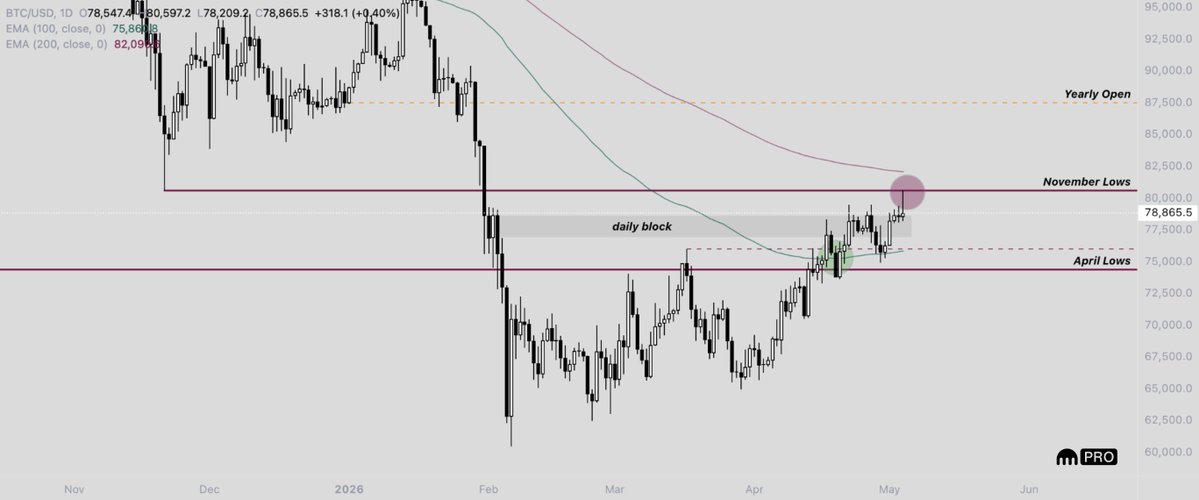
$BTC (Multi Time Frame Analysis) We’re at a crossroads: my system can still support a bullish continuation, but it may also be pointing to the start of a bigger correction. Bullish case: Range breakout still intact, with price well above VaH. - 1H structure still bullish - Retesting both the 12H trend and the daily trend from above - This is where buyers should step in and resume the most recent uptrend for a move into the 80s Bearish case: 1H trend, EMA and MA 200, have broken down and is starting to act as resistance. - Local range breaking down, showing signs of distribution - 12H bearish RSI divergence, potentially losing the 50 level - Multiple clear rejections at the highs below 80K I’m long with a position just above BE, fibs 0.75 and demand are holding, but with these flashing signals it’s becoming pretty uncomfortable to hold. The plan was made objectively and still stands, so I’ll hold it but if, during the NY session, I see further weakness, I’ll close it to limit the damage.