FortyGuard

381 posts

FortyGuard banner
FortyGuard

FortyGuard

@FortyGuard

Making hyperlocal temperature intelligence accessible & actionable [email protected]

United Arab Emirates Katılım Aralık 2019
21 Takip Edilen210 Takipçiler
FortyGuard
FortyGuard@FortyGuard·
@Pirat_Nation Effective adaptation, though site-level temperature monitoring remains critical to identify exactly when and where these interventions are actually needed during the workday.
English
0
0
0
1
Pirat_Nation 🔴
Pirat_Nation 🔴@Pirat_Nation·
Japan has introduced what’s being called a “human refrigerator” to help workers stay safe during extreme heat. Designed for jobs where heat can become dangerous, workers can step inside during breaks, cool off quickly and reduce the risk of heat exhaustion before returning to work. With record-breaking summers becoming more common in Japan and around the world, companies are looking for new ways to protect workers from extreme temperatures.
Pirat_Nation 🔴 tweet mediaPirat_Nation 🔴 tweet media
English
54
34
708
36.9K
FortyGuard
FortyGuard@FortyGuard·
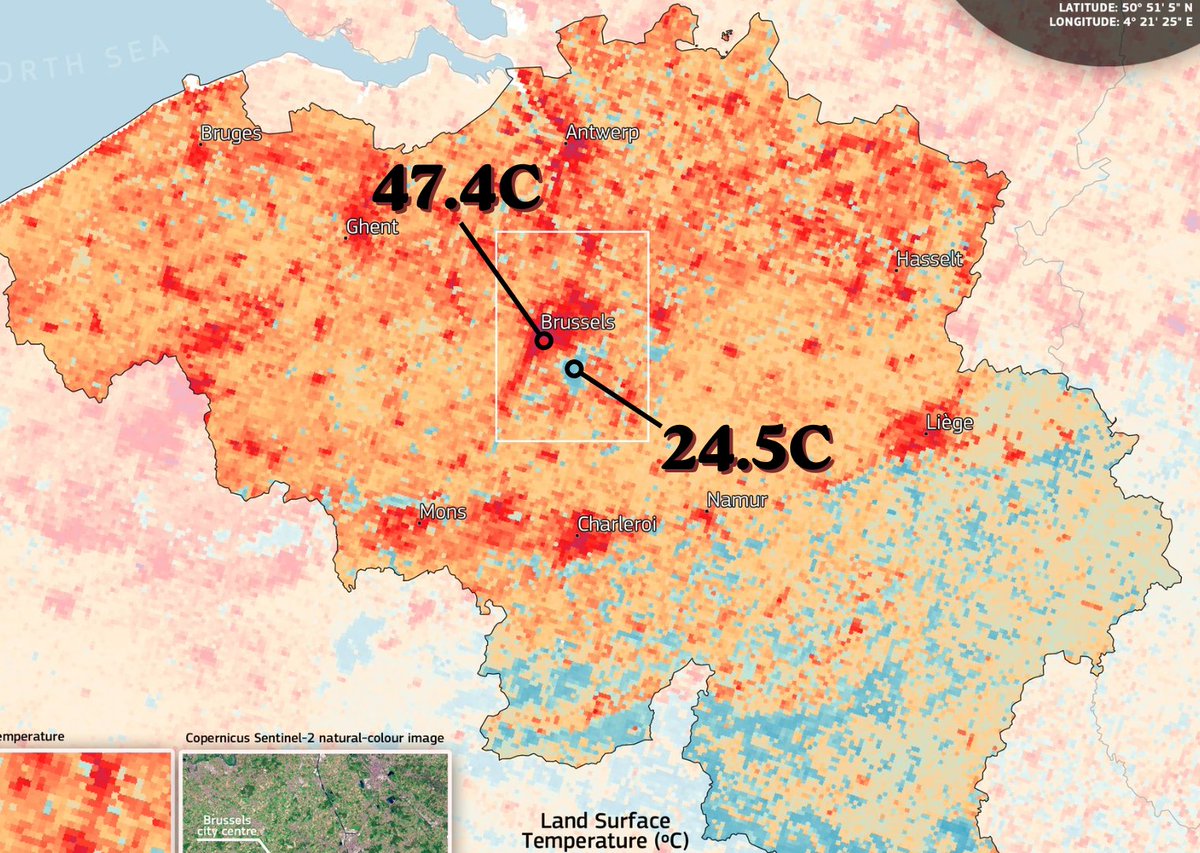
@Electroversenet That 23C gap illustrates why city-wide averages fail for operational decisions. Site-level variability dictates actual heat exposure, infrastructure stress, and energy demand, not the regional mean.
English
0
0
0
0
Electroverse
Electroverse@Electroversenet·
Europe’s red heat maps show the Urban Heat Island effect, not cLiMaTe ChAnGe. Copernicus satellites recorded a land-surface temperature gap of about 23C between urban areas and nearby forests. In Belgium, the city of Brussels reached 47.4C (117.3F) while the adjacent Sonian Forest sat near 24.5C (76.1F). Full breakdown (and more) in today's Substack: electroverse.substack.com/p/the-planet-c…
Electroverse tweet media
English
99
703
1.6K
82.4K
FortyGuard
FortyGuard@FortyGuard·
@DanielleLangWa The operational challenge is that solar efficiency degrades significantly at the extreme surface temperatures those asphalt lots reach, creating a gap between theoretical capacity and real-world output.
English
0
0
0
0
Danielle Langlois
Danielle Langlois@DanielleLangWa·
“The US has an estimated 800 million parking spaces. Most of them are uncovered asphalt sitting in direct sun, generating nothing, absorbing heat, and contributing to the urban heat island effect in every city they're in. A 2023 analysis estimated that covering existing US parking infrastructure with solar canopies could generate enough electricity to power roughly half the country.”
Give A Shit About Nature@giveashitnature

Europe's most awarded zoo just turned its parking lot into a power plant without removing any parking spaces. Pairi Daiza in Belgium covered 80 percent of its 7,000 parking spaces with 62,750 solar panels, creating one of the largest solar parking lots in Europe. The installation produces 20 megawatts at peak output, more than the entire zoo consumes. The surplus charges electric vehicles on site and sells the rest back to the grid. The parking lot still functions as a parking lot. The panels sit above the cars, shading them in summer, keeping them dry in rain, and generating electricity from space that was already paved and already occupied. No wilderness was converted. No farmland was taken. No new land was used. The US has an estimated 800 million parking spaces. Most of them are uncovered asphalt sitting in direct sun, generating nothing, absorbing heat, and contributing to the urban heat island effect in every city they're in. A 2023 analysis estimated that covering existing US parking infrastructure with solar canopies could generate enough electricity to power roughly half the country.

English
88
1.2K
4.1K
125.4K
FortyGuard
FortyGuard@FortyGuard·
@giveashitnature That measurable temperature variance also highlights how hyper-local conditions drive energy demand, making site-level environmental data critical for infrastructure planning.
English
0
0
0
0
Give A Shit About Nature
Give A Shit About Nature@giveashitnature·
On a hot July day, a single mature tree in your yard pumps somewhere around 100 gallons of water up from its roots and out through its leaves as water vapor. A mature elm with 150,000 leaves can clear that in a day. As that water evaporates off the leaf surface, it carries heat away with it, the same basic physics that makes sweat work. The air around the canopy drops measurably. The cooling effect of a single large tree transpiring 100 gallons of water is roughly equivalent to two household air conditioning units running all day. Except it runs on sunlight and groundwater, costs nothing, and has been doing it since before your house was built. A yard with mature canopy runs 5 to 10 degrees cooler than a paved or treeless yard next door. That's not a feeling. It's a physics difference you can measure with a thermometer. The urban heat island is real, and it gets worse one removed tree at a time. The best time to plant a tree was twenty years ago. The second best time is this weekend, before another hot ass July like this one comes around.
Give A Shit About Nature tweet mediaGive A Shit About Nature tweet media
English
160
2.1K
9.6K
459.1K
FortyGuard
FortyGuard@FortyGuard·
@ChrisMartzWX Attributing those trends solely to UHIE overlooks that microclimates create significant temperature variability even within dense urban grids, complicating any attempt to isolate a single driver without site-level data.
English
0
0
0
0
Chris Martz
Chris Martz@ChrisMartzWX·
This is nonsense. First, why is warming a “problem”? Would cooling be a better alternative? What is the correct temperature? Second, in the CMIP6 model runs, daytime highs and nighttime lows rise at about the same rate, though there is regional variability. The REAL reason for that trend has mostly to do with the urban heat island effect (UHIE). Look at the Tmin graphic and look at where the deep red contours are located. Those are [mostly] urban areas. That is UHIE, not greenhouse gases (GHGs).
🔰Chief Georgist Shill 🔰@BlueRepublik

This doesn’t really address the question well enough, much of the warming problem from trapped greenhouse gases occurs at night, making the cooling down process slower Summers feel hotter because there’s no break! This causes a long trend of warming for the USA and the world

English
34
155
947
19.8K
FortyGuard
FortyGuard@FortyGuard·
@Electroversenet That 23C gap illustrates why relying on regional averages fails for asset-level planning. Microclimate variability creates vastly different operational realities and risk exposures within the same city grid.
English
0
0
0
0
FortyGuard
FortyGuard@FortyGuard·
@DanielleLangWa The operational challenge is that solar efficiency degrades significantly at the extreme surface temperatures these asphalt lots generate, making site-level heat monitoring essential for accurate yield projections.
English
0
0
0
0
FortyGuard
FortyGuard@FortyGuard·
@giveashitnature That measurable five to ten degree variance is a microclimate reality that too often gets averaged out of thermal models used for infrastructure planning.
English
0
0
0
0
FortyGuard
FortyGuard@FortyGuard·
@ChrisMartzWX While Tmax reflects peak afternoon heat, Tmin trends remain critical for infrastructure planning because elevated nighttime temperatures prevent mechanical and electrical systems from cooling down, directly impacting energy demand and asset longevity.
English
0
0
0
0
Chris Martz
Chris Martz@ChrisMartzWX·
There's nothing that climate alarmists hate more than when I post graphs or graphics of daily maximum temperatures (Tmax). They will accuse me of “cherry-picking,” claiming that I need to look at the “average mean temperature” (Tavg) because that's where the real story is with regards to climate change. I have been researching / posting on climate change for almost a decade, and I am well acquainted with every trick they have in the book. And the reason why alarmists like Tavg over Tmax is because Tavg shows the big warming trends that suit their narrative while Tavg often doesn't on a station-by-station basis. But how is Tavg calculated, you might ask? Well, you take the daily Tmax measured that afternoon and daily Tmin measured that morning, add them up, and then divide them by two. Easy enough, this is just basic algebra in statistics 101. But Tmin values are highly contaminated by the urban heat island effect (UHIE). Surfaces such as asphalt, concrete, and brick have a high heat capacity and store more solar energy during the day than vegetation or bare soil. So, after sunset, this stored heat is released gradually, slowing the nighttime cooling of the urban environment. Buildings also inhibit a lot of that infrared radiation from making it back to outer space. Cities also tend to have more mechanical turbulence in the lower atmosphere because buildings increase surface roughness. In rural settings, the surface cools rapidly after sunset, but the air a few hundred or few thousand feet up doesn't. This causes what's called boundary layer decoupling, and leads to temperature inversions, especially in the fall and winter. But in an urban environment, buildings enhance turbulence and therefore vertical mixing, which brings warmer air aloft down towards the surface. Together, these prevent the air just above the ground from cooling as quickly at night, which the figure on the left shows. This effect is strongest when a site is first developed beyond pure wilderness conditions (so this affects rural and suburban environments too), but it has grown larger spatially across the global land surface because more land is being developed with time. This significantly affects Tmin trends, which is a significant (and perhaps the main) reason why Tmin (and by extension, Tavg) has gone up, at least in the mid-latitudes. In rural settings, Tmin is also affected by corn sweat (evapotranspiration off of corn that increases the vapor pressure; that is, the humidity, which means higher dew points and higher Tmin). On the right, I plotted the annual mean Tmax (red), Tavg (green), and mean Tmin (blue) for Huntsville, Alabama from 1920 to 2025. As you can clearly see, the annual average Tmax has not increased at all. The statistically significant increase in the Tavg, though, comes entirely from the even larger increase in Tmin, which is driven by the UHIE. And this is not just exclusive to Huntsville; you can see it in Fresno or Boston and virtually anywhere else that isn't purely rural and removed from cornfields. I like using Tmax because that value represents how warm (or hot) it actually gets (which is relevant to global warming) and, more importantly, it represents a well-mixed boundary layer where UHIE is minimized without having to adjust data using hypotheticals and curve fitting. Alarmists hate Tmax because it doesn't usually paint the picture of doom and gloom that gets people hype for their cause for political action.
Chris Martz tweet mediaChris Martz tweet media
English
65
485
2K
29.2K
FortyGuard
FortyGuard@FortyGuard·
@DanielleLangWa The operational hurdle is that solar efficiency degrades significantly at the extreme surface temperatures these asphalt lots generate, making thermal management a prerequisite for maximizing that potential yield.
English
0
0
0
0
FortyGuard
FortyGuard@FortyGuard·
@giveashitnature That five to ten degree variance demonstrates how microclimates create distinct operational environments, often making site-level conditions far more critical than regional averages for infrastructure planning.
English
0
0
0
0
FortyGuard
FortyGuard@FortyGuard·
@Rainmaker1973 The projected night-time temperature increase illustrates how waste heat creates a permanent artificial heat island, fundamentally altering the local microclimate and compromising both ecological stability and long-term infrastructure resilience.
English
0
0
0
0
Massimo
Massimo@Rainmaker1973·
A massive new hyperscale data center project called Stratos is planned for Box Elder County, Utah. If built, it would demand up to 9 gigawatts of electricity, more than twice the total power consumption of the entire state. But the real shock comes from the waste heat. According to Utah State University physics professor Robert Davies, the facility would generate an additional 7 to 8 gigawatts of heat, creating a total thermal output of roughly 16 gigawatts concentrated in one location. That energy release, Davies calculated, is comparable to detonating 23 atomic bombs per day in Hansel Valley, a high desert basin near the shrinking Great Salt Lake that naturally traps heat like a bowl. The project’s energy footprint would also be roughly equal to that of 40,000 Walmart Supercenters. Local temperatures could rise by about 5°F (2.8°C) during the day and a staggering 28°F (15.6°C) at night. Ecologists warn that such dramatic warming would stress an already fragile ecosystem, worsen toxic dust from the drying lakebed, and disrupt plants, wildlife, and water resources. As the backbone of artificial intelligence, data centers are essential for every AI query, image, and training run. The Stratos project now raises a critical question: Can the massive infrastructure behind AI expand without permanently transforming, and overheating, the communities and landscapes where it’s built? ["‘So much worse than I even thought’: Utah’s ‘hyperscale’ data center could create massive heat island near Great Salt Lake." The Salt Lake Tribune]
Massimo tweet media
English
97
443
640
59.7K
FortyGuard
FortyGuard@FortyGuard·
@Electroversenet That 23C gap illustrates why city-wide averages fail infrastructure planning. Two assets a few kilometers apart face fundamentally different operating realities, and treating them as a single thermal zone introduces significant blind spots in resilience modeling.
English
0
0
0
0
FortyGuard
FortyGuard@FortyGuard·
@DanielleLangWa Beyond the generation potential, shading that asphalt would significantly lower ambient temperatures, reducing the thermal load on adjacent infrastructure and lowering cooling demand for surrounding buildings.
English
0
0
0
0
FortyGuard
FortyGuard@FortyGuard·
@giveashitnature The cooling benefit is highly localized, which is why site-level temperature data is essential for understanding exactly where infrastructure and people remain exposed despite nearby canopy.
English
0
0
0
0
FortyGuard
FortyGuard@FortyGuard·
@climateaidil Legislation sets the framework, but operational resilience depends on granular data. Understanding site-level heat exposure and microclimate variability is what ultimately determines whether infrastructure adaptation strategies succeed on the ground.
English
0
0
0
1
FortyGuard
FortyGuard@FortyGuard·
@Electroversenet That 23C gap illustrates why regional averages fail infrastructure planning. Operational decisions require site-level temperature intelligence, not generalized forecasts that miss the material stress on specific assets.
English
0
0
0
0
FortyGuard
FortyGuard@FortyGuard·
@DanielleLangWa The operational hurdle is that parking lot microclimates often exceed standard solar performance specs, meaning deployment resilience matters just as much as generation capacity.
English
0
0
0
0
FortyGuard
FortyGuard@FortyGuard·
@giveashitnature That measurable five to ten degree variance is a microclimate reality that infrastructure planning often overlooks, treating heat as uniform rather than hyper-local.
English
0
0
0
0