Globalex Quant | Trading Academy

60 posts

Globalex Quant | Trading Academy banner
Globalex Quant | Trading Academy

Globalex Quant | Trading Academy

@globalexquant

🧭 Data-driven trading education & algorithmic tools. 📊 EdgeAlgo • Trade The Edge • Mind Over Market 🛡️ Education only. Trading involves risk of loss.

48 West George Street, Glasgow Katılım Şubat 2026
8 Takip Edilen1.3K Takipçiler
Globalex Quant | Trading Academy
The oil-bond negative correlation is one of the most reliable macro relationships in institutional analysis. Until it is not. Here is what happens when the correlation breaks, and what the correct response looks like.
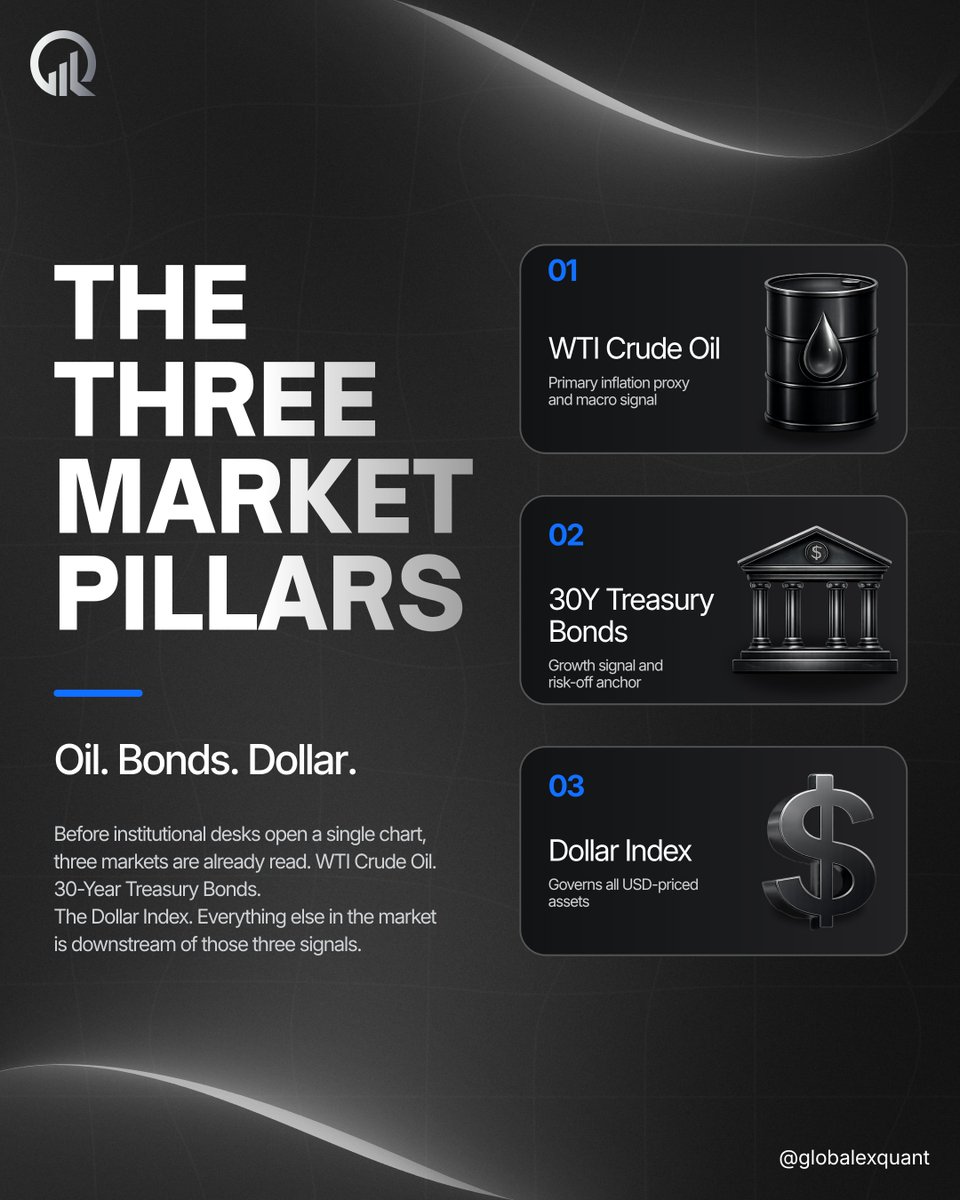
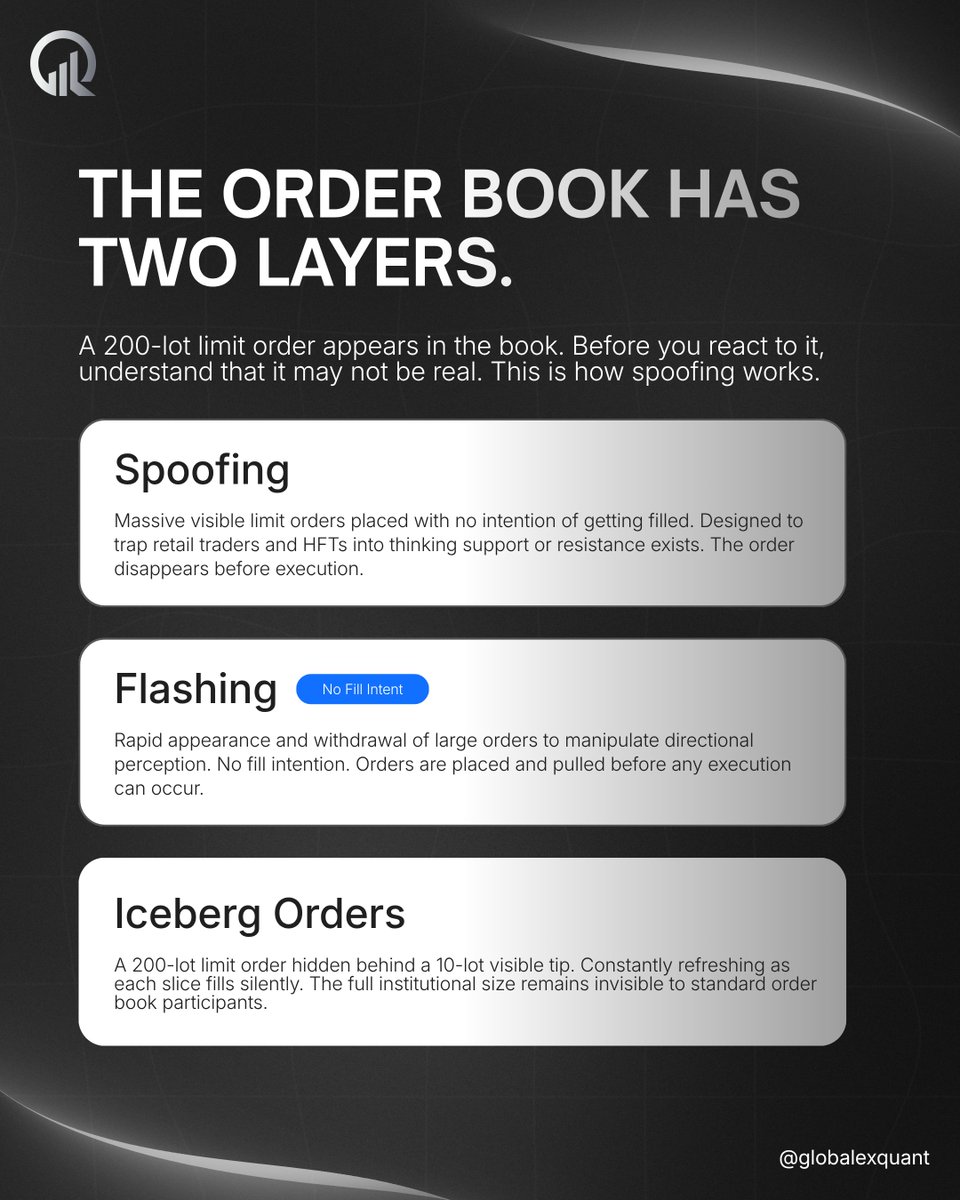
 OIL UP. BONDS DOWN. The standard negative correlation runs on yield mathematics. Rising oil signals rising inflation expectations. A fixed bond yield becomes less attractive in real terms when inflation moves against it. Institutional participants sell the back end of the bond market before the move becomes visible on an equity chart. This is the baseline relationship that macro frameworks are built around. THE PARALLEL SHIFT. 
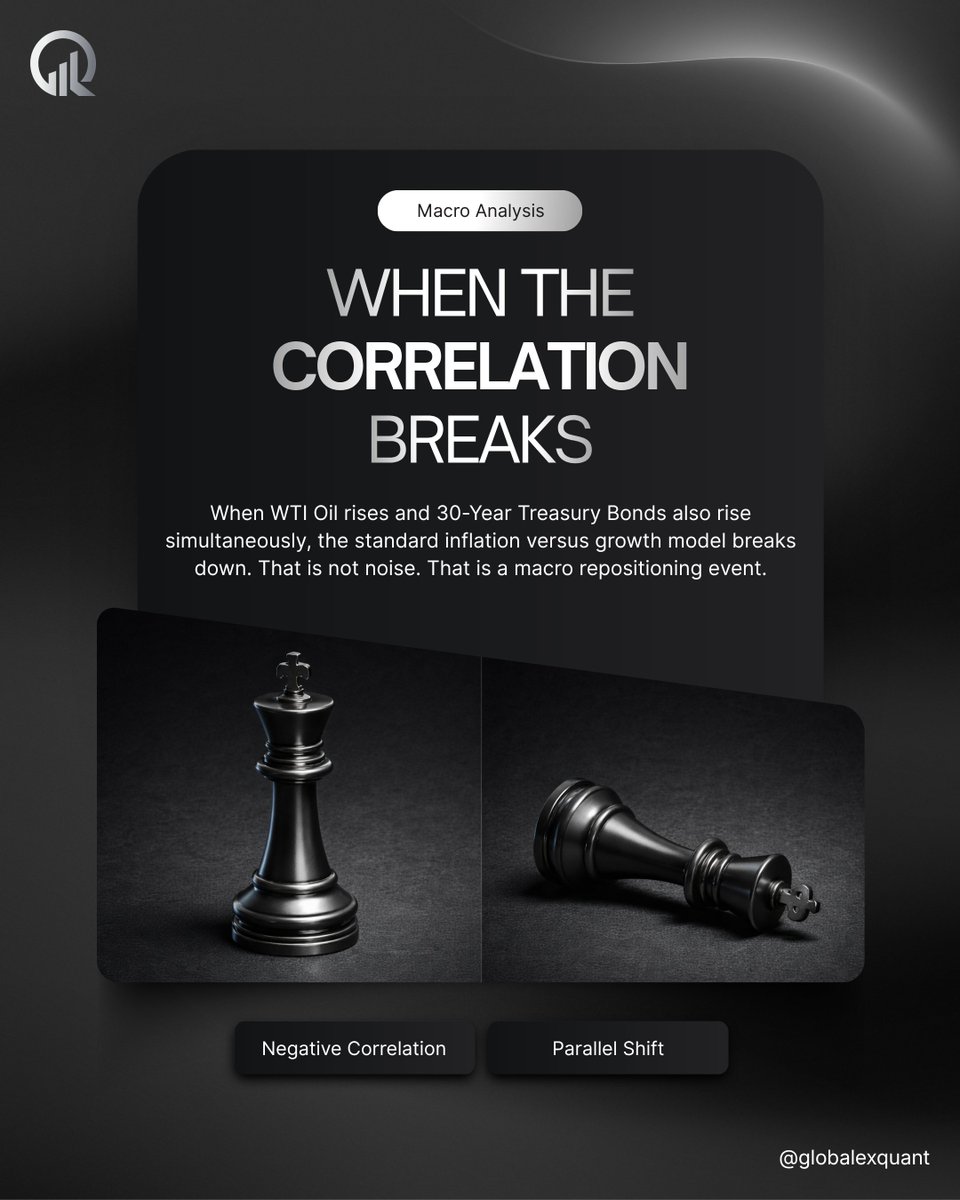
When WTI and 30-Year Treasury Bonds both rise simultaneously, that baseline breaks. Both sides of the negative correlation are moving in the same direction, which means the inflation versus growth model is no longer the dominant force in the market at that moment. Something larger is overriding it. MACRO REPOSITIONING. A parallel shift signals institutional repositioning across multiple asset classes at the same time. The inflation versus growth model has not permanently broken. It has been temporarily overridden by a force large enough to move both correlated markets in the same direction. The key distinction is that this is not noise or random divergence. It is a structural event with implications beyond the two markets directly involved. PAUSE. REASSESS. THEN ACT. Continuing to apply the standard oil-bond directional framework during a parallel shift means executing against a temporarily broken model. The correct institutional response is not to find an alternative trade within the same framework. It is to step back entirely, reassess the macro narrative from the top, and wait until the standard relationship reasserts itself before any new position is executed. Which market do you read first? Drop it in the comments. :shield: Educational content only. Not financial advice. #globalexquant #macrotrading #intermarketanalysis #institutionaltrading #tradereducation
Globalex Quant | Trading Academy tweet media
English
6
10
12
381
Globalex Quant | Trading Academy
A strong dollar signal does not mean the same thing across all forex pairs. It means opposite things depending on which group the pair belongs to. Most retail analysis treats all major pairs as a single block when a dollar signal appears. The frontend and backend classification changes that entirely. When DXY makes a significant directional move, both groups are affected simultaneously but in opposite directions. Reading them together reveals which side of the market carries more institutional momentum at that moment, and which pairs within each group are showing the largest relative displacement from fair value. Dividing any major by the Dollar Index to normalize fair value is not just a theoretical exercise. It is how you identify which pair within a group is most mispriced relative to the dollar move, and therefore where the highest-probability opportunity sits rather than trading the group as a whole. 🛡️ Educational content only. Not financial advice. #globalexquant #DXY #intermarketanalysis #institutionaltrading
Globalex Quant | Trading Academy tweet media
English
15
19
34
969
Globalex Quant | Trading Academy
Trade The Edge Master Course. Structure over pattern. Framework over feeling. Execution over impulse. Many traders have market knowledge. What they lack is a repeatable system for applying it under real conditions, with real risk, in real time. Inside the course: + The analytical framework institutions use before a single chart is opened + Intermarket structure, order flow, and volume from an institutional perspective + Execution, risk management, and trading psychology built into one cohesive system Edge is not found. It is built. The link is in the bio. 🛡️ Education only. Trading involves risk of loss. #globalexquant #tradetheedge #institutionaltrading #tradereducation #riskmanagement
Globalex Quant | Trading Academy tweet media
English
17
22
36
843
Globalex Quant | Trading Academy
Before a single chart is opened, three markets have already framed the entire session. Oil. Bonds. Dollar. Here is how the framework works. WTI CRUDE OIL WTI is the primary inflation proxy in institutional macro analysis. When crude rises, inflation expectations adjust upward across the board. Institutional desks read oil first because its direction directly determines the bond market response. Rising oil means rising yields. It is not just an energy market. It is the opening signal of the entire macro narrative. 30-YEAR ULTRA TREASURY BOND The 30-Year is the primary growth signal and risk-off anchor. Its relationship to crude oil is one of the most documented negative correlations in macro markets. When inflation expectations rise through WTI, the fixed yield on a 30-Year Bond becomes less attractive in real terms. Commercials respond by aggressively selling the back end of the bond market. Bond prices fall, yields rise, and the macro narrative shifts toward inflation and away from growth in real time. DOLLAR INDEX (DXY) The Dollar Index governs the relative value of every USD-priced asset simultaneously. Gold, Silver, Crude Oil, EUR/USD, GBP/USD. All priced in dollars. All driven by DXY movement. When the dollar strengthens, USD-priced assets fall in relative value. Dividing any market by the dollar index removes dollar distortion from the reading and reveals true fair value. This is how institutions normalize their analysis across all markets at once. HOW THE THREE PILLARS INTERACT The sequence runs in one direction. Oil rises, inflation expectations increase, commercials sell 30-Year Bonds, bond prices fall and yields rise. The Dollar Index then determines how that repositioning flows across every USD-priced asset. These three markets together form the complete macro picture that institutions read before placing a single directional trade. Which pillar do you read first? Tell us below. 🛡️ Educational content only. Not financial advice. #globalexquant #macrotrading #intermarketanalysis #institutionaltrading #tradereducation
Globalex Quant | Trading Academy tweet media
English
18
21
37
808
Globalex Quant | Trading Academy
The May Activity Contest is live on the Globalex Quant Discord server. The most active members this month get rewarded. Activity counts across four areas: engaging in conversations in general chat, sharing setups and charts in chart talk, posting in the memes channel, and helping other members by answering questions and contributing to discussions. Full prize details and the live leaderboard are in the activity-contest channel. The server link is in our bio. 🛡️ Educational content only. Not financial advice. #globalexquant #discordserver #tradingcommunity #globalexacademy #trading
Globalex Quant | Trading Academy tweet media
English
12
21
34
1.4K
Globalex Quant | Trading Academy
Price discovery is a function, not an accident. Market makers operate by continuously testing where genuine order flow is resting. Retail stop clusters at obvious structural levels, day highs, day lows, session extremes, are among the most predictable concentrations of latent market orders in the entire structure. When price sweeps those levels and immediately reverses, the reversal is the confirmation that the test found what it was looking for, or did not. Either way, the function was served. The distinction that changes how you read these moves is the difference between a level and a pool. A support or resistance line drawn on a chart implies that price will be defended there. A liquidity pool implies the opposite: it is a concentration of orders that will be consumed when price reaches it. Most retail frameworks are built around the first interpretation. The market operates on the second. The practical implication is not to avoid placing stop losses. It is to understand that predictable stop placement at obvious structural levels means your exit is visible to the participants who benefit from triggering it. Where a stop is placed relative to the liquidity pool, not just relative to the entry, is what determines whether it survives a sweep or gets taken before the move develops. 🛡️ Educational content only. Not financial advice. #globalexquant #priceaction #marketstructure #orderflow #institutionaltrading
Globalex Quant | Trading Academy tweet media
English
12
23
37
1.3K
Globalex Quant | Trading Academy
Comment "GQ" below, and we will send you all the details about the tournament directly. The Globalex Quant Trading Tournament is open. The top five finishers each receive a trading evaluation account. Places six through ten receive 10,000 Globalex Quant EXP points. Full rules, structure, and entry details are available in the Globalex Quant Discord server. A tournament is one of the few environments where execution under pressure can be tested against real competition rather than a personal benchmark. The leaderboard does not care about your analysis. It reflects what you actually did when the conditions were live. All information is in the Discord server linked in our bio. 🛡️ Educational content only. Not financial advice. #globalexquant #tradingtournament #tradereducation #institutionaltrading #trading
Globalex Quant | Trading Academy tweet media
English
14
18
31
1.8K
Globalex Quant | Trading Academy
Globalex Quant | Trading Academy@globalexquant·
A limit order placed at a technically valid level can still be a structurally incorrect entry. The level is not the problem. The timing is. The Falling Knife The core error is treating a price level as sufficient justification for an entry. When a market is in pure directional momentum, the absence of any opposing institutional activity means there is nothing to stop the move. A limit order filling into that environment does not enter a reversal. It enters a continuation. The analysis behind the level may be sound. Without confirmation that commercial participants are actually present and absorbing the flow at that level, the entry has no structural basis for expecting a turn. Stop Orders after Absorption The difference between this approach and the falling knife is sequencing. The entry does not anticipate absorption. It waits for it to appear in the volume data first, then triggers in the direction that absorption implies. By that point, the reversal momentum is already present. The stop order does not create the position ahead of confirmation. It captures a move that has already begun showing evidence of institutional participation. Limit Orders for Exhaustion Exhaustion carries a different signature than absorption. The signal is not high volume absorbing aggressive flow. It is low volume combined with a small candle body, indicating that directional pressure has simply run out of participation. Buyers or sellers are no longer willing to continue at that price. A limit order placed into that signal is not fading momentum. It is entering at the point where momentum has already ceased, which is a structurally different proposition entirely. 🛡️Educational content only. Not financial advice. #globalexquant #orderflow #tradeexecution #institutionaltrading #tradereducation
Globalex Quant | Trading Academy tweet media
English
10
17
31
1.5K
Globalex Quant | Trading Academy
Globalex Quant | Trading Academy@globalexquant·
Losing $2,000 in a single trade is painful. Watching an account sit completely flat for two weeks costs nothing and feels worse. Drawdown Duration The psychological mechanism behind duration is different from depth because it has no clear endpoint. A sharp loss is an event with a before and after. A flat period has neither. Every day without a winning trade adds weight to the same unresolved question: is the edge still there? That uncertainty does not spike and resolve. It compounds. Decision-making degrades not through a single emotional reaction but through the slow erosion of confidence in the framework itself. By the time a valid setup appears, the trader executing it is already compromised. Drawdown Depth A sharp loss is visible on a statement and finite by definition. The account absorbed it, the number moved, and the recovery path is calculable. That clarity, even when the figure is significant, gives the brain something concrete to process. It is an event that ended. Duration never clearly ends. It simply continues until it does not, and there is no structural signal for when that transition occurs. The practical implication is that monitoring drawdown only in dollar terms misses the metric that most consistently precedes impulsive decisions. Time in drawdown is a psychological variable that deserves the same structured management as capital exposure. 🛡️ Educational content only. Not financial advice. #globalexquant #tradingpsychology #riskmanagement #trademanagement #drawdown
Globalex Quant | Trading Academy tweet media
English
10
11
16
511
Globalex Quant | Trading Academy
Globalex Quant | Trading Academy@globalexquant·
Price alone does not tell you whether a market is cheap or expensive. Value does. And value is always relative. The Correlation Gold and Silver share the same pricing denominator, the US dollar, and the same sector classification, precious metals. That shared foundation is not incidental. It means that under normal market conditions, both assets respond to the same macro inputs: dollar strength, real yield movements, and inflation expectations. When they move together, the correlation is functioning as expected. When they diverge, that divergence carries information. The Signal The divergence itself is what institutional participants monitor. When Silver extends to a new high and Gold remains flat, the relative value between the two has shifted. Gold has not moved because of any fundamental change in its own supply or demand picture. It has not moved because the macro environment turned against it. It has simply lagged a correlated market that shares its drivers. That lag, measured and confirmed, is the signal. The entry is not based on a pattern on the Gold chart. It is based on what the Silver chart is communicating about Gold's current value relative to where it should be. Leading vs. Lagging The institutional entry logic here is consistent with how commercials approach all correlated market pairs. The market that has already moved carries more risk and less edge. The market that has not yet repriced carries the opportunity. Entering the lagging market while the leading market is already extended means the entry is closer to value, the stop is tighter relative to the potential move, and the directional thesis is confirmed by an external source rather than by the chart of the market being traded. Copper is Different Copper belongs to the metals sector by classification but operates on entirely separate fundamentals. Its price reflects global industrial output, infrastructure demand, and manufacturing activity. It is not a dollar-denominated store of value in the way Gold and Silver are. Including Copper in a precious metals correlation analysis without accounting for that distinction produces a misleading read. It is a global growth indicator that happens to trade alongside precious metals, not a member of the same internal value framework. 🛡️Educational content only. Not financial advice. #globalexquant #intermarketanalysis #gold #silver #institutionaltrading
Globalex Quant | Trading Academy tweet media
English
6
8
12
332
Globalex Quant | Trading Academy
Globalex Quant | Trading Academy@globalexquant·
A support line drawn on a chart reflects a price. It carries no information about what happened at that price or why the market responded to it. Volume structure answers a different question entirely. Not where price has been, but where transactions actually concentrated, and what that concentration tells you about the likely behavior of institutional participants when price returns to that level. Point of Control The Point of Control is not simply a busy price level. It is the level where the largest volume of two-sided agreement occurred within a given profile. Both buyers and sellers were present in size, and the market spent more time facilitating trade there than anywhere else in the range. When price revisits the POC after moving away from it, it is returning to the most contested zone in the structure. That context changes how the reaction at that level should be interpreted compared to any arbitrary line drawn on a chart. High Volume Nodes High Volume Nodes form where institutional limit orders absorbed sustained directional pressure. The price did not continue because the orders resting there were large enough to halt it. That is a materially different mechanism from support and resistance as most retail frameworks define it. An HVN is not a line. It is a zone where the market has already demonstrated that passive institutional size was present. Whether that size will be present again on a subsequent visit is a separate question, but the structure provides context that a price action model does not. Low Volume Nodes Low Volume Nodes are the structural gaps between areas of institutional interest. When price enters an LVN, there is no significant resting order flow to slow it down. The market moves through these zones quickly because there is no two-sided activity to facilitate. Identifying LVNs in advance tells you where price is likely to travel with minimal friction, which has direct implications for target placement and the management of open positions. 🛡️ Educational content only. Not financial advice. #globalexquant #orderflow #volumeanalysis #marketstructure #institutionaltrading
Globalex Quant | Trading Academy tweet media
English
5
8
11
439
Globalex Quant | Trading Academy
Globalex Quant | Trading Academy@globalexquant·
Analysis can be right. Execution can still fail. The gap between the two is almost never technical. Most trading errors that show up as execution mistakes originate earlier, in the decision-making process that happens under pressure. Identifying the pattern after the fact does not prevent it from recurring. That requires working on the structure that produces the decision, not just reviewing the outcome. Mind Over Market is a 4-week psychology program built around that problem. It was developed by Rudolf, a psychology and mindset specialist, and covers the full cycle from pattern recognition to real-market application. The program moves through four structured stages. The first stage focuses on identifying the emotional patterns, fear responses, and cognitive habits that influence trading behavior before they translate into execution errors. The second stage builds the regulation tools: structured routines, emotional discipline frameworks, and the ability to hold a logical read under conditions that would normally trigger a reactive response. The third stage applies those tools in live market conditions, developing composure under pressure rather than in theory. The fourth stage establishes a tracking and review process for psychological progress, which is a dimension most traders never measure at all. The result is not confidence as a feeling. It is a decision-making process that holds its structure when conditions are unfavorable, when the account is in drawdown, when the setup is ambiguous, and when the market is doing exactly what it needs to do to make a disciplined response difficult. The link to enroll is in the bio. 🛡️ Educational content only. Not financial advice. #globalexquant #tradingpsychology #mindovermarket #tradereducation #riskmanagement
Globalex Quant | Trading Academy tweet media
English
7
8
12
360
Globalex Quant | Trading Academy
Globalex Quant | Trading Academy@globalexquant·
Lose 70% of your trades and still be profitable. That is the promise of a 1:5 risk-reward ratio. Here is what that promise costs. The ratio itself contains no information about the quality of the setup. A 1:5 target on a low-confluence trade carries the same label as a 1:5 target on a high-confluence one. Treating them as equivalent is where the model breaks down. Win rate is not a fixed number that a strategy produces. It fluctuates with market conditions, session timing, and the quality of the read behind each entry. Assuming a stable 20 to 30% across all conditions is an oversimplification that the live market does not honor. The deeper issue is not the losing streak itself. It is what consecutive losses do to position sizing decisions on the trades that follow. A trader who has taken six losses in a row does not approach the seventh setup with the same objectivity they started with. The statistical expectation has not changed. The human executing it has. That gap between expected behavior and actual behavior is where the mathematical edge, if it existed, gets destroyed. High R:R strategies create a specific type of psychological contract: accept frequent small losses in exchange for occasional large wins. That contract sounds rational when written down. It becomes very difficult to honor when the losses arrive in clusters, the account is in sustained drawdown, and the large win that was supposed to balance the equation has not appeared in weeks. The strategy does not fail. The psychological contract does. Confluence-weighted positioning changes the relationship between analysis and execution entirely. When macro factors such as bond market positioning, dollar strength, and sector internals align toward a high-probability read, size increases. When fewer factors confirm, size decreases. Some setups do not meet the threshold at all and are passed on. The result is that position size becomes a direct expression of analytical confidence rather than a fixed variable applied uniformly to every trade regardless of quality. 🛡️ Educational content only. Not financial advice. #globalexquant #riskmanagement #tradingpsychology #institutionaltrading #tradereducation
Globalex Quant | Trading Academy tweet media
English
6
7
10
277
Globalex Quant | Trading Academy
Globalex Quant | Trading Academy@globalexquant·
A trade is up $2,000. Then it retraces to $800. No money has been lost. The position is still profitable. And yet the psychological response is identical to a $1,200 realized loss. That is not a weakness in discipline. It is how the human brain processes unrealized equity movement. This is floating equity trauma, and it is one of the least discussed reasons why technically sound traders make irrational decisions. Floating Equity When a trade moves into profit, the brain begins to register that unrealized gain as existing money. It does not matter that the position is still open. The moment a retrace begins, the brain calculates the difference between the peak and the current level and processes it as a loss. A trader watching $2,000 compress back to $800 is not experiencing a gain of $800. They are experiencing a loss of $1,200. The distinction between unrealized and realized does not register emotionally the way it does analytically. P&L Trauma Repeated exposure to this pattern creates a conditioned response. Traders begin to exit positions early to avoid the psychological discomfort of watching open profit retrace, even when the original trade thesis is still intact. Over time, this pattern systematically reduces the quality of trade outcomes. Winners get cut before they develop. The risk-reward profile of the strategy deteriorates not because the analysis is wrong, but because the psychological response to floating equity overrides the execution plan. Loss Response The practical consequence is a behavioral pattern that looks like poor discipline from the outside but is rooted in a cognitive mechanism that operates independently of rational decision-making. Recognizing it is the first step. The structural solution is not mental toughness. It is removing the source of the emotional interference entirely. Moving the stop loss to break-even as quickly as the trade structure allows eliminates open risk. When there is no open risk, there is no floating equity trauma. The psychological pressure that drives premature exits and irrational decisions disappears because the conditions that create it no longer exist. The goal is not to feel nothing. The goal is to build a trade management framework where the most damaging psychological responses have no environment to operate in. 🛡️Educational content only. Not financial advice. #globalexquant #tradingpsychology #floatingequity #trademanagement #institutionaltrading
Globalex Quant | Trading Academy tweet media
English
9
8
15
262
Globalex Quant | Trading Academy
Globalex Quant | Trading Academy@globalexquant·
Risk in trading does not disappear because a trade looks promising. It disappears only when the market structure removes the original reason your stop loss existed. A common mistake is adjusting stops based on emotion or temporary price movement. Moving a stop too early can expose a position to normal market noise. Moving it too late leaves unnecessary capital at risk. Break-even management sits in the middle of those two extremes. Break-Even First Once price has moved far enough to invalidate the initial risk scenario, some traders choose to adjust their stop to the entry price. This effectively removes the original downside exposure from that position. The key point is timing. The adjustment is typically made after the market confirms structural progress, not simply because the trade is currently profitable. Open Risk Eliminated When the stop is moved to the entry price, the original trade risk is no longer active. At that point, the position becomes a trade where the potential outcomes are limited to either no loss or a positive result if the move continues. This type of adjustment does not guarantee profits, but it can reduce the amount of capital exposed to adverse moves. Psychological Impact Risk management also affects decision-making. When the initial downside risk is removed, traders often find it easier to follow their plan rather than reacting emotionally to short-term volatility. The purpose of break-even management is not to avoid losses entirely. Its role is to protect capital once the market has already validated part of the trade idea. 🛡️ Education only. Not financial advice. #globalexquant #riskmanagement #tradingdiscipline #tradingeducation
Globalex Quant | Trading Academy tweet media
English
10
11
16
408
Globalex Quant | Trading Academy
Globalex Quant | Trading Academy@globalexquant·
An order book shows visible liquidity, but what appears on the screen does not always represent the full picture. Modern electronic markets operate with different order types and execution behaviors that can make the visible order book only a partial representation of actual market intent. Understanding this distinction is important when interpreting large orders appearing near price. Spoofing Spoofing refers to situations where large visible orders appear in the order book but are removed before execution. The presence of these orders can temporarily influence how other participants interpret supply and demand around certain price levels. Because these orders are cancelled before being filled, the visible liquidity does not necessarily represent real trading interest. Flashing orders In fast electronic markets, large orders can appear and disappear extremely quickly. These orders may be placed and withdrawn within milliseconds, sometimes altering short-term perception of order book pressure without resulting in actual trades. This behavior can make short-term order book signals difficult to interpret without broader context. Iceberg orders Some participants use iceberg orders to execute large positions while revealing only a small portion of the total order size. As each visible portion is filled, a new portion appears, while the full size remains hidden. This mechanism allows large participants to interact with the market while limiting the impact of their full order size on visible liquidity. Because of these mechanics, the order book often contains both visible liquidity and hidden liquidity, and interpreting it requires understanding how different order types operate within electronic markets. 🛡️ Education only. Not financial advice. #globalexquant #orderflow #marketmicrostructure #orderbook #tradingeducation
Globalex Quant | Trading Academy tweet media
English
10
10
18
317
Globalex Quant | Trading Academy
Globalex Quant | Trading Academy@globalexquant·
Most trading communities share setups and call them education. The Globalex Academy Discord is built differently. It is a space for traders who are done with surface-level content and want to engage with institutional concepts at a serious level. Live trading sessions with Eric. Real-time market analysis across Gold, NASDAQ, Oil, and more. Weekly livestreams covering key levels, session structure, and execution logic sourced directly from the educational framework we publish here. Over 4,000 members are already inside. If that is the level you are working toward, the link is in our bio. 🛡️Educational content only. Not financial advice. #globalexquant #tradingcommunity #tradereducation #livetradingsessions #traders
Globalex Quant | Trading Academy tweet media
English
7
9
15
453
Globalex Quant | Trading Academy
Globalex Quant | Trading Academy@globalexquant·
Traders watch price charts. Institutional participants watch something else entirely. Before a major move appears on any chart, there is a macro sequence already in motion. Understanding that sequence is what separates reactive trading from analytical positioning. WTI Crude Oil functions as the primary inflation proxy in institutional intermarket frameworks. It is not just an energy market. It is a signal. When oil prices rise consistently, inflation expectations across the broader economy tend to adjust upward with them. Energy costs feed directly into production, transportation, and consumer pricing. Sustained moves in crude are among the first indicators that institutional participants monitor when assessing the macro environment. Fixed income markets respond to real yield expectations, meaning the return on a bond after adjusting for inflation. When inflation expectations rise, the real value of a fixed bond yield compresses. A $100 bond generating a 5% annual return does not deliver 5% in real terms if inflation is moving toward 10%. The purchasing power of that return declines. This is basic yield mathematics, and institutional participants price it in before most retail traders have noticed the move in oil. This is the mechanism behind one of the most documented negative correlations in macro analysis: WTI Crude Oil versus 30-Year Ultra Treasury Bonds. When one rises, selling pressure on the other tends to follow. Not as a rule that works every single time without exception, but as a structural tendency that has been central to institutional macro positioning for decades. The sequence that institutional analysts monitor: Oil prices rise and inflation expectations adjust upward. The real yield on long-duration Treasury Bonds compresses against rising inflation. Holding long-duration bonds becomes less attractive in real return terms. Selling pressure builds on the back end of the bond market, specifically the 30-Year. Understanding this relationship does not require predicting the future. It requires reading the macro environment as it develops and recognising which markets are signalling what before the move is already priced in. This is the foundation of intermarket analysis. And it is where institutional positioning begins. 🛡️ Educational content only. Not financial advice. #globalexquant #macrotrading #crudeoil #inflation #institutionaltrading
Globalex Quant | Trading Academy tweet media
English
6
7
9
296
Globalex Quant | Trading Academy
Globalex Quant | Trading Academy@globalexquant·
Price structure is not uniform. Certain price levels carry more structural significance than others, and understanding which ones tend to attract the most activity is a core part of reading intraday markets. Day High / Low The day's high and low represent the most immediate boundaries of the current session's price range. These levels are visible to all participants and frequently act as reference points for directional decisions. Price interaction with these extremes often produces measurable responses in order flow. Asia High / Low The Asian session establishes the initial range of the trading day during a period of comparatively lower liquidity. The highs and lows formed during this window are observed by participants in subsequent sessions, particularly as European markets open and liquidity expands significantly. London High / Low The London session introduces a substantial increase in participation. The levels established during this session often serve as structural anchors for the US session that follows, particularly when price revisits these zones during the later hours. Overnight High / Low Levels formed during overnight trading are less visible to participants who focus exclusively on regular session hours. These extremes can represent areas where resting orders have accumulated, making them structurally relevant when price returns to test them. Price tends to travel between these structural extremes rather than moving randomly. Identifying which level is being targeted at any given point provides context for interpreting order flow and market behavior. 🛡️ Education only. Trading involves risk of loss. #globalexquant #marketstructure #liquiditylevels #orderflow #priceaction
Globalex Quant | Trading Academy tweet media
English
7
7
9
278