GoldFish Charts

6.2K posts

GoldFish Charts banner
GoldFish Charts

GoldFish Charts

@GoldFishCharts

Gold charts & market data analyst. Lifelong obsession with charts. Searching all charts nautical & golden for that pot of gold.

DownUnder Katılım Nisan 2025
870 Takip Edilen12.8K Takipçiler
Sabitlenmiş Tweet
GoldFish Charts
GoldFish Charts@GoldFishCharts·
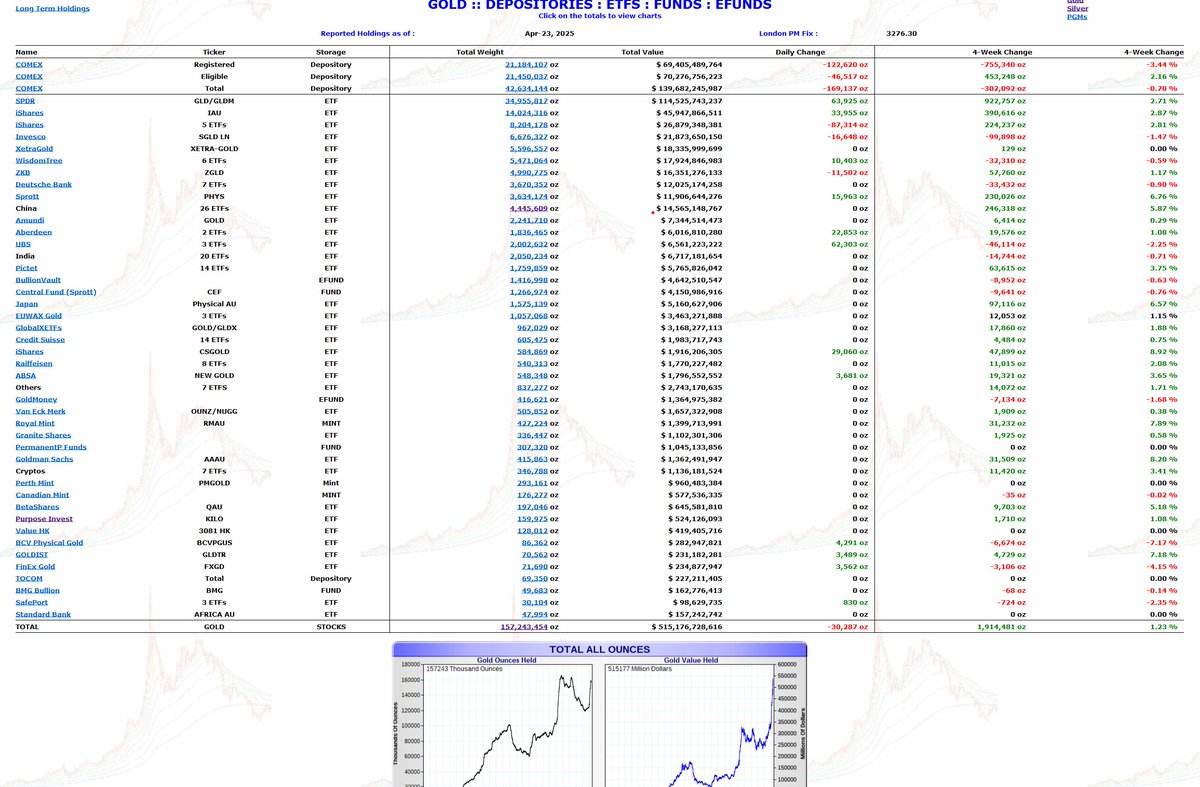
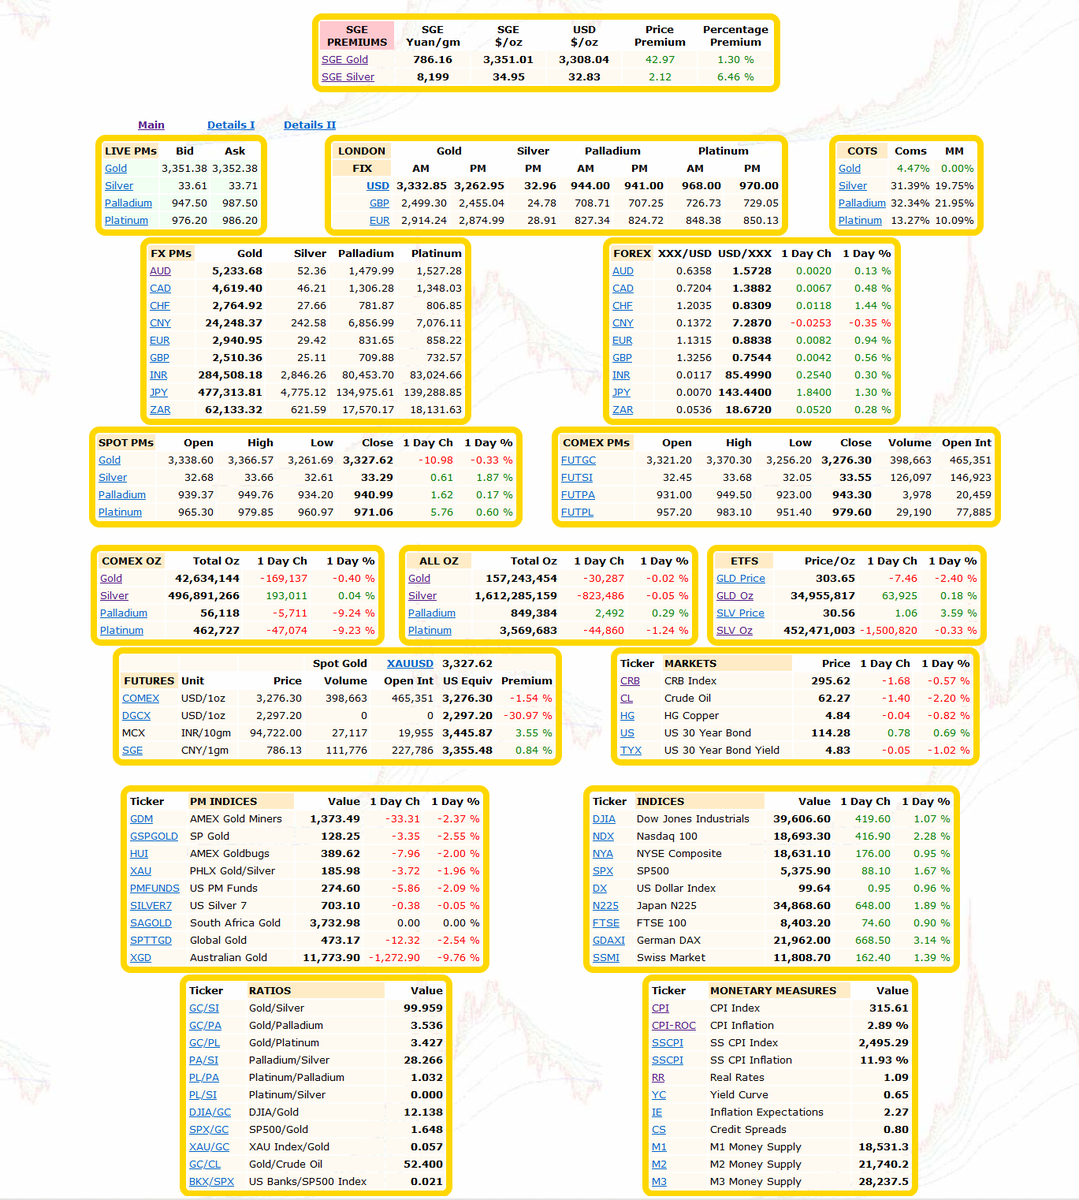
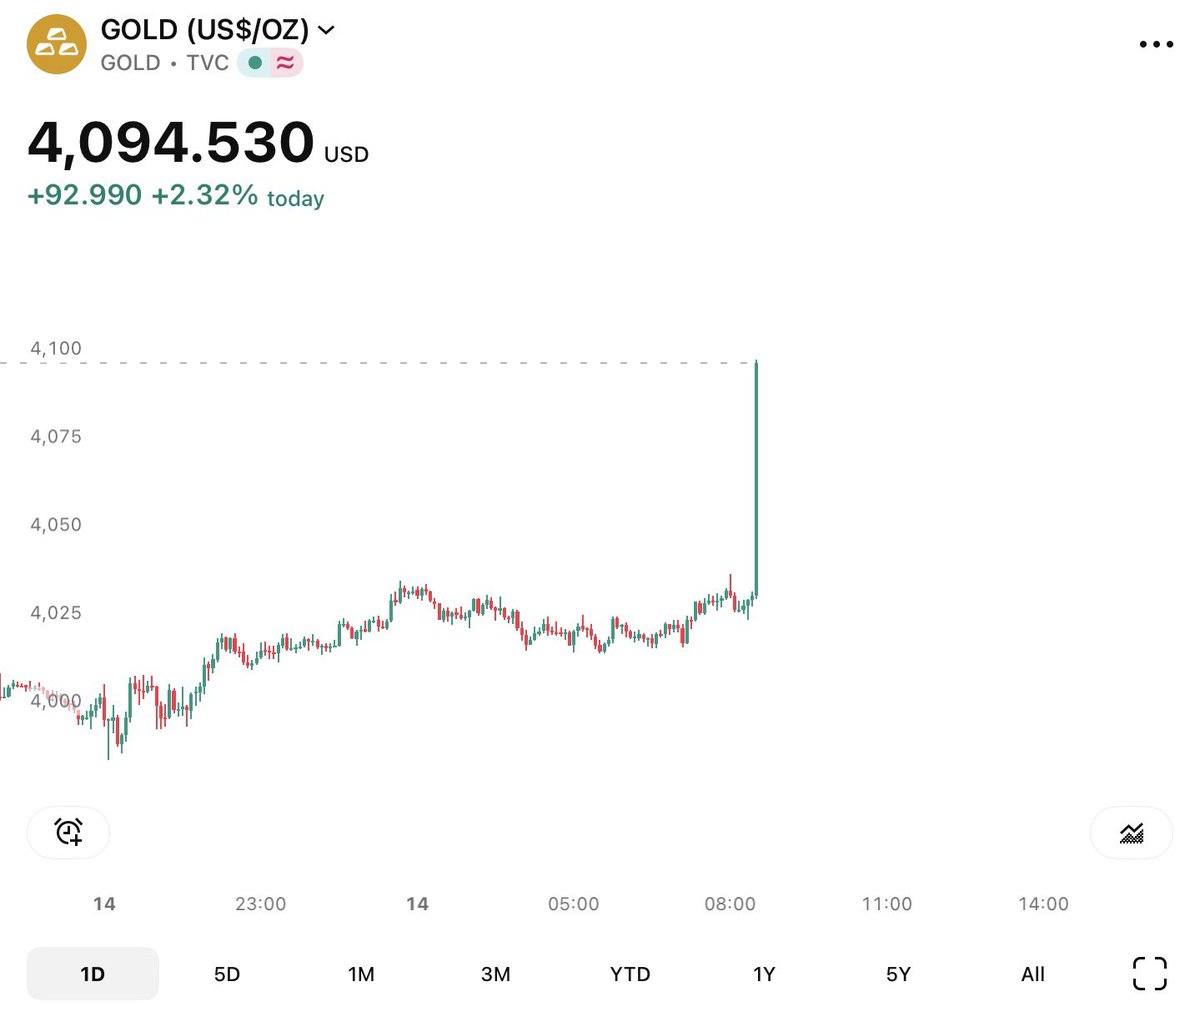
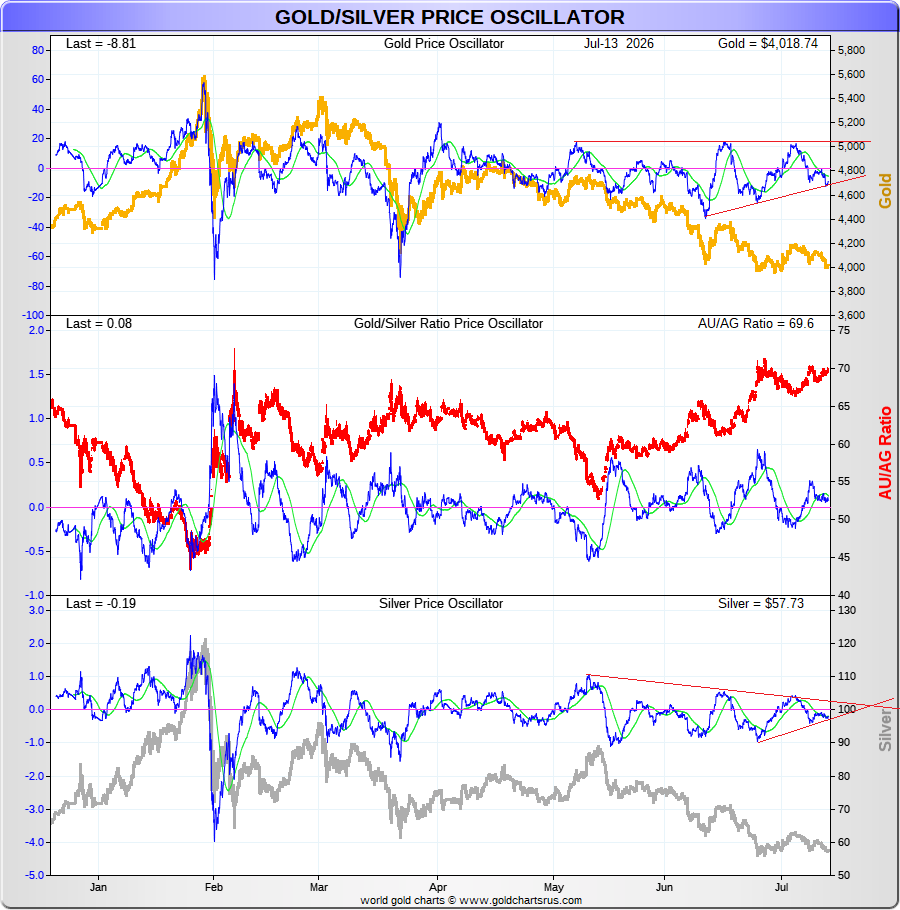
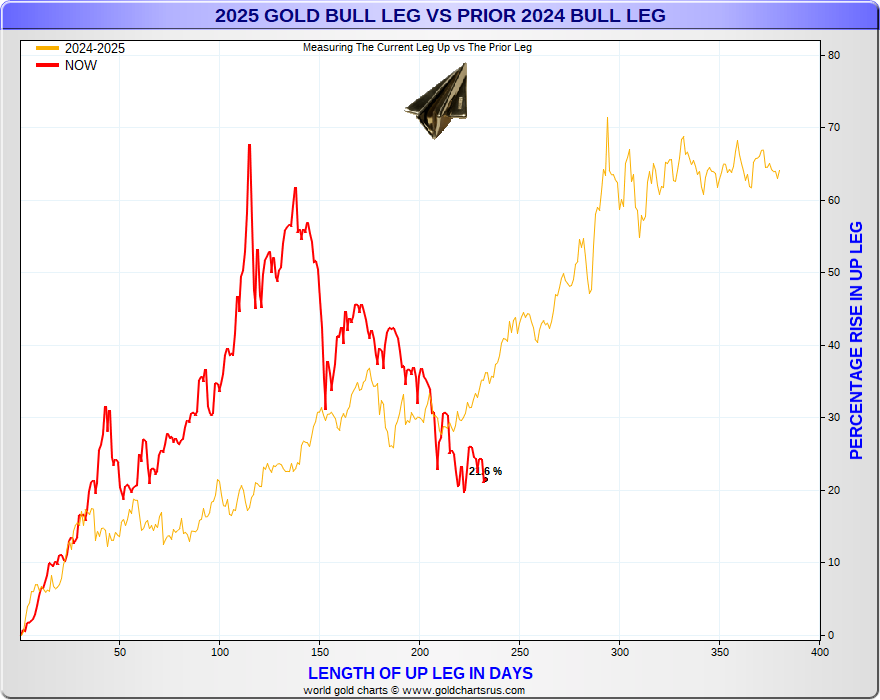
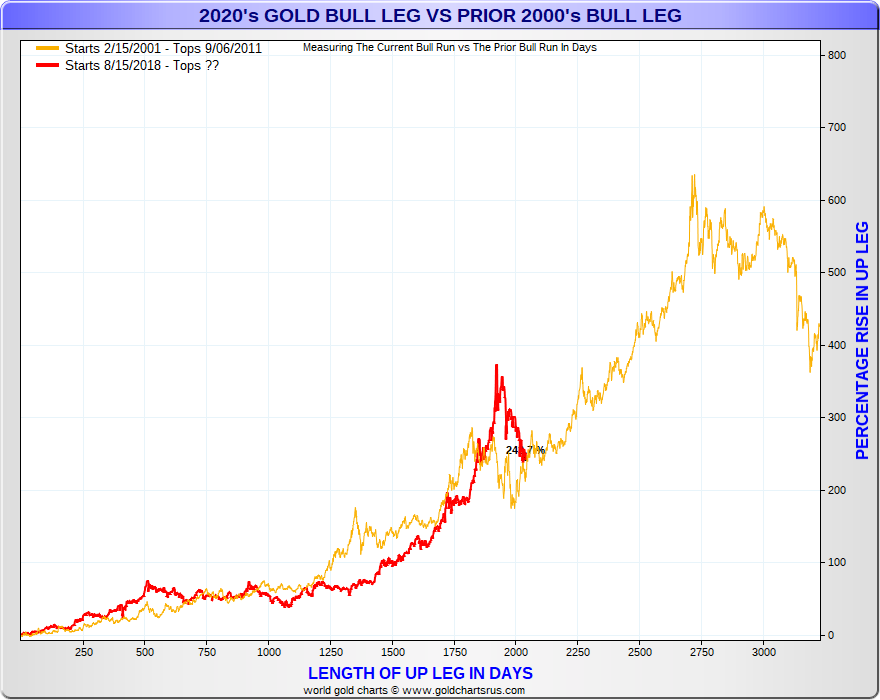
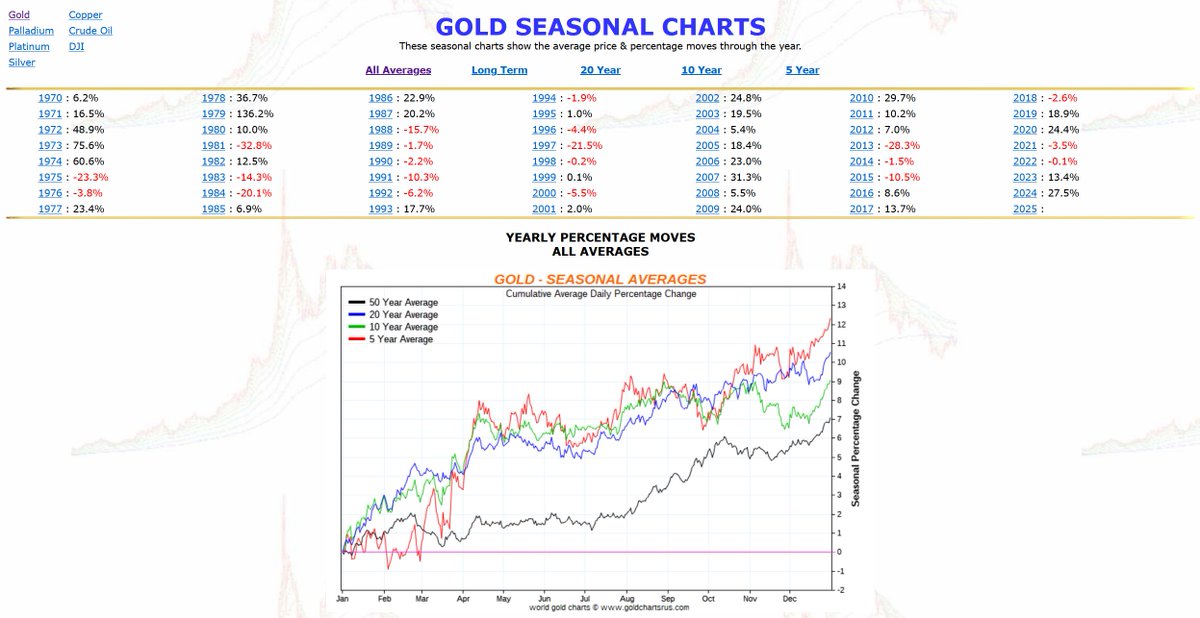
All these charts and 1000's more available on my website goldchartsrus.com for the price of a coffee. Over 75,000 charts on 8,500 pages dedicated to gold, precious metals & financial markets. The website is old school built in php/html on notepad & an old XP box. It is not HTTPS but is entirely safe to use. It will never be updated nor replaced & you will find many charts here that you won't find anywhere else on the web. The website has been designed around online databases updated intraday/dailyweekly/monthly that allow all the 1000's of charts to update. It shows one man's obsession with gold & historical data & the ability to write charts in code to show unique insights. With so many charts to view you will find out why I perceive charts as golden conveyors of information. A picture is worth a thousand words & a charts shows a lifetime of prices.
GoldFish Charts tweet mediaGoldFish Charts tweet mediaGoldFish Charts tweet mediaGoldFish Charts tweet media
English
5
15
124
36K
GoldFish Charts
GoldFish Charts@GoldFishCharts·
To my mind we have entered an inflationary period that will last for many years. Cyclewise it is due & same as past wars, resets & financial meltdowns it's part of this stage. The US is passing the hegemony across to China & as such the USD fades slowly whilst the CNY rises slowly . This effect can be seen in all past periods where the empire fades & passes the baton across. As such with the Chinese not wanting the monetary side of the hegemony & instead to use gold as balance in trade, the world must shift from a USD centric world to a gold centric world. My thesis here is that the value of the gold float has to rise up to replace the part of the USD float that existed & that the USD float is huge & in the many trillions. Gold is already well on it's way & moving along this path & will take time to fill that position. What with gold's value of the world's free float rising as the USD falls there will be a strong move up in the gold price. We are seeing this already. As such as gold moves up to 10k & then 20k etc the valuation metric that gold represents globally will flow down the chain to all other metals & base metals & also to energy & commodities & so on. That we are on the verge of a repricing era where all other prices move up in response. This was clearly visible in the 1970's where with the oil shock came an inflationary shock & all commodities/costs/prices rose in tandem & response. So as gold moves up to 10k I expect all other commodities to follow suit. This happening whilst the USD weakens. As such it will be a highly inflationary period & we have already started the move into it. Also to push on this more will be the market meltdowns, economy weakening & monetary printing that will push the effect further. The current political rhetoric where strength is used to imply control of market forces is a farcical game of illusion that will fail as these markets show us that the emperor is wearing no clothes. You may play your game but I will watch the markets unfold. :) @GoldFishCharts
GoldFish Charts tweet media
English
0
1
1
435
Konstantin
Konstantin@Konstantin15637·
The chance is high. It happened before always and each administration makes statistic what they need. But let’s play out out like inflation comes down , who cares. Rate cut is what US economy needs now. If they bring peace back to Gulf region like it was before March , inflation will go down remarkably .
English
1
0
0
44
GoldFish Charts
GoldFish Charts@GoldFishCharts·
PM Growth The Last 150 Days
GoldFish Charts tweet media
English
0
1
4
1.1K
GoldFish Charts
GoldFish Charts@GoldFishCharts·
I like the probability that the coming run will price the 100% level similar to the 1980 run. Currently at $16k
GoldFish Charts tweet media
English
1
7
39
3.5K
GoldFish Charts retweetledi
Rashad Hajiyev
Rashad Hajiyev@hajiyev_rashad·
Gold might be repeating November 2022 scenario where it broke out after 8-month tiring grind lower and more than tripled in price thereafter. I do not think gold is going to stop even at $7k. Gold bugs now deserve $10k...
Rashad Hajiyev tweet media
English
36
27
389
23K
GoldFish Charts
GoldFish Charts@GoldFishCharts·
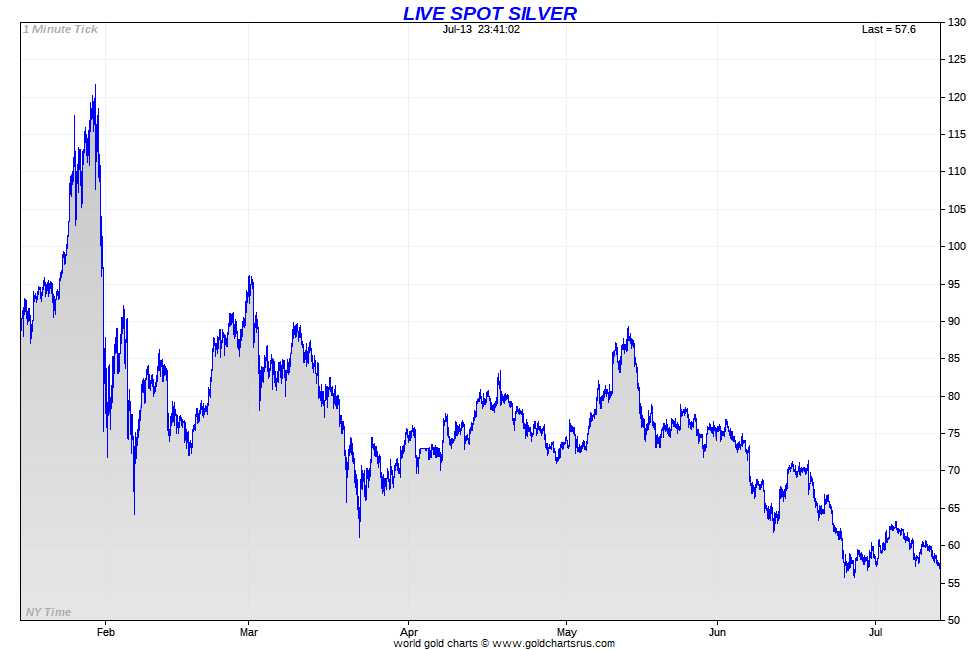
Testing for a bottom. Do we go lower or is the bottom in?
GoldFish Charts tweet mediaGoldFish Charts tweet mediaGoldFish Charts tweet mediaGoldFish Charts tweet media
English
11
2
28
2.3K
GoldFish Charts retweetledi
bob coleman
bob coleman@profitsplusid·
This video may be one reason why China is tightening restrictions on trading and margin. Trying to cap speculation and build a more regulated market environment. Unfortunately, we are seeing the consequences of little regulation over the physical precious metals markets in the USA. Lower prices could temporarily pull the tide out and show which industry participants are exposed. For those storing metals in structured products or through dealers, please read your contracts, ask tough questions, and reduce counterparty risk. This is an industry with little transparency.
David Morgan@silverguru22

China’s Biggest Gold Market COLLAPSES: $20B Vanishes Overnight, 100,000 ... youtu.be/j92yw0JUf_I?is… via @YouTube

English
5
3
64
14.8K
GoldFish Charts retweetledi
History Content
History Content@HistContent·
A Roman drinking cup in the British Museum turns green in reflected light and glowing red when lit from behind. The secret, discovered only decades ago, is gold and silver nanoparticles, genuine nanotechnology built 1,700 years before anyone had a word for it.
English
71
961
6.4K
221.4K
GoldFish Charts retweetledi
Rashad Hajiyev
Rashad Hajiyev@hajiyev_rashad·
Gold vs Gold's daily RSI breakout! This is perhaps the most important chart of the 2026. Back in August 2025, gold broke out from a 4-month formation and gained 70% within 6 months. I believe, gold is about to repeat similar price action and here is why: Back in August 25, 2025 gold's daily RSI broke out and then 3 days later gold broke out from a 4-month contracting triangle. On July 7, 2026 gold's daily RSI broke out and held at retest. I believe, chances are very high that breakout from a 5.5-month formation materializes early next week...
Rashad Hajiyev tweet media
English
27
69
479
40.4K
GoldFish Charts
GoldFish Charts@GoldFishCharts·
Buy Gold & Prosper
David Bird (ASX Trader) B.Ed, CFTe@ASX__Trader

The S&P 500 has never delivered above average returns after these 18 year cycle peaks over the last 100 years. History doesn't repeat perfectly, but it often rhymes. Go back to 1900s, then every 18 years after that, and a remarkable pattern emerges. • 1918: Around a 30% decline. • 1936: More than a 55% crash. • 1954: Five years of dead money. • 1972: Nearly a 50% crash. • 1990: Around 20% total return over the following five to seven years. Positive, but still below the long term average. • 2008: More than a 50% crash. Not once over the last century has this point in the cycle delivered above average long term returns. Now ask yourself... Do you really think it's a coincidence that the Gold-to-Dow ratio is sitting on major support seen only a handful of times in history? Do you think it's a coincidence that the Buffett Indicator is at the highest level ever recorded, the Shiller P/E is approaching dot-com extremes, and almost every major valuation metric is flashing red? Or do you think this time is different because of AI? Investors said the same thing during the dot-com boom. They said it when automobiles transformed the economy. They said it when radio arrived. They said it again when television changed the world. Every generation believes a new technology has rewritten the rules. It never does. Technology changes. Human psychology doesn't. Markets move in cycles. Valuations matter. The COVID decline wasn't a true secular bear market. It lasted only weeks before unprecedented stimulus pushed markets to new highs. The 2022 decline was painful, but it wasn't the kind of prolonged wealth destruction seen in 1929, 1973 or 2008. Most investors today have never lived through a genuine secular bear market. When one eventually arrives, it has a way of humbling people very quickly. History never guarantees the future. But ignoring over 100 years of evidence because "this time is different" has rarely ended well.

English
1
2
19
2.8K
GoldFish Charts retweetledi
Lukas Ekwueme
Lukas Ekwueme@ekwufinance·
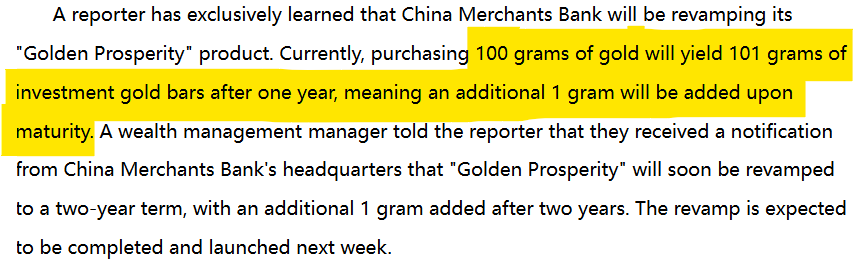
China is incentivizing long‑term gold holdings via interest on gold deposits. Chinese culture is already deeply involved in gold investments; now interest on gold deposits has been introduced: - ~0.3% flexible - ~1% 1‑year term Interest is paid in gold and is easily accessed via online banking. The “no yield” era for gold is over. Gold has already outperformed the S&P since 2000 by 90%. Adding 1% annually and assuming it holds would add another 30% to that outperformance. China is borrowing gold trust tested over millennia and putting it at the center of their financial system.
Lukas Ekwueme tweet media
English
17
79
412
51.7K
GoldFish Charts
GoldFish Charts@GoldFishCharts·
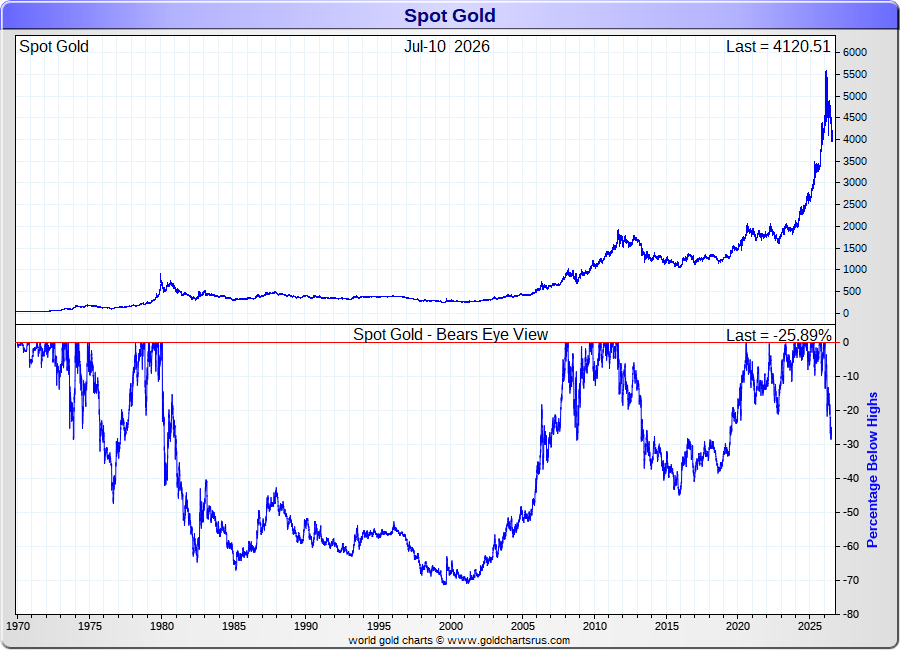
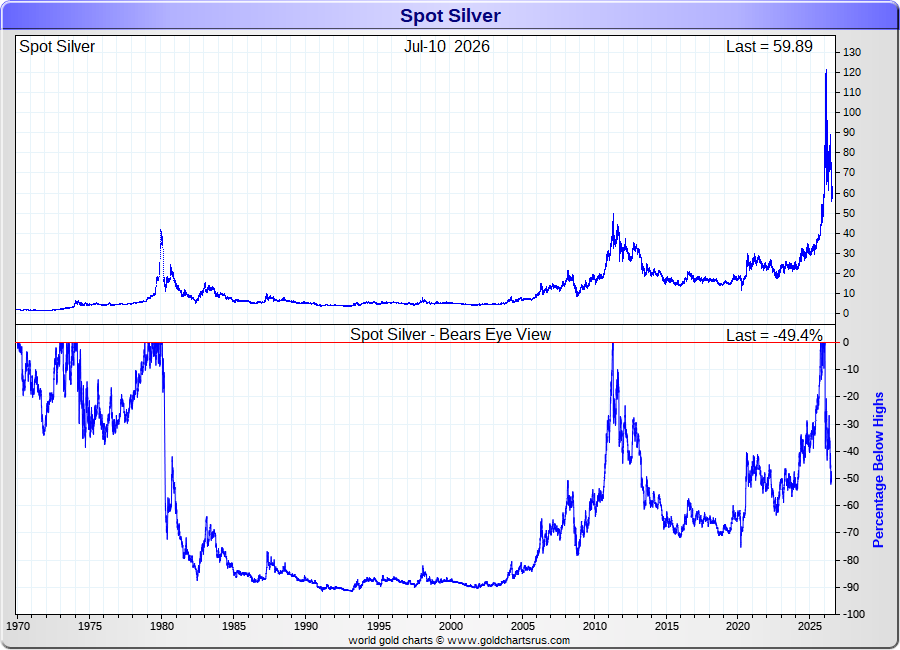
Price Declines For Gold/Silver The Bird's Eye View Gold down 25.89% Silver down 49.4%
GoldFish Charts tweet mediaGoldFish Charts tweet media
English
2
5
23
2.3K
GoldFish Charts
GoldFish Charts@GoldFishCharts·
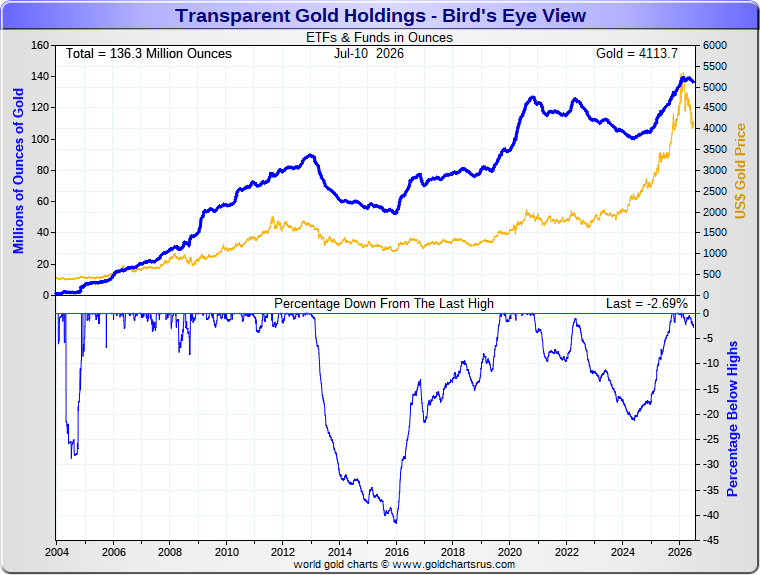
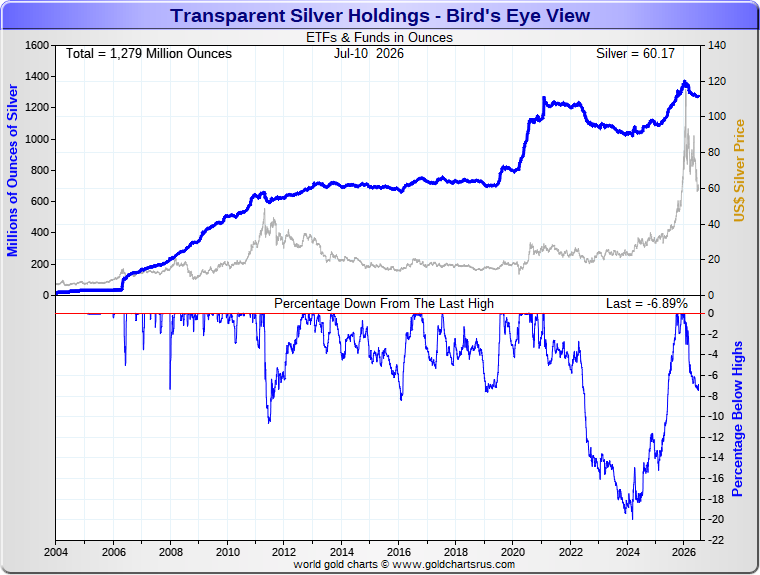
ETF Flows for Gold/Silver The Bird's Eye View Gold ETFs/Funds down 2.69% Silver ETFs/Funds down 6.89% Across the precious metals universe it was the price that was dumped & not the physical nor the stocks. Game on!
GoldFish Charts tweet mediaGoldFish Charts tweet media
English
2
4
29
2.2K