Here's the caption:
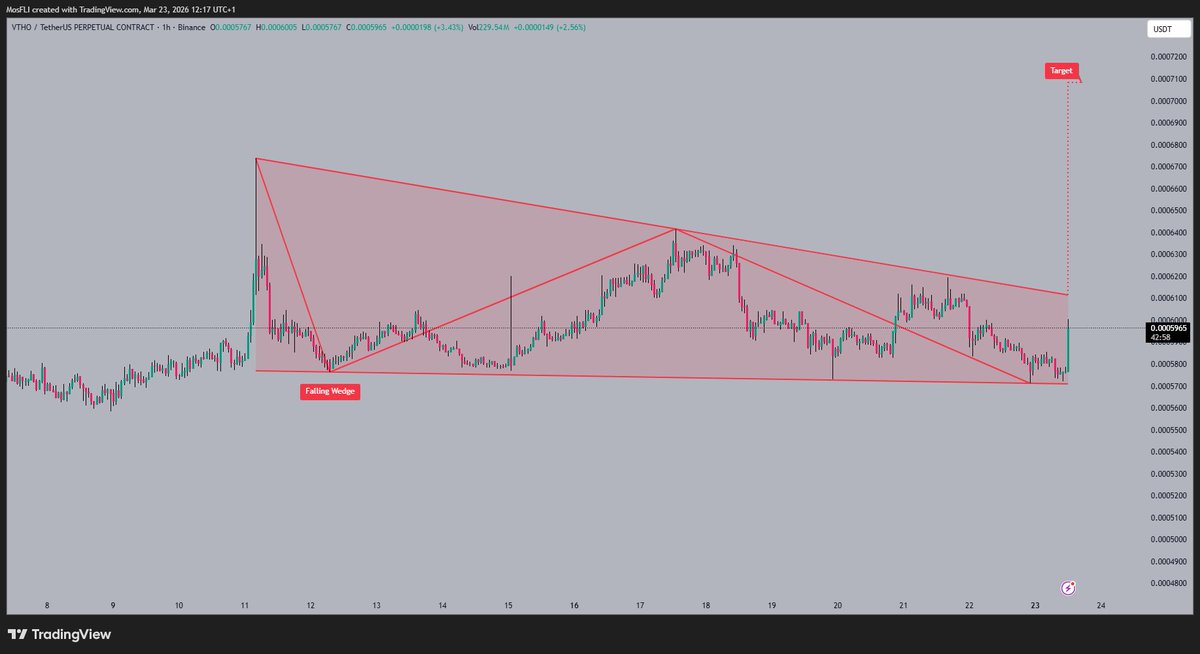
#VTHO is currently trading at 0.0005965 within a falling wedge pattern 🧐. The falling wedge suggests a potential bullish reversal 🐂 upon a breakout from the resistance line. A successful breakout could target the 0.0007200 level as the next significant resistance 🎯.
Patience is key when waiting for confirmation of a pattern breakout before entering a trade 🧘.
#VTHO#crypto#trading#altcoin
The price of #LDO has broken out 🚀 from a falling wedge pattern and is currently trading at 0.2944. The falling wedge is a bullish formation 🐂 that suggests a potential trend reversal. The next target for #LDO is around 0.3020 which could be a good place to take profits 💰.
#LDO#crypto#trading#altcoin
#XRP is currently trading at the 1.37 level, showing some consolidation 🧐. A falling wedge pattern can be observed which is typically a bullish signal 🐂. The next target for #XRP is around the 1.44 level, based on the chart.
A breakout from a wedge pattern needs confirmation from volume and other indicators ✅.
#XRP#crypto#trading#altcoin
Recent Price Action Overview
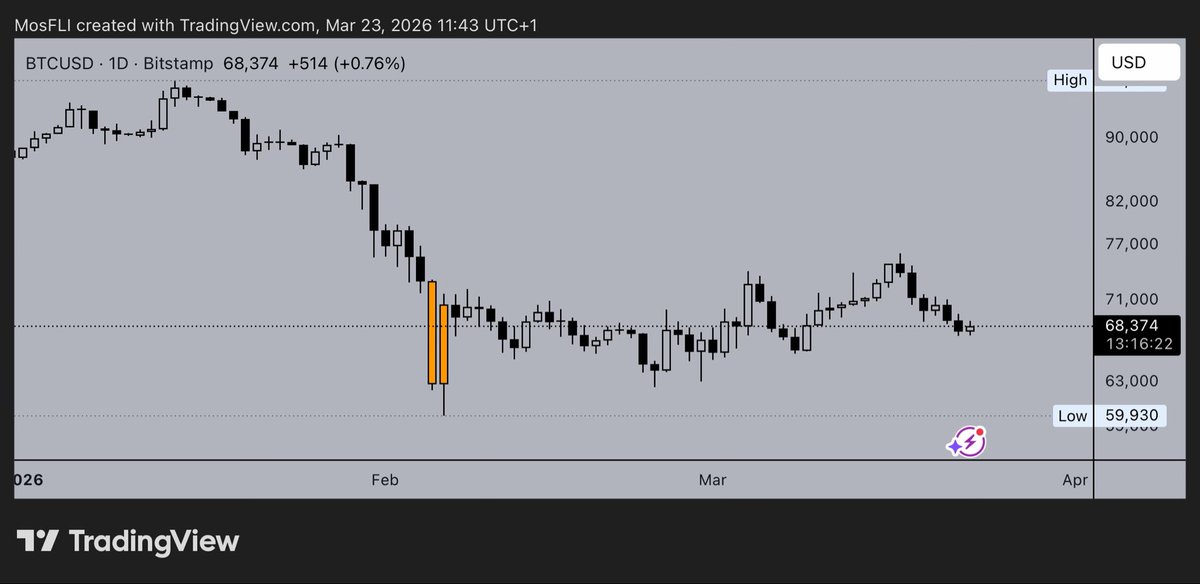
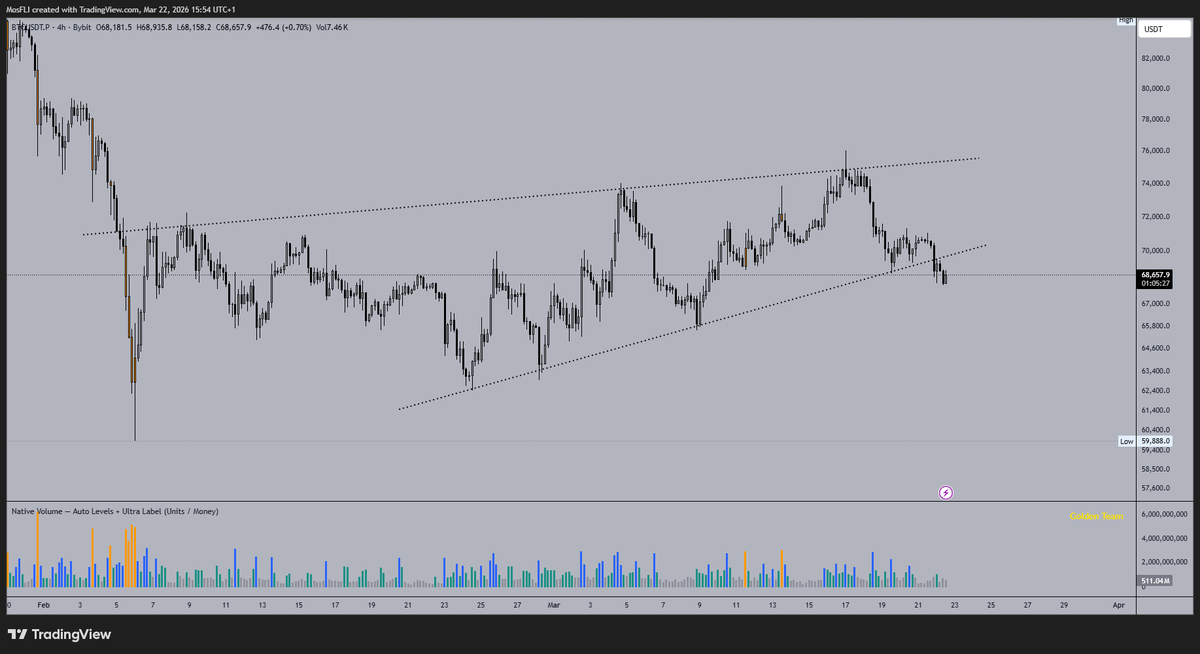
- Overall trend: #Bitcoin appears to be in a downtrend since peaking higher earlier (likely in late 2025 around $120k+ based on broader context from analyst reports). The chart displays a series of lower highs and lower lows, with a notable capitulation-style wick low around $59,930 (labeled as the cycle low so far).
- Current position: Price has recovered somewhat from that low, forming a consolidation/range between roughly $60,000–$71,000, with the latest candles showing a bounce but stalling near $68k–$71k. The big orange (bullish?) candle in the dip area suggests strong buying interest at lower levels, possibly a short squeeze or accumulation.
- High/Low extremes: Session high aligns with recent attempts to reclaim higher ground, but rejection is evident. The broader view shows a descent from ~$90k+ levels earlier in the year down to the mid-60k/mid-70k range now.
### Technical Analysis Insights
- Support levels: Immediate support around $68,000–$71,000 (current zone and prior pivot). Deeper supports at $63,000–$65,000 or the prior low near $59,930–$60,000 (critical; a break could accelerate downside toward $50k in more bearish scenarios per some analysts).
- Resistance levels: Overhead resistance near $71,000–$74,000 (recent highs and gamma clusters mentioned in reports), with stronger barriers at $74,500–$79,000 (key Fib zones or prior lows turned resistance).
- Pattern/Indicators: The chart shows volatility with long wicks, suggesting indecision. Broader market commentary indicates neutral-to-bearish short-term signals (e.g., sell on some oscillators, bearish divergence on RSI in places), but potential for a local bounce if supports hold amid whale accumulation and fading sell pressure.
- Context: This fits a post-2025 peak correction phase. Bitcoin hit all-time highs around $126,000 in late 2025, followed by a bear market drawdown. Current levels (~45% off peak) align with historical cycle bottoms forming around 12–13 months after peaks, potentially setting up for recovery later in 2026 if macro conditions improve (e.g., ETF inflows, institutional rotation).
### Broader Analyst Sentiment (March 2026)
Analysts are mixed but lean cautious near-term:
- Bullish views: Some see $110k–$120k (primary) or even $140k–$150k (optimistic) if cycle extends with risk-on sentiment and adoption. Recent +9% weekly recoveries and decoupling from equities hint at potential upside to $78k–$80k on positive catalysts like Fed signals.
- Bearish views: Risks of further downside to $60k, $50k, or lower if supports fail (e.g., bear flag patterns, descending channels). March could feature consolidation or a bounce before renewed selling.
- Consensus range: Near-term trading often cited around $68k–$75k–$80k, with year-end 2026 targets varying widely ($90k+ in recovery scenarios).
Bitcoin remains highly volatile—watch for macro events (e.g., Fed decisions) and whether it holds $68k or reclaims $71k+ decisively. This is not financial advice; always do your own research and consider risk management. If you have a specific aspect (e.g., indicators, targets, or timeframes) you'd like deeper analysis on, let me know!
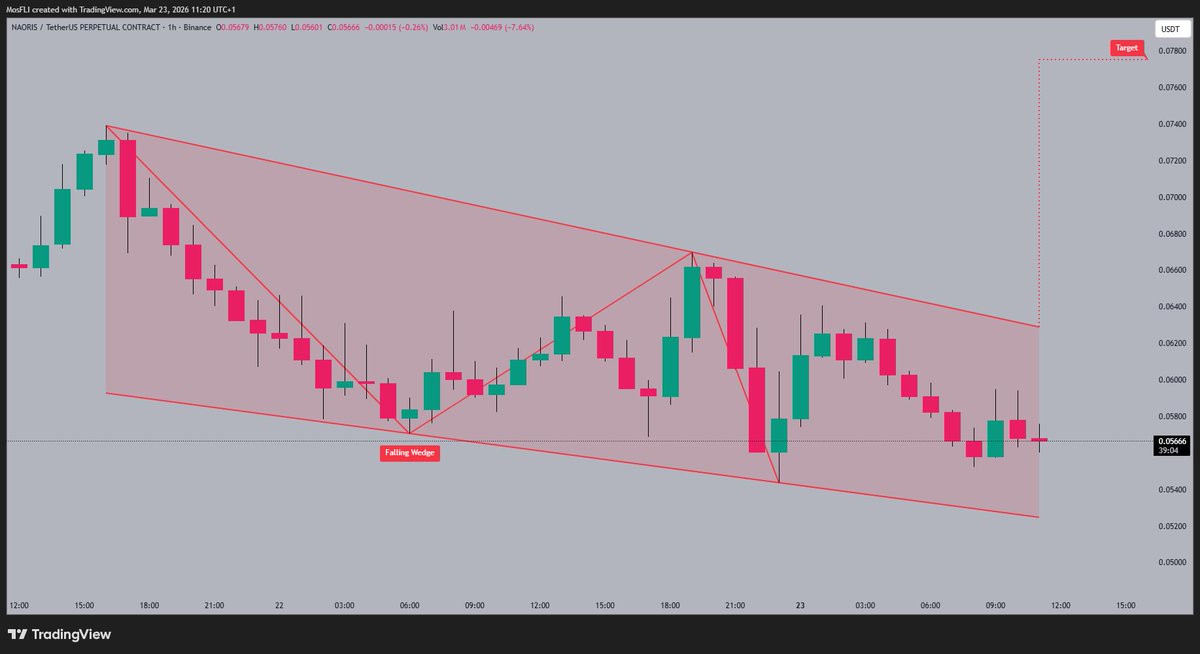
#NAORIS is currently trading within a falling wedge 📉 pattern, indicating a potential bullish reversal. The price action is consolidating 🤝 near the lower trendline of the wedge, which could serve as a springboard for an upward move. If #NAORIS breaks out of the wedge, the next target is around 0.07800 🎯.
Patience is key when waiting for confirmation signals during pattern breakouts 🧘.
#NAORIS#crypto#trading#altcoin
#BERA is currently testing the lower boundary 🧊 of a falling wedge pattern. The falling wedge is a bullish pattern 🐂 indicating a potential breakout to the upside. If the price breaks out, the target is around 0.5650 🎯.
A breakout from a falling wedge can lead to swift gains if you manage your risk 🔑.
#BERA#crypto#trading#altcoin
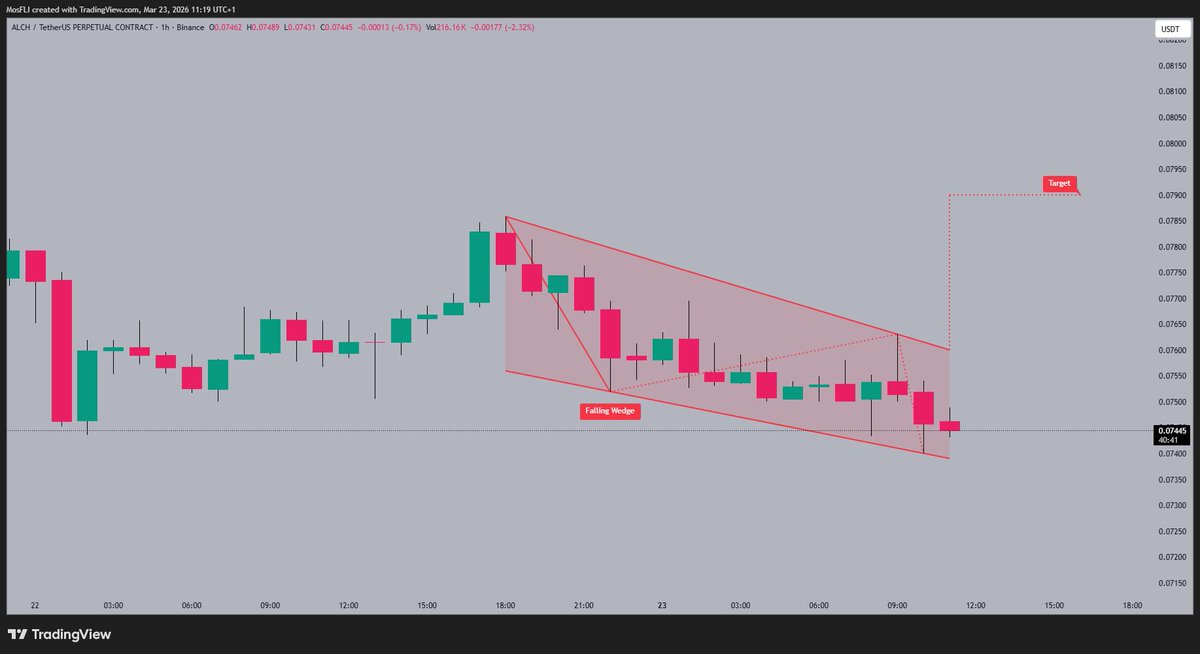
#ALCH is currently testing the lower trendline of a falling wedge 📉 pattern. The falling wedge is typically a bullish formation, suggesting a potential breakout upward 🚀. The next target is around 0.07900 if the breakout occurs with strong volume 🐂.
#ALCH#crypto#trading#altcoin
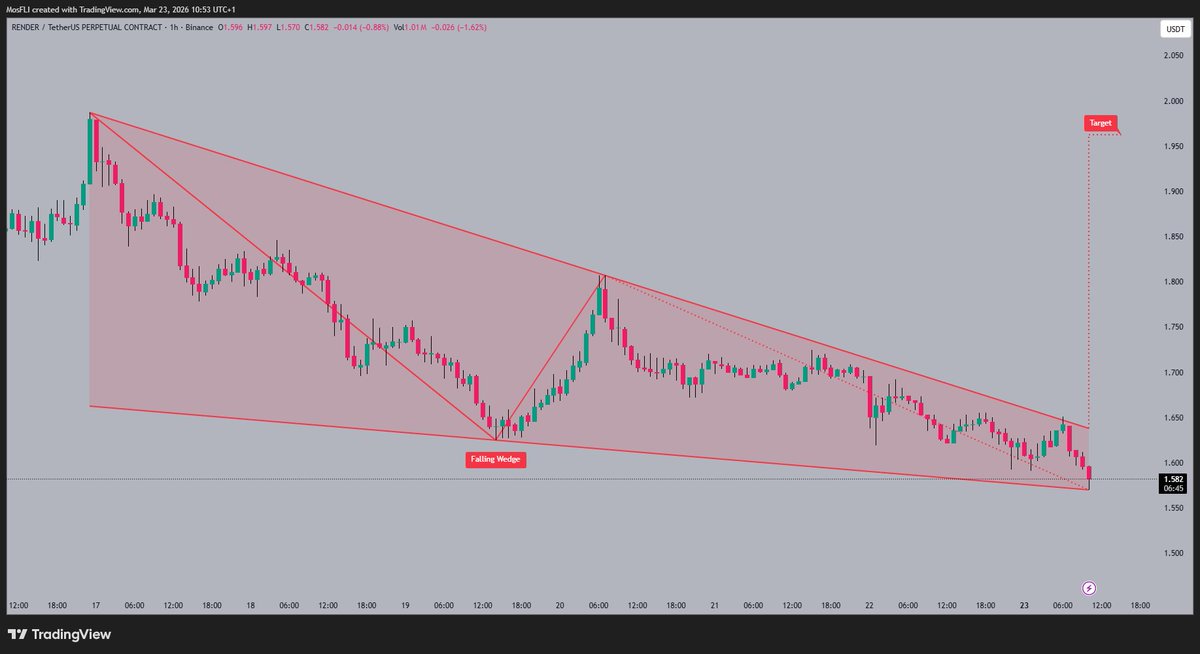
#RENDER is currently testing the lower trendline of a falling wedge 📉 pattern. This pattern is typically bullish 🐂, often leading to upward breakouts. A potential target after the breakout is around 1.980 🎯.
Patience is key 🔑 when waiting for the breakout confirmation to avoid false signals.
#RENDER#crypto#trading#altcoin
#T is currently testing the lower band of a falling wedge 📉 pattern. This falling wedge has formed after a sharp selloff showing potential for reversal. If the wedge breaks to the upside 🚀, the target would be near 0.006500.
A breakout from a falling wedge can be explosive and requires patience for confirmation ✅.
#T#crypto#trading#altcoin
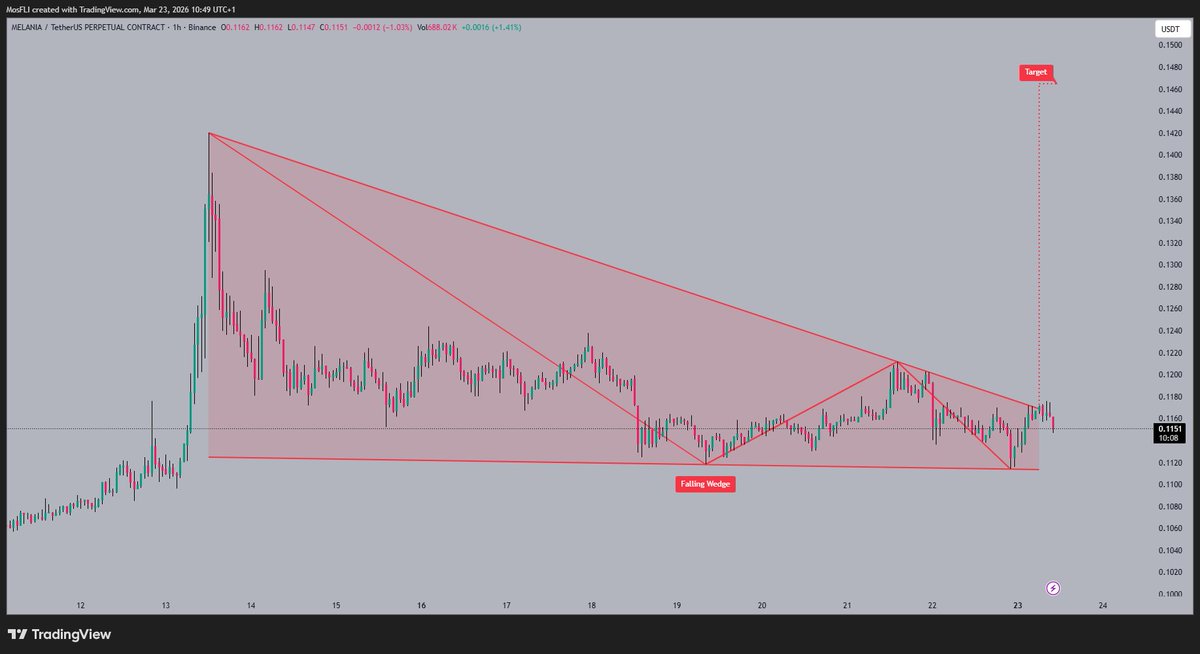
#MELANIA is currently trading around 0.1150 🤝 within a defined pattern. The chart shows a falling wedge pattern 📐 suggesting a potential bullish reversal. The next target after a breakout is projected near 0.1480 🎯.
#MELANIA#crypto#trading#altcoin
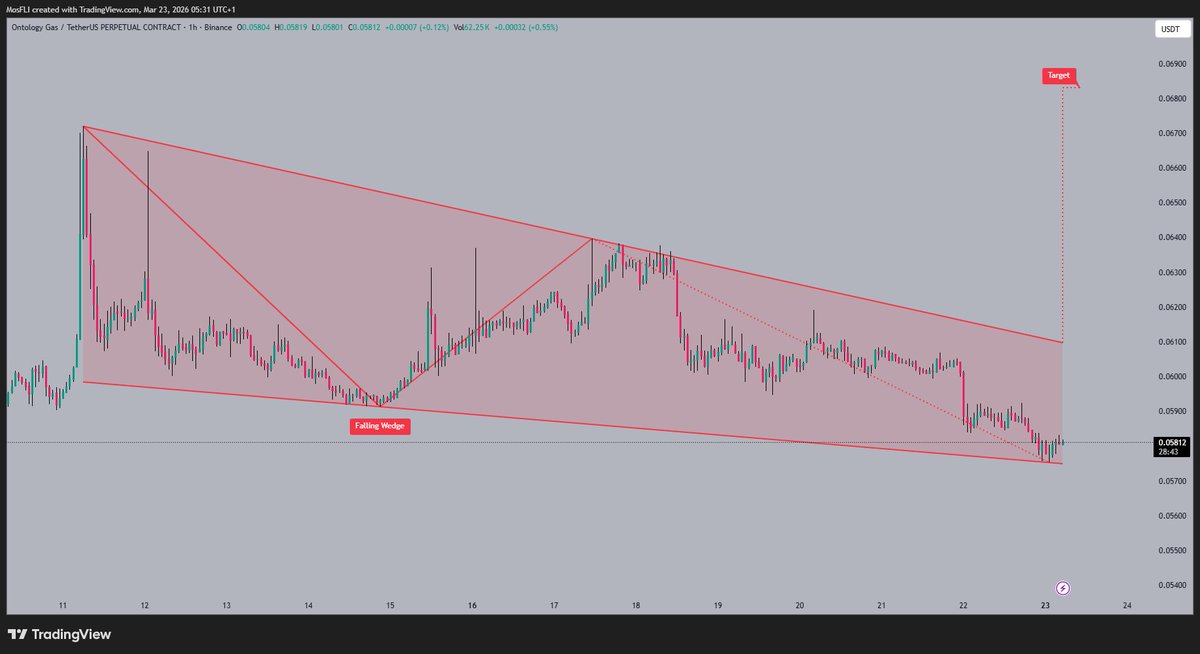
#ONG testing the lower trendline of a falling wedge on the hourly! Classic bullish reversal brewing – currently ~$0.059, bounce incoming? Breakout confirmed could launch to 0.06900+ fast! Patience pays: wait for volume + close above resistance Who's loading up? Reply with your setup! #ONG#Crypto#Trading#Altcoin#BullishReversal#OntologyGas
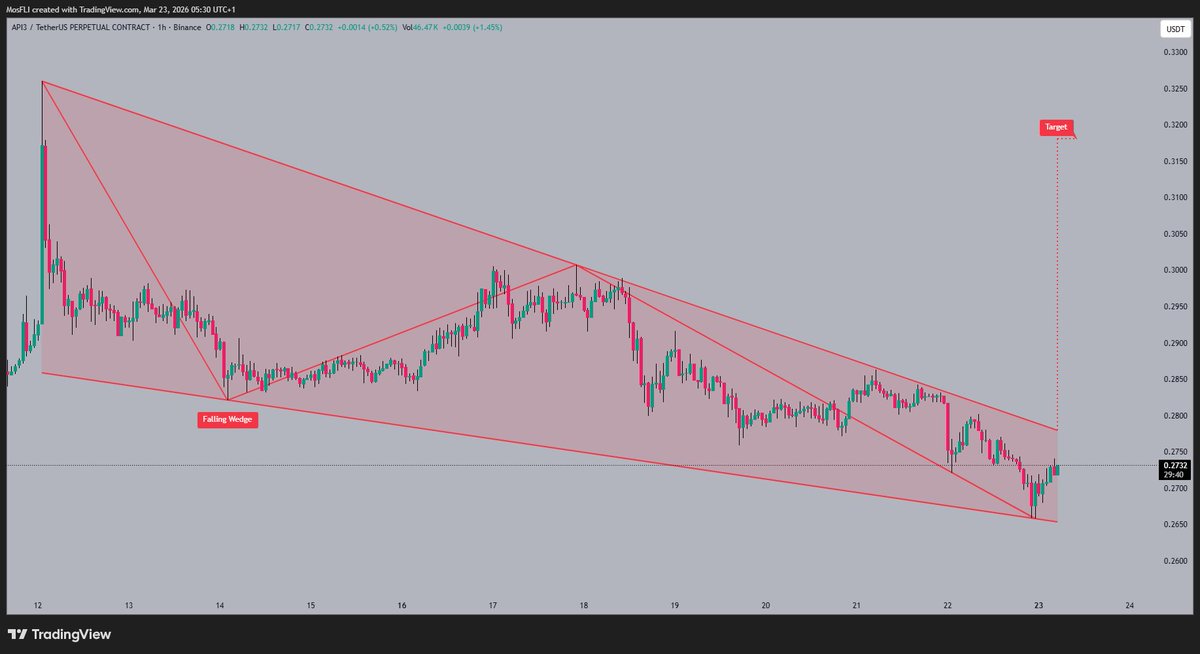
#API3 coiling in a falling wedge – classic bullish reversal setup! Currently hovering ~$0.275, breakout imminent? Confirmed push could rocket to 0.3200+ fast! Patience for that volume spike + confirmation = high-probability gains Who's watching this one? Tag your trades! #API3#Crypto#Trading#Altcoin#Bullish#CryptoTrading
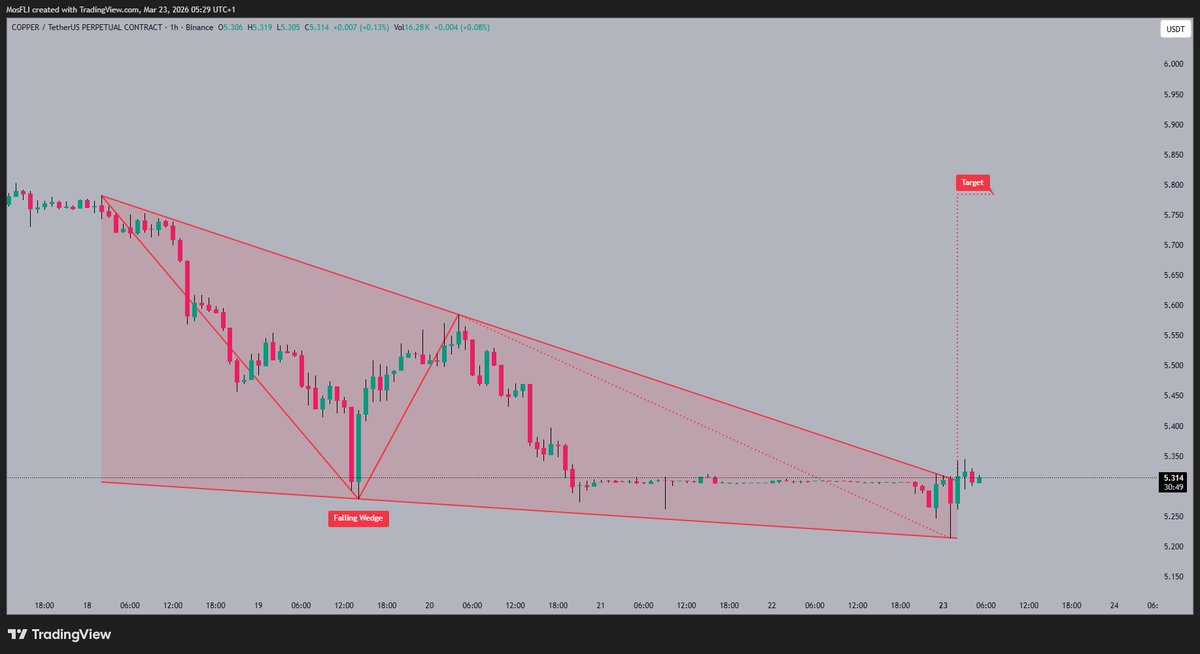
#COPPER just smashed out of that falling wedge pattern! Currently at ~5.31 – bullish reversal loading up! Next stop: 5.80+ if momentum holds! Wait for confirmation + smart stops = serious profits Who's jumping in? Drop your take below! #Copper#Crypto#Trading#Altcoin#Commodities#BullRun
$ALL coiling tight at the bottom of this falling wedge Apex approaching fast — classic bullish reversal setup loading ! Break above the upper line eyes 0.49+ Patience wins big here.You holding for the squeeze or waiting on confirmation? Spill #ALL#Crypto#Altcoins#Trading#BullishWedge
$RONIN pinned at the bottom of this falling wedge Bullish reversal pattern screaming breakout incoming ! Clean break could launch it to 0.1140+ Massive gains on deck for patient bulls.You in early or waiting for confirmation? Drop it #RONIN#Crypto#Altcoins#Trading#BullishSetup
$AMZN fresh off that falling wedge breakout now consolidating around the 205-207 zone Market indecision vibes, but bulls loading for the next push! Breakout could target 212+ Patience or jumping in early? Tell me #AMZN#Stocks#Trading#Investing#Bullish
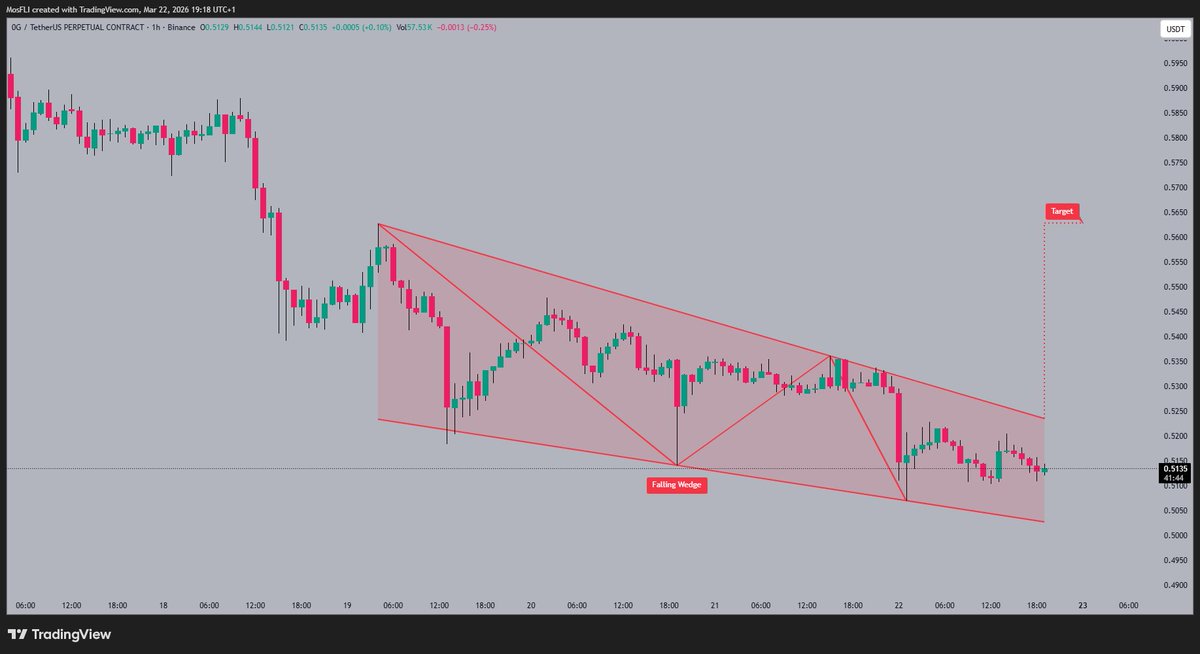
#OG sitting right at the bottom of this falling wedge – classic setup for a bullish reversal! Breakout above upper resistance could spark the next leg with target ~0.5650 Volume building? Eyes on confirmation before entry! Who's watching this esports fan token pump? #OG#OGFanToken#Crypto#Trading#Altcoin#TechnicalAnalysis#Breakout#Esports
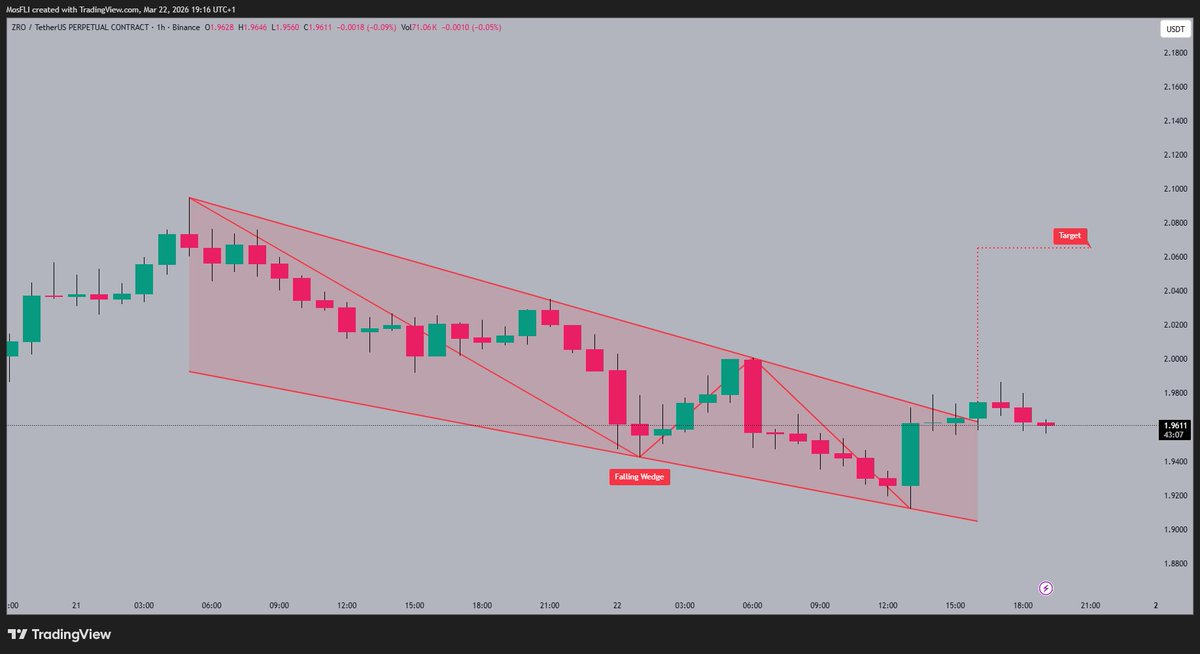
#ZRO holding strong at 1.9612 after crushing that falling wedge breakout Classic bullish reversal setup with buying pressure building – next major target sitting at 2.0800 resistance Who's positioned for the pump? Drop your thoughts below! Stay disciplined, confirm the move before going all in #ZRO#LayerZero#Crypto#Altcoin#Trading#TechnicalAnalysis#Breakout#Bullish
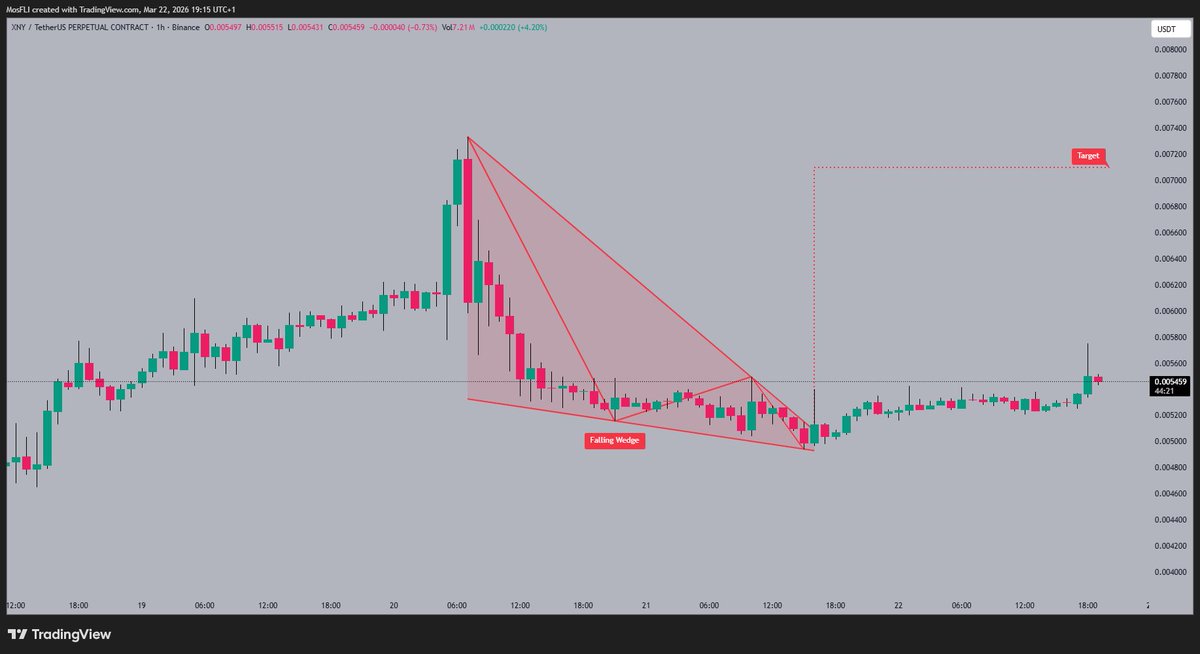
#XNY just smashed out of that falling wedge pattern Now consolidating tight around 0.005448 with volume drying up inside the wedge – classic setup for the next explosive leg up! Pattern projects next target ~0.007200 Who's riding this wave? Stay sharp, wait for confirmation before jumping in #XNY#Crypto#Altcoin#Trading#TechnicalAnalysis#Breakout#Memecoin#AIcrypto
**BREAKING NOW — BITCOIN JUST SHATTERED THE SACRED TRENDLINE!!!**
That diagonal line Wall Street prayed would hold forever?
GONE.
OBLITERATED.
Melted into crypto history in front of our very eyes!!!
Is this THE explosive breakout everyone’s been begging for… or the final fake-out before total Armageddon?
You CANNOT look away — smash that like button if your heart rate just doubled! 🚨📈💥