Greptime

841 posts

Greptime banner
Greptime

Greptime

@Greptime

The Observability 2.0 database — one engine for metrics, logs & traces as unified wide events. Replaces Prometheus, Loki & ES. Open-source, SQL + PromQL.

Wolfe Road Sunnyvale Katılım Mayıs 2022
196 Takip Edilen980 Takipçiler
Sabitlenmiş Tweet
Greptime
Greptime@Greptime·
GreptimeDB v1.1: you no longer have to lock in a table's partition layout when you create it. Before, only tables created with PARTITION ON COLUMNS could be resharded. Now you can take an existing single-Region table and split it online: ALTER TABLE sensor_readings PARTITION ON COLUMNS (device_id, area) (...) Repartition as data grows, instead of guessing up front. Full blog in detail: greptime.com/blogs/2026-06-…
Greptime tweet media
English
2
0
1
358
Greptime
Greptime@Greptime·
GreptimeDB v1.1.3 fixes a subtle distributed-query bug: ORDER BY ts DESC LIMIT 1 inside a scalar subquery could return the latest row within one region instead of the global latest — once that branch fed into a join. The rewrite now preserves global ordering. Same release: PromQL cast-filter pushdown for TIMESTAMP(6)/TIMESTAMP(9) metric tables, plus a cluster of related distributed correctness fixes (topk merge ordering, global limit on inspect streams, repartitioned joins). On v1.1? Upgrade. github.com/GreptimeTeam/g…
English
0
0
2
149
Greptime
Greptime@Greptime·
The value in observability isn't the three signals. It's correlating them: a latency spike → a slow span → an error log, one incident across all three. Store a signal per database and you correlate by eye, copy-pasting trace IDs between dashboards. Put all three in one engine and you JOIN them. That's why GreptimeDB is one engine on object storage, not three. We wrote up the six databases teams actually reach for — and named where each of the other five still wins: greptime.com/tech-content/2…
Greptime tweet media
English
0
0
9
914
Greptime
Greptime@Greptime·
Repartitioning a big table is normally a migration project: new table, dual-write, backfill TB of history, cut over. GreptimeDB v1.1 makes it one online DDL: ALTER TABLE sensor_readings PARTITION ON COLUMNS (device_id, area) ( device_id < 100 AND area < 'South', device_id < 100 AND area >= 'South', device_id >= 100 AND area <= 'East', device_id >= 100 AND area > 'East' ); Why it isn't a data migration: data lives in shared object storage, not node-local disks. A Region is a logical shard that references files through manifests. Repartitioning updates manifests + routing — zero bytes move between nodes. Then SPLIT / MERGE PARTITION to tune hotspots as load shifts. greptime.com/blogs/2026-07-…
Greptime tweet media
English
0
1
6
461
Greptime
Greptime@Greptime·
Two questions any access model has to answer: what can this user do, and which tables can they touch? GreptimeDB Enterprise's new built-in user management separates them — RBAC roles (read / write / DDL / admin) plus per-table ACLs, including regex like mem_.* to scope an account to every table with that prefix. Accounts persist in Metasrv's KV store, consistent across all Frontend nodes, managed live via HTTP API or the Dashboard. No password-file edits, no restart. greptime.com/blogs/2026-07-…
Greptime tweet media
English
0
0
3
201
Greptime
Greptime@Greptime·
GreptimeDB v1.1.2 is out — a v1.1 patch worth upgrading to. Headline fix: scheduled Flows now bind now()/current_timestamp() to the scheduled runtime, not to whenever a worker planned the query (distributed plans included), so EVAL INTERVAL windows stay deterministic. But the bug fixes matter just as much: • Kafka SASL passwords redacted in debug output • GC now lists index files (no orphaned files left behind) • parquet metadata cache size properly accounted • streaming table scan for Prometheus label discovery • PromQL time binary aggregation + optimizer-before-MergeScan correctness Thanks to everyone in the community who reported these and welcome the new contributor! github.com/GreptimeTeam/g…
English
0
0
7
420
Greptime
Greptime@Greptime·
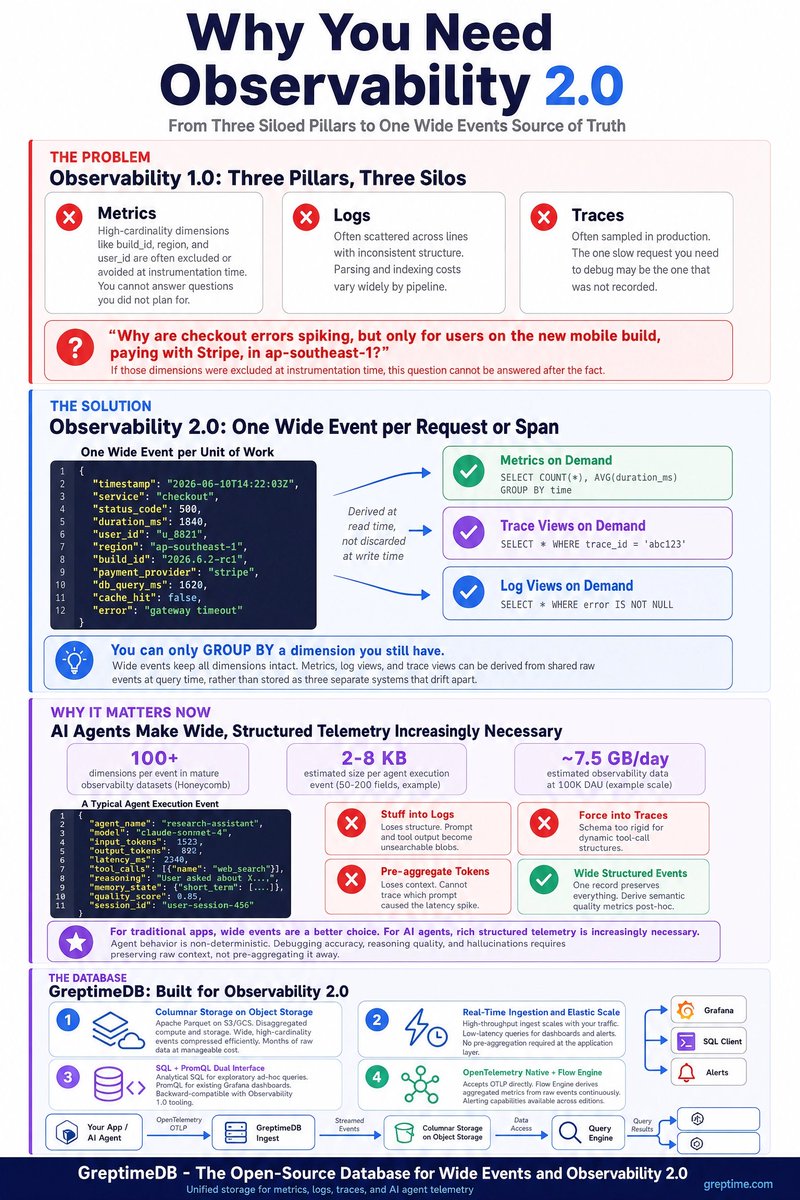
𝗢𝗯𝘀𝗲𝗿𝘃𝗮𝗯𝗶𝗹𝗶𝘁𝘆 𝗵𝗮𝘀 𝗮 𝘃𝗲𝗿𝘀𝗶𝗼𝗻 𝗻𝘂𝗺𝗯𝗲𝗿 𝗻𝗼𝘄. Most teams are still on 1.0 without realizing it. The three-pillar model works. But it was designed around a constraint that no longer exists: storage was expensive, so you pre-aggregated everything before writing it down. That write-time bet is the problem. When you instrument a service, you decide upfront which dimensions your metrics carry. High-cardinality fields like build_id, region, payment_provider are often excluded because they'd blow up cardinality. Logs keep the text but drop the schema. Traces are often sampled. Each pillar discards something, and you can't get it back when you need it. 𝗢𝗯𝘀𝗲𝗿𝘃𝗮𝗯𝗶𝗹𝗶𝘁𝘆 𝟮.𝟬 𝗳𝗹𝗶𝗽𝘀 𝘁𝗵𝗶𝘀. One wide event per request or span, every field kept. Metrics, trace views, and log views become different queries over the same raw data, derived at read time. You can GROUP BY build_id after the incident, not just before it. The idea isn't new. Meta's Scuba was doing it in 2013. What changed is that columnar storage on object storage made it affordable. Months of raw, high-cardinality events without the storage bill killing the project. 𝗔𝗜 𝗮𝗴𝗲𝗻𝘁𝘀 𝗮𝗿𝗲 𝘄𝗵𝗲𝗿𝗲 𝘁𝗵𝗲 𝘂𝗽𝗴𝗿𝗮𝗱𝗲 𝗯𝗲𝗰𝗼𝗺𝗲𝘀 𝘂𝗿𝗴𝗲𝗻𝘁. A single agent step carries model name, tokens, the full prompt, tool call params, reasoning, memory state. 50 to 200 fields per event. The questions aren't "is it up" — they're "was the answer accurate," "did it hallucinate," "why did it pick that tool." You can only answer those by keeping the raw event. Honeycomb's data: mature observability datasets run 𝟭𝟬𝟬+ dimensions. Pre-aggregation can't cover that. We've been working through these trade-offs while building GreptimeDB. Three posts covering the full reasoning: 1. Wide Events, Explained: The Data Model Behind Observability 2.0: greptime.com/tech-content/2… 2. Agent Observability: #why-o11y-1-0-struggles-with-agent-data" target="_blank" rel="nofollow noopener">greptime.com/blogs/2025-12-… 3. Database for Observability 2.0: greptime.com/blogs/2025-04-…
Greptime tweet media
English
1
1
4
483
Greptime
Greptime@Greptime·
Most of GreptimeDB's June work came down to one idea: a filter is no use if it can't reach the data. In a distributed query, predicates used to get stranded above the scan boundary. Two changes fixed that: - Remote dynamic filters (from hash joins) now push down to datanode scans at runtime, so nodes prune before the full plan finishes - The optimizer runs before MergeScan wraps the remote plan, so scan-local filters reach the datanode TableScan for region pruning Also landed: JSON v2 columns take type hints now. June report (now monthly): greptime.com/blogs/2026-06-…
English
1
1
5
276
Greptime
Greptime@Greptime·
Continuous Profiling is now in the GreptimeDB Enterprise console. It captures CPU + memory pprof profiles on resource-change triggers, not a fixed interval: a profile fires when a component's memory grows by a configured step (e.g. 100MB), or hits a new high-water-mark above your threshold. CPU works the same way, in millicores. The profiles are stored in GreptimeDB itself — 30-day TTL by default — with in-browser flamegraphs, compare-against-base, and raw pprof download. Memory profiling needs the process started with jemalloc MALLOC_CONF=prof:true. docs.greptime.com/enterprise/con…
Greptime tweet media
English
0
0
3
281
Greptime
Greptime@Greptime·
GreptimeDB is now a native data source in @PersesDev , the CNCF observability dashboard project — the plugin just merged into Perses' official plugins repo. In one dashboard: • Metrics via PromQL (reuse your Prometheus dashboards) • Logs, traces, and time-series aggregations via SQL Listing every trace is one line: SELECT * FROM web_trace_demo WHERE parent_span_id IS NULL Click a row, the Gantt view opens on the right. The PR: github.com/perses/plugins… The full blog: greptime.com/blogs/2026-06-…
Greptime tweet media
English
0
1
8
805
Greptime
Greptime@Greptime·
trace_id is high-cardinality — so Xiaomi's smart factory team didn't reach for an inverted index. They put a Bloom skipping index on it. Inverted index goes on the low-cardinality fields (log_level, service); fulltext on the message body. Right index for the shape of each field. Billions of log rows/month, sub-second TraceID lookups on GreptimeDB — Promtail left untouched. See another case study replacing Loki with GreptimeDB: greptime.com/blogs/2026-06-…
Greptime tweet media
English
0
1
9
798
Greptime retweetledi
Dennis Zhuang
Dennis Zhuang@killme20082·
Prometheus keeps 15 days by default. The moment someone needs last quarter's data, you're choosing a long-term storage backend. By 2026 the options split into two camps: – Keep Prometheus, bolt on object storage: Thanos, Mimir, Cortex – Replace the storage layer with a purpose-built DB: VictoriaMetrics, GreptimeDB, and stay with object storage. We wrote up all five — architecture, PromQL fidelity, object storage, ops cost. GreptimeDB is ours, so the writeup also names where Thanos, Mimir, and VictoriaMetrics are the better call. greptime.com/tech-content/2…
Dennis Zhuang tweet media
English
0
1
0
234
Greptime
Greptime@Greptime·
GreptimeDB v1.1.1 has been released with a fix for the critical JSON compatibility issue in v1.1.0 when upgrading from v1.0.x. If you use the JSON type in v1.0.x or earlier, please upgrade directly to v1.1.1 and avoid v1.1.0. Release: github.com/GreptimeTeam/g…
English
0
1
1
185
Greptime
Greptime@Greptime·
We found a critical JSON compatibility issue in v1.1.0 when upgrading from v1.0.x. If you use the JSON type in v1.0.x or earlier, please do not upgrade to v1.1.0. Please wait for v1.1.1, which we plan to release later today with a fix. Sorry for the inconvenience. For details, please see PR: github.com/GreptimeTeam/g…
English
1
0
0
215
Greptime
Greptime@Greptime·
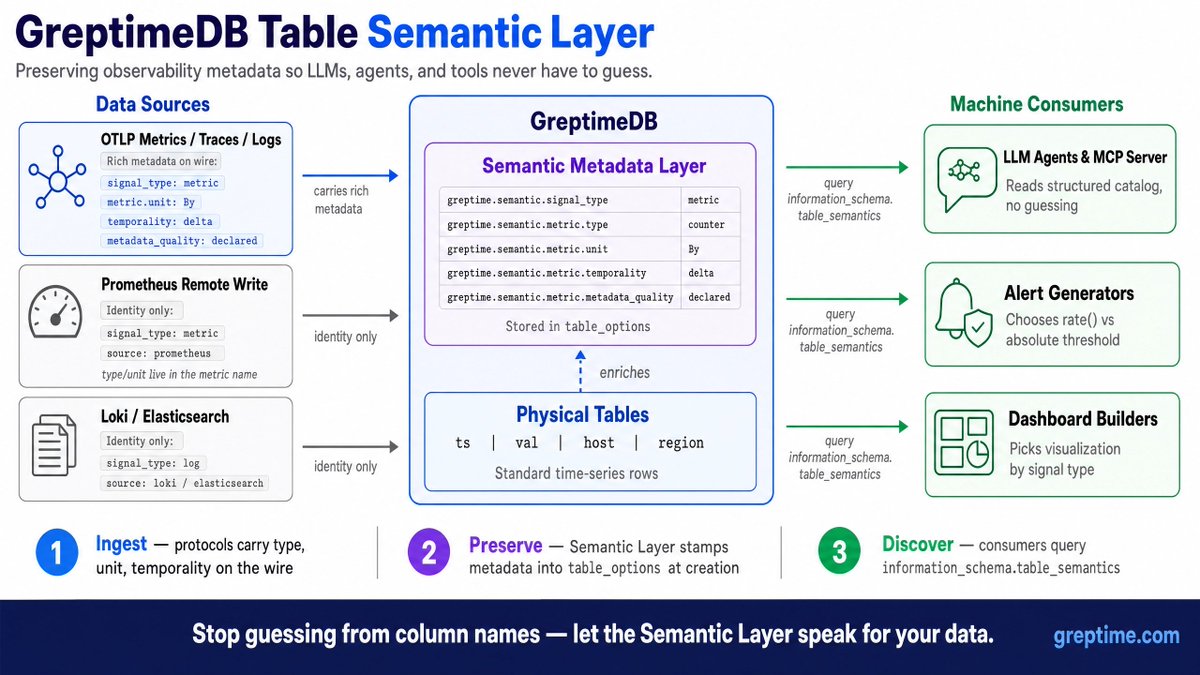
What is a Table Semantic Layer — and why does your AI agent need one? Your OTLP and Prometheus data shows up with rich metadata on the wire: signal type, metric type, unit, temporality. Most of it gets dropped the moment rows land in a table — so your agent guesses it all back from column names. GreptimeDB v1.1 stamps that metadata into table_options at ingest and exposes one view: information_schema.table_semantics. Your agent runs a single SQL on connect and reads a structured catalog instead of guessing. It even sees whether a counter was declared or just inferred from a _total suffix — so it won't blindly rate() something it shouldn't. An ontology is two things: what data is, and how it relates. This is step one — what each table is. Relationships are the next RFC. Read the doc: docs.greptime.com/user-guide/con…
Greptime tweet media
English
0
0
2
106
Greptime
Greptime@Greptime·
GreptimeDB v1.1 adds online repartitioning: ALTER TABLE … PARTITION ON COLUMNS reshards a single-Region table across nodes — no data movement, just manifest updates. After the split, keep tuning with SPLIT / MERGE PARTITION docs.greptime.com/user-guide/dep…
Greptime tweet media
English
0
1
1
214
Greptime
Greptime@Greptime·
GreptimeDB v1.1: you no longer have to lock in a table's partition layout when you create it. Before, only tables created with PARTITION ON COLUMNS could be resharded. Now you can take an existing single-Region table and split it online: ALTER TABLE sensor_readings PARTITION ON COLUMNS (device_id, area) (...) Repartition as data grows, instead of guessing up front. Full blog in detail: greptime.com/blogs/2026-06-…
Greptime tweet media
English
2
0
1
358
Greptime
Greptime@Greptime·
Thank you to all contributors!
Greptime tweet media
English
0
0
0
78