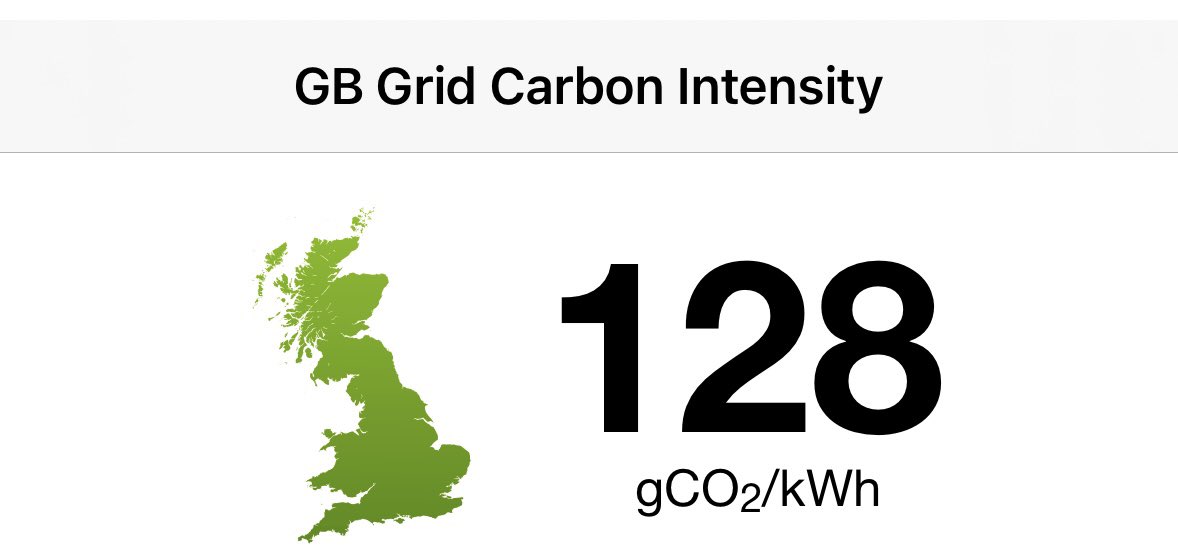
@GridCarbon I notice that there is a large difference between what GridCarbon reports for gCo2/kWh compared to the National Grid ESO. For example, right now, Gridcarbon showing 74 but ESO showing 42. Why the difference?
@stevefry@JonathanWaxman1 See Staffell, 2017 for the full discussion. This starts from the carbon intensity of burning wood and tries to put a value on the subsequent reduction due to regrowth of the source. sciencedirect.com/science/articl…
@VisctFishpond They are hard to track down but seem to be things like battery storage sites and sometimes waste-to-energy sites. They are all metered and registered as balancing mechanism units. assets.elexon.co.uk/wp-content/upl…
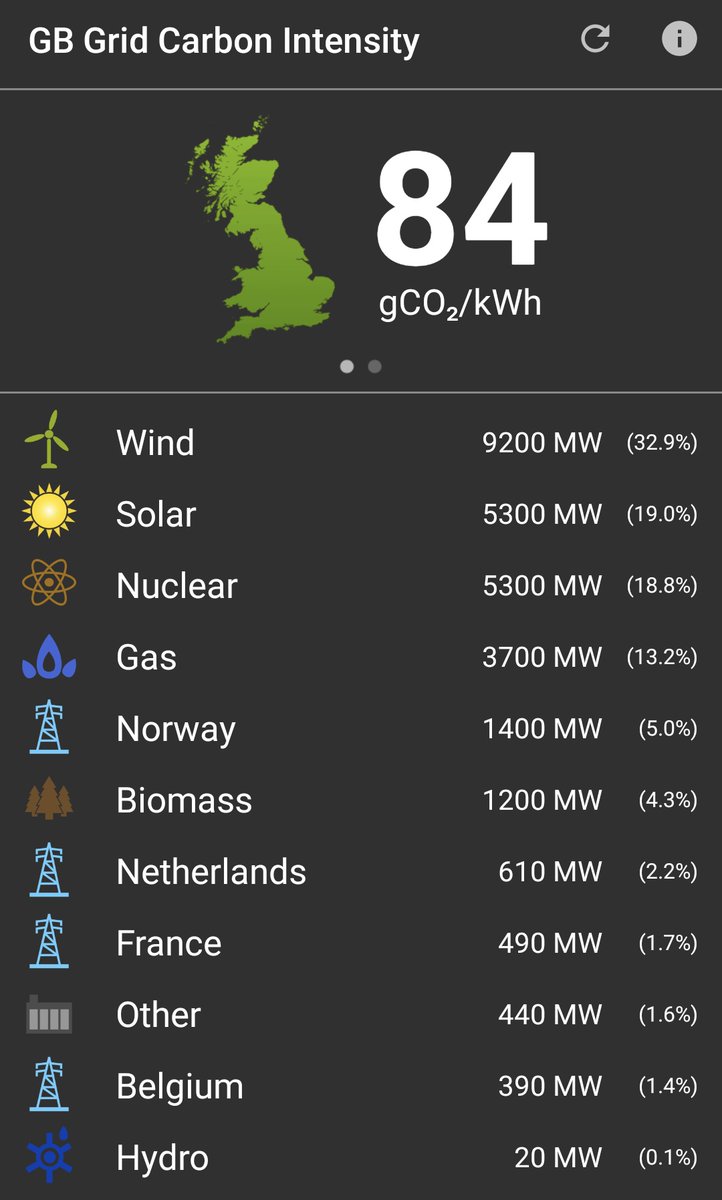
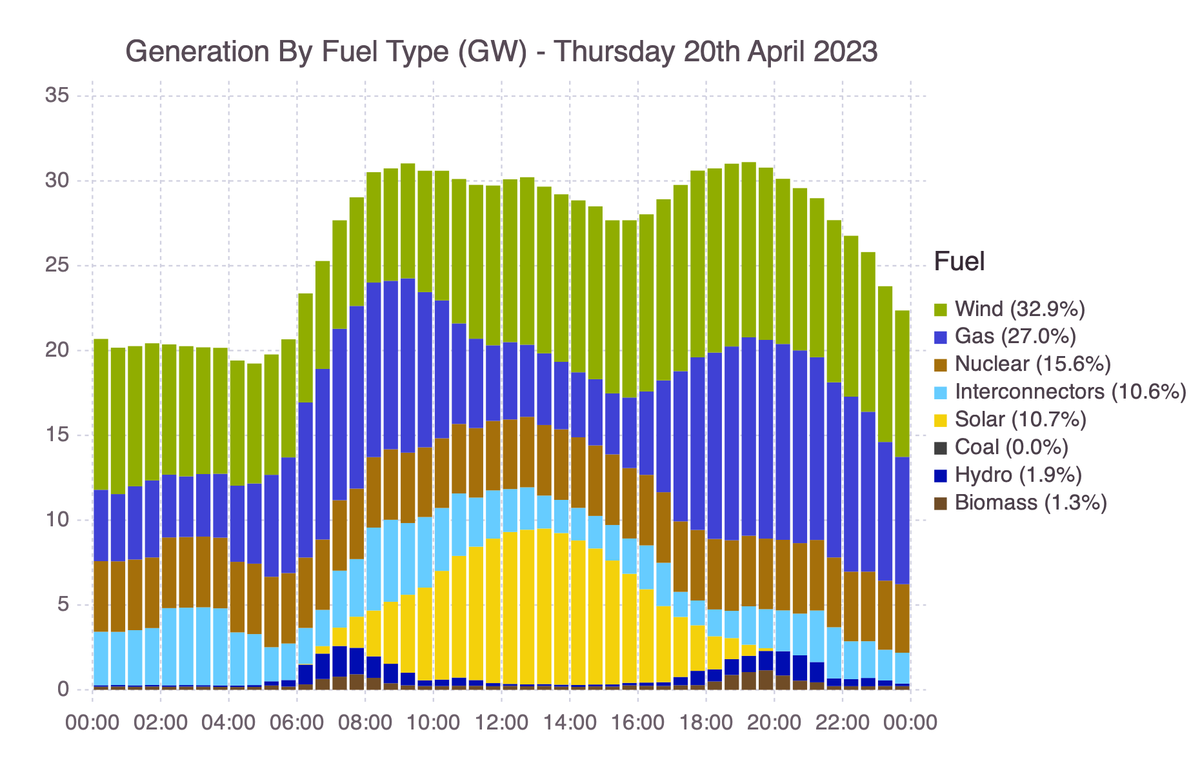
At 3.15pm today, wind and solar were providing more than 50% of the UK grid's electricity, with nuclear at just under 19%, delivering an overall carbon intensity of 84g CO2/kilowatt hour. For reference, the average grid carbon intensity for 2022 was 257g CO2/kWh. @GridCarbon
@wsvine@ukedgemk You probably have the most up to date version now, but the ELEXON site went down for maintenance today around 18:00. Should be back up later today.
@rarts Yep, we recalculate the carbon intensity using the 'official' 30-minute fuel mix values that are published at the end of each day. The app uses 5-minute data with extrapolated solar data (the solar API can have a lag of up to an hour) so the numbers differ a little sometimes.
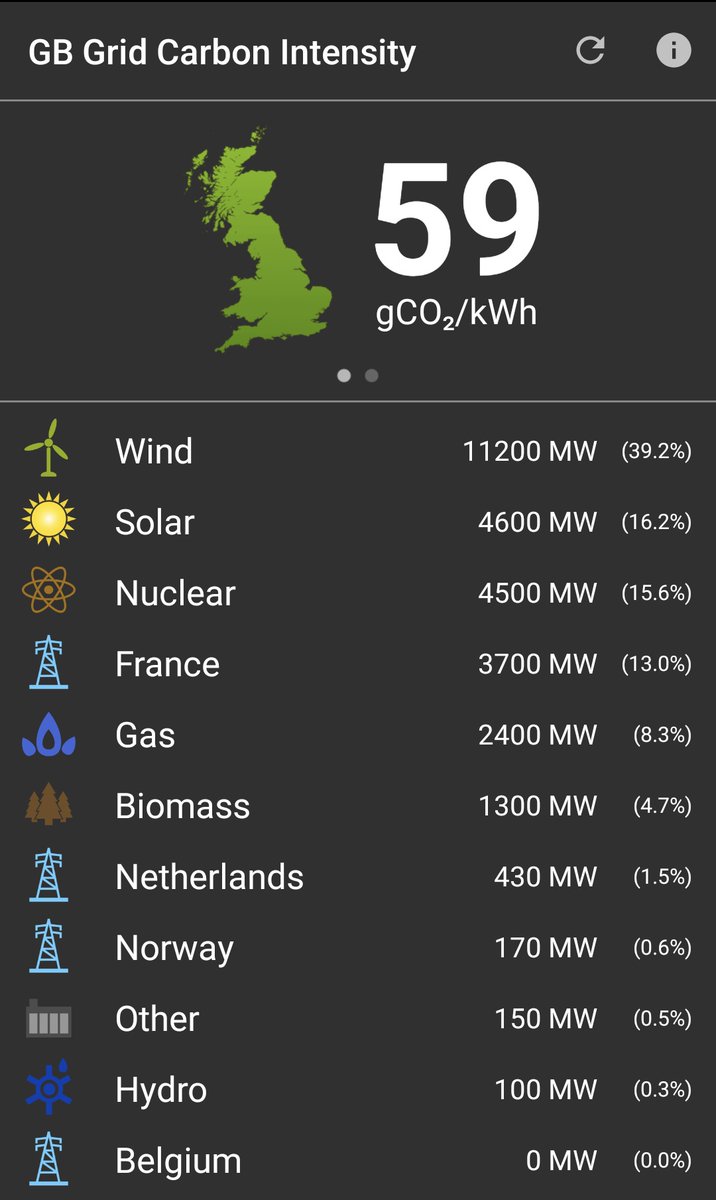
At 2.40pm today, wind and solar are producing 55% of the UK's electricity, with nuclear at almost 16%. Fossil gas is generating just 8.3%, contributing to a carbon intensity of 59 grams of CO2 per kilowatt hour. Courtesy of @GridCarbon.