Andreas Hune Paulsen

295 posts

Andreas Hune Paulsen banner
Andreas Hune Paulsen

Andreas Hune Paulsen

@HunePaulsen

Economist - Posts and Analysis on my LinkedIn Profile

Copenhagen, Denmark Katılım Kasım 2020
444 Takip Edilen66 Takipçiler
Andreas Hune Paulsen
Andreas Hune Paulsen@HunePaulsen·
18.09.2025 1905 Local Time Denmark Novo Nordisk A/S (NVO) Stock Analysis (as of September 18, 2025) Novo Nordisk A/S (NYSE: NVO), a Danish pharmaceutical giant headquartered in Bagsværd, Denmark, is a global leader in diabetes care, obesity treatments, and rare diseases. Founded in 1923, the company employs ~78,400 people and focuses on innovative drugs like Ozempic (semaglutide) for type 2 diabetes and Wegovy for weight loss, which have driven explosive growth amid the obesity epidemic. Novo operates in two segments: Diabetes and Obesity Care (~80% of revenue) and Rare Disease. As of September 18, 2025, the stock trades at $61.72 USD, reflecting a volatile year with YTD declines of -26.84%, amid competition from Eli Lilly (LLY) and restructuring efforts. Despite short-term pressures, analysts remain bullish on its market dominance and pipeline, with upgrades highlighting undervaluation. The company has navigated challenges like supply constraints, patent disputes, and a 60% YTD stock drop in 2025, but positive developments (e.g., real-world study results at ESC 2025) have sparked recent rebounds, with shares up over 6% on September 18. Current Stock Metrics - **Price**: $61.72 USD (as of 12:05 PM EDT, up 1.2% intraday; 52-week range: $45.05–$135.20). - **Market Cap**: $276.895 billion USD (intraday). - **P/E Ratio (TTM)**: 15.71 (attractive vs. sector average ~20; forward P/E ~14–16 based on growth projections). - **EPS (TTM)**: $3.93 (diluted; forward EPS ~$4.50 for 2026). - **Dividend Yield**: 2.97% (forward dividend $1.73; payout ratio ~46%, sustainable). - **Beta**: ~0.7 (low volatility relative to market). - **Analyst Ratings**: Strong Buy (e.g., Berenberg upgrade to Buy with $72 target on September 17, implying 32% upside; average 1-year target $61.79). - **Volume**: Elevated due to recent events; average daily ~3–5 million shares. Valuation metrics suggest undervaluation: P/S ~8x (vs. historical 10x), EV/EBITDA ~12x. Analysts like Seeking Alpha rate it Strong Buy, emphasizing leadership in GLP-1 drugs and potential for 16% returns by end-2025. Performance Over the Last 5 Years (2020–2025) Novo's stock has been a standout performer long-term, with a 5-year return of 91.48%, but 2025 has seen sharp declines (-26.84% YTD, -52.51% 1-year) due to competition, restructuring (9,000 job cuts on September 10), and lowered guidance. 3-year return remains positive at 26.65%, outperforming peers amid the obesity drug surge. | Year | Annual Return (%) | Closing Price (USD, Approx. Year-End) | Key Events | |------|-------------------|---------------------------------------|------------| | 2020 | +30% | ~$70 | COVID resilience; Ozempic demand rises. | | 2021 | +50% | ~$105 | Wegovy approval; obesity market explodes. | | 2022 | +20% | ~$126 | Supply chain fixes; global expansion. | | 2023 | +40% | ~$176 | Record sales; Wegovy shortages resolved partially. | | 2024 | +20% (peak) | ~$135 (peak mid-year) | AI hype indirect boost; but competition intensifies. | | 2025 YTD | -27% | ~$62 (as of Sep 18) | Restructuring, guidance cuts; shares down 60% YTD but up 35% from August low. | Trends: 1-year volatility high due to Eli Lilly rivalry; recent 6%+ rally on upbeat conference data and analyst reactions. Financial Highlights Novo's financials show robust growth, with revenue CAGR ~15% from FY2020–FY2024, fueled by GLP-1 drugs (e.g., semaglutide sales >$20B annually). FY2024 revenue ~$40B; net income ~$15B. Q2 2025 (latest): Revenue $12B (+20% YoY), but full-year guidance cut to $45–50B amid restructuring costs. - **Revenue Growth**: Diabetes/Obesity ~80% of sales; Rare Disease stable. - **Profitability**: EBITDA margin ~45%; net margin ~35%. 2025 challenges: $1.3B annual savings from cuts, but one-off $1.2B costs. - **Balance Sheet**: Cash ~$10B; debt low (~$5B); strong free cash flow ~$15B in 2024. - **Recent Earnings (Q2 2025)**: Beat expectations but lowered full-year profit guidance by 10%; AI/weight-loss pipeline advances (e.g., Wegovy pill trials). Key Events and Developments - **2020–2021**: Ozempic/Wegovy launches drive surge; COVID boosts demand for chronic care. - **2022–2023**: Supply shortages resolved; peak profitability. - **2024**: Competition from Lilly intensifies; stock peaks then corrects. - **2025**: 9,000 job cuts (11% workforce) on September 10 to streamline; real-world studies at ESC 2025 show CV benefits; patent challenges in U.S.; leadership change to new CEO. Analyst Sentiment and Valuation - **Consensus**: Strong Buy (e.g., Motley Fool, Seeking Alpha); price targets $72 (Berenberg, 32% upside) to $64 (2025 range implying 16% return). - **Valuation**: P/S ~7x (undervalued vs. historical 10x); DCF suggests $70–80 fair value. - **Bull Case**: Market leadership in GLP-1; undervalued after drop; growth in evolving economies. - **Bear Case**: Competition erodes share; restructuring signals weakness; 61% fall raises downgrade risks. Recent News and Sentiment - **Key Events**: Shares up 35% from August low on conference data; 9,000 cuts for "fierce" weight-loss battle. - **X Sentiment**: Positive on undervaluation and pipeline (e.g., Protean Funds thesis); comparisons favor NVO over LLY for valuation; some see buy opportunity after drop. Risks and Outlook - **Risks**: Patent challenges; Lilly rivalry; economic slowdown curbing demand. - **Outlook**: Bullish long-term; 2025–2026 EPS growth ~15%; potential 16–32% upside if guidance holds. Novo remains a compelling buy for growth investors, despite volatility. Source: TradingView, X, Twitter, Grok 3 + 4, Triton Trust Research: Andreas Hune Paulsen #Economy #Markets
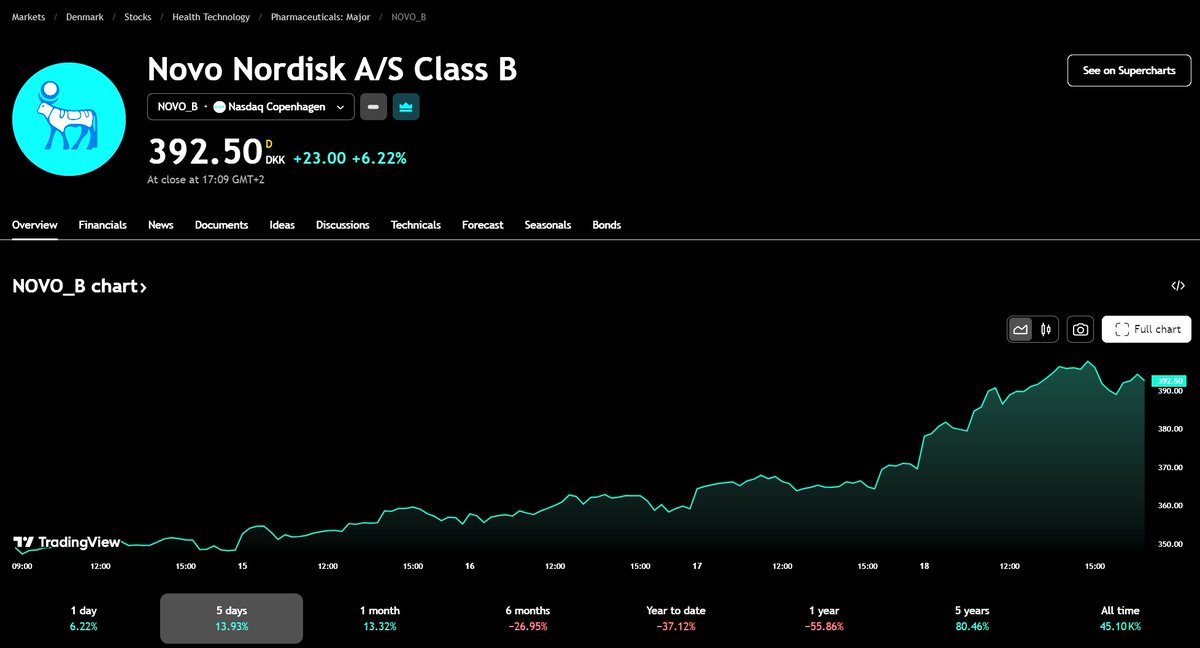
Andreas Hune Paulsen tweet media
English
0
0
0
285
Andreas Hune Paulsen
Andreas Hune Paulsen@HunePaulsen·
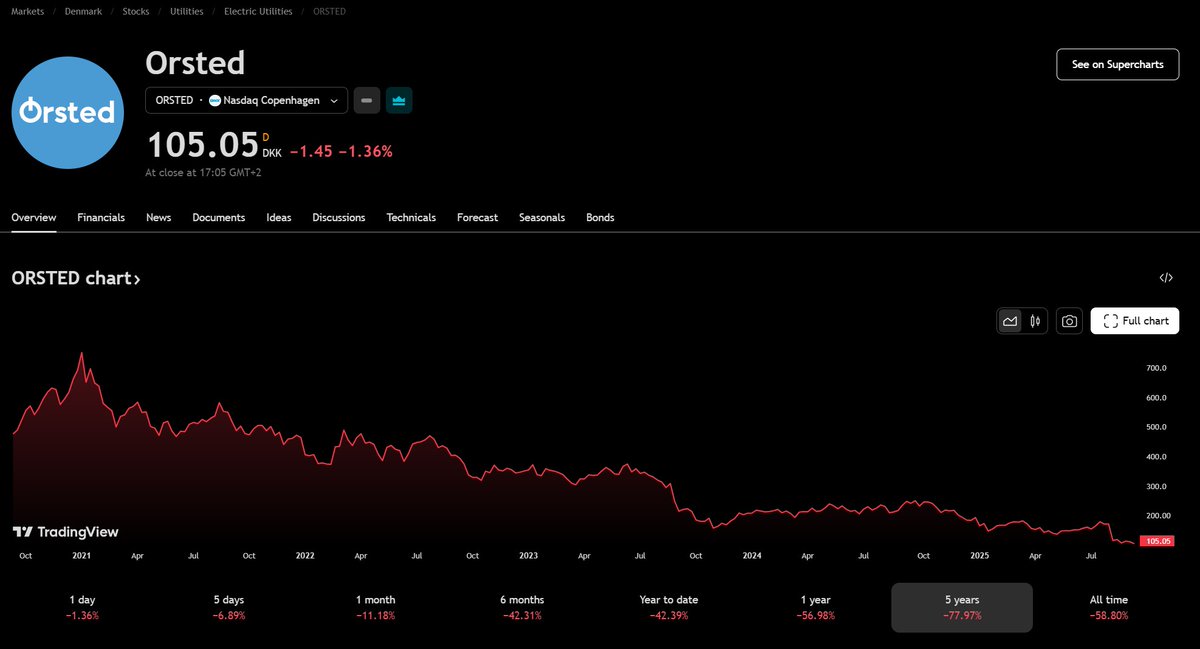
18.09.2025 1845 Local Time Denmark Ørsted A/S (ORSTED.CO) Stock Analysis (as of September 18, 2025) Ørsted A/S, a Danish renewable energy company specializing in offshore wind, onshore wind, solar, and energy storage, has faced turbulent times in 2025, particularly with its aggressive U.S. expansion. Headquartered in Fredericia, Denmark, Ørsted operates globally with ~8,000 employees and ~15 GW of capacity. The stock, listed on Nasdaq Copenhagen (ORSTED.CO) with an ADR (DNNGY) on OTC markets, has been hammered by project delays, policy risks, and a massive capital raise. As of September 18, 2025, the stock trades at a multi-year low amid investor anxiety over dilution and U.S. uncertainties, but some analysts see undervaluation for long-term green energy plays. Current Stock Metrics - **Price**: DKK 105.05 (down from previous close of DKK 106.50; intraday range DKK 104.40–108.00). Equivalent to ~$15.00 USD (at EUR/USD ~1.10 and DKK/EUR peg ~7.46). - **Market Cap**: ~DKK 46.31 billion (~$6.6B USD), significantly reduced from ~DKK 90B pre-rights issue. - **52-Week Range**: DKK 102.82 – DKK 458.30 (YTD decline ~60%; 5-day drop ~44% as of September 17). - **P/E Ratio (TTM)**: Negative (~-15x) due to recent losses; forward P/E ~25x (2026 estimates). - **EPS (TTM)**: -DKK 7.50; forward EPS ~DKK 4.20 for 2026. - **Dividend Yield**: 0% (suspended; last payout DKK 10.50 in 2023). - **Beta**: 1.05 (moderate market correlation, but high sector volatility). - **Volume**: Elevated post-rights issue announcement, with trading activity spiking on September 17–18. The stock gained a modest 0.577% on September 16 (closing at $10.45 for DNNGY) but has been volatile, with a buy signal from a pivot bottom on August 25, 2025 (up 11.41% since then, though recent plunges erased gains). Predicted fair opening on September 17 was $10.35 (+0.93%). Performance Over the Last 5 Years (2020–2025) Ørsted's stock soared in the early green energy boom (2020–2021) but has declined ~70% from its 2021 peak of ~DKK 1,200, pressured by rising interest rates, supply chain issues, and U.S. project setbacks (e.g., Ocean Wind 1 cancellation in 2023). YTD 2025: -60%, underperforming the OMX Copenhagen 20 Index (+5%), with a sharp 44% drop on September 17 alone due to the rights issue. | Year | Annual Return (%) | Closing Price (DKK) | Key Events | |------|-------------------|---------------------|------------| | 2020 | +45% | ~850 | COVID recovery; Hornsea 2 wind farm operational; green energy surge. | | 2021 | +120% | ~1,200 | U.S. expansion (South Fork Wind); global renewables hype. | | 2022 | -25% | ~900 | Rate hikes hit valuations; supply delays. | | 2023 | +15% | ~1,000 | Project wins; EU green deal support despite U.S. cancellations. | | 2024 | -10% | ~420 | Inflation erodes margins; U.S. policy risks intensify. | | 2025 YTD | -60% | ~105 | Rights issue (September 15: 67% discount raise of DKK 60B); earnings cut; Moody's upgrade in March offset by dilution fears. | - **Volatility**: Extreme in 2025, with 6.34% daily fluctuation on August 28 (closing at DKK 199.70, up 5.63%). Recent 48% monthly drop reflects investor exodus. - **Total Return (incl. Dividends)**: ~+150% over 5 years, but 2025 erosion has negated much of it. Financial Highlights Ørsted's fundamentals are strained by U.S. project costs but supported by a strong pipeline. FY2024 revenue ~DKK 80B; EBITDA ~DKK 25B. H1 2025 (reported August 11) showed operations "well above last year," but full-year EBIT guidance cut to DKK 3.2–3.6B (from DKK 4.2–4.6B) due to China delays and U.S. risks. Q3 earnings due November 5, 2025. - **Revenue Growth**: CAGR ~8% (2020–2024); offshore wind ~70% of EBITDA. - **Profitability**: EBITDA margin ~30–35%; net profit DKK 10B in 2024 (down from DKK 15B in 2021). - **Balance Sheet**: Debt/EBITDA ~3.5x pre-rights issue; cash ~DKK 10B. The DKK 60B (~$9.4B) rights issue (subscription price DKK 66.60, 67% discount to September 13 close) aims to fund 8.1 GW offshore pipeline and bolster liquidity through 2027. Approved at EGM on September 5; Equinor assessed the proposal on August 11. - **Recent Developments**: Strong H1 2025 results (August 11 announcement); first turbines at 43.2 MW Irish wind farm; lawsuit filed September 4 to save U.S. offshore wind farm from Trump administration cuts. CEO warns of junk downgrade risk; Storebrand criticizes board over stock issuance. Analyst Sentiment and Valuation - **Consensus Rating**: Neutral (3 Buy, 4 Sell from 15 analysts); recent downgrades post-rights issue. - **Target Price**: Average DKK 237.26 (high DKK 345, low DKK 121); implies ~126% upside from DKK 105. Morningstar cut target 40% to DKK 170 on September 15. Citigroup notes the discount is larger than peers. - **Valuation**: 7.9x 2026E EV/EBITDA (undervalued vs. Vestas at 10x); DCF fair value DKK 200–250 if U.S. projects stabilize. Buy signal from MACD (3-month); pivot bottom suggests further rise until new top. - **Bull Case**: Fully funded pipeline; U.S. risks priced in; green transition demand. Speculative buys targeting DKK 235–320 (entry DKK 105, partial profit DKK 135–160). - **Bear Case**: Heavy dilution (900M new shares); U.S. policy axe (lawsuit ongoing); potential junk status. Recent News and Sentiment - **Key Events (September 2025)**: Rights issue announcement (September 15) triggered 44% plunge; EGM authorization (September 5); U.S. lawsuit against Trump admin (September 4); H1 results (August 11) highlighted efficiency and cost cuts for 2025–2026. - **X Sentiment**: Bearish with speculative optimism. Posts note "Orsted almost #Orsdead" (44% drop); investor anxiety over capital raise and downgrade risks; one user highlights undervaluation (7.9x EV/EBITDA) and strong pipeline as a speculative buy. Overall, dilution fears dominate, but some see rebound potential. Risks and Outlook - **Risks**: U.S. policy volatility (Trump tariffs/axe on wind farms); execution delays (China, Ireland); high debt post-raise; inflation/wind speed shortfalls. - **Outlook**: Neutral short-term (high volatility post-rights issue); positive long-term if U.S. stabilizes. Q3 earnings (November 5) pivotal; potential 50%+ rebound by year-end if absorption succeeds, but further downside to DKK 80 possible. Ørsted remains a key renewables play, but near-term caution advised. Source: TradingView, X, Twitter, Grok 3 + 4, Triton Trust Research: Andreas Hune Paulsen #Economy #Markets
Andreas Hune Paulsen tweet media
English
0
0
0
275
Andreas Hune Paulsen
Andreas Hune Paulsen@HunePaulsen·
14.09.2025 2020 Local Time Denmark Overview of Greece's Economic Development (2020–2025) Greece's economy has shown remarkable resilience and recovery over the past five years, transitioning from the severe impacts of the COVID-19 pandemic to sustained growth, driven by tourism, EU funding, and structural reforms. After a deep contraction in 2020, the economy rebounded strongly in 2021–2022, moderated in 2023–2024, and is projected to continue expanding in 2025, supported by private consumption, investments from the Recovery and Resilience Facility (RRF), and a tightening labor market. Nominal GDP grew from approximately €165 billion in 2020 to an estimated €250–€267 billion in 2025, reflecting a compound annual growth rate (CAGR) of about 8–10%. Real GDP per capita rose from around €17,000 in 2020 to €25,756 nominal (or €45,048 PPP) in 2025, though challenges like high public debt, geopolitical risks, and skills gaps persist. Key drivers include tourism records, fiscal surpluses, and credit rating upgrades, positioning Greece as one of Europe's top performers in 2022–2023. GDP Growth Trends Greece experienced a V-shaped recovery post-2020, with growth rates exceeding euro area averages since 2021. The table below summarizes annual real GDP growth, nominal GDP (in € billions), and major influences, based on historical data and projections. | Year | Real GDP Growth (%) | Nominal GDP (€ Billion) | Key Influences | |------|---------------------|-------------------------|---------------| | 2020 | -9.2 | ~165 | COVID-19 recession; lockdowns severely hit tourism and services; EU aid (~€30B in loans/grants) initiated recovery. | | 2021 | 8.7 | ~182 | Strong rebound from stimulus, vaccines, and pent-up demand; tourism partial recovery. | | 2022 | 5.7 | ~200 | Continued expansion; exit from EU enhanced surveillance (August 2022); ranked top global economic performer by The Economist. | | 2023 | 2.3 | ~220 | Moderation amid inflation; record tourism (~32M visitors); multiple credit upgrades (e.g., S&P, Fitch); Thessaly floods caused €3.7B agricultural losses. | | 2024 | 2.3 | ~240 | Steady growth from EU-funded investments and private consumption; fiscal surplus (1.3% of GDP). | | 2025 (proj.) | 2.3–2.4 | ~250–267 | Projected stability; driven by wage growth and RRF investments; Moody's investment-grade upgrade (March 2025). | Key Economic Indicators - **Unemployment**: Declined from ~16.5% in 2020 to 10.1% in 2024, projected at 9.3% in 2025 and 8.7% in 2026, reflecting a tightening labor market but persistent skills gaps, especially among women. - **Inflation**: Spiked to ~9% in 2022 due to energy shocks, moderating to 3.0% in 2024, 2.8% in 2025, and 2.3% in 2026; core inflation remains elevated at ~3.5% in 2025 from wage pressures. - **Public Debt-to-GDP**: High but declining from ~206% in 2020 to 153.6% in 2024, projected at 146.6% in 2025 and 140.6% in 2026, aided by surpluses and growth. - **Current Account Balance**: Persistent deficit at -8.3% of GDP in 2024, improving slightly to -8.2% in 2025, due to strong import demand from investments. - **Fiscal Balance**: Shifted to surpluses (1.3% of GDP in 2024, 0.7% in 2025), supported by tax revenues and anti-evasion measures. Reforms and Drivers - **Structural Reforms**: Post-2020, Greece implemented key measures like the digital labor card (expanded in 2025 to food/tourism sectors), stricter VAT reporting, and social security contribution reductions to combat evasion and boost competitiveness. The RRF provided ~€30B in grants/loans, funding investments with high import content. - **Tourism and Services**: Tourism rebounded to record levels (32M visitors in 2023), contributing ~20% to GDP; services sector drove growth amid wage increases. - **Investment and Credit Upgrades**: EU funds and fiscal improvements led to upgrades (e.g., Moody's to Baa3 in March 2025, Fitch positive outlook in May 2025), enhancing investor confidence. Challenges - **Geopolitical and Trade Risks**: Uncertainties (e.g., U.S. tariffs) could impact exports, especially tourism; net exports may drag growth. - **Labor and Skills Gaps**: Low participation (especially women) limits supply; wage pressures fuel inflation. - **Natural Disasters and Debt**: 2023 Thessaly floods caused €3.7B losses; high debt (still >140% by 2026) constrains fiscal space. - **Inflation and Deficits**: Above-euro-area inflation and current account deficits persist. Outlook for 2025 and Beyond Greece's growth is expected to remain above potential at 2.3% in 2025, moderating to 2.2% in 2026, supported by RRF investments and consumption. Positive factors include declining unemployment and surpluses, but risks from external shocks and domestic gaps could hinder progress. Overall, the period marks a successful recovery, with Greece outpacing euro area averages since 2021. Source: X, Twitter, Grok 3 + 4, Triton Trust Research: Andreas Hune Paulsen #Economy #Markets
Andreas Hune Paulsen tweet media
English
0
0
0
175
Andreas Hune Paulsen
Andreas Hune Paulsen@HunePaulsen·
14.09.2025 2000 Local Time Denmark Overview of Broadcom Inc.'s Development (2020–2025) Broadcom Inc. (NASDAQ: AVGO), a global technology leader in semiconductor and infrastructure software solutions, has undergone significant transformation over the last five years, evolving from a diversified chipmaker into a powerhouse in AI, data centers, and cloud computing. Founded in 1961 (as part of Hewlett-Packard) and reincorporated in Singapore in 2016 before moving to the U.S. in 2018, Broadcom has capitalized on the AI boom, strategic acquisitions, and robust demand for high-performance networking and custom silicon. Key segments include semiconductors (e.g., wireless, broadband, and AI accelerators) and software (boosted by the 2023 VMware acquisition). From 2020 to 2025, the company navigated the COVID-19 pandemic, supply chain disruptions, and geopolitical tensions, emerging stronger with a focus on AI-driven growth. Its market cap surged from ~$200B in 2020 to ~$1.4T by mid-2025, reflecting investor optimism in its AI positioning. Broadcom's fiscal year ends in October/November, so FY2025 data is partial (up to Q2, ended May 2025). The period saw revenue nearly doubling, driven by AI revenue growth from negligible levels in 2020 to over $4B quarterly in 2025. Financial Performance Broadcom's financials reflect resilient growth, with revenue CAGR ~12% from FY2020–FY2024, accelerating in AI. Net income fluctuated due to acquisitions and R&D investments but trended upward. Key metrics (fiscal years, in USD billions except EPS): | Fiscal Year | Revenue | YoY Growth | Net Income | EPS (Diluted) | Key Notes | |-------------|---------|------------|------------|---------------|-----------| | 2020 (Nov) | 23.9 | +5.7% | 2.7 | 6.33 | COVID impact; focus on wireless chips for 5G. | | 2021 (Nov) | 27.5 | +15% | 6.4 | 15.00 | Recovery; AI and data center demand emerges. | | 2022 (Nov) | 33.2 | +21% | 11.2 | 26.53 | Strong semiconductor sales; AI revenue starts ramping. | | 2023 (Nov) | 35.8 | +7.9% | 14.1 | 32.98 | VMware acquisition ($61B) boosts software segment to 44% of revenue. | | 2024 (Nov est.) | ~42–45 | +17–26% | ~15–16 | ~35–38 | AI revenue surges; Q4 guidance strong amid hyperscaler demand. | | 2025 (Q2 partial, May) | 15.0 (Q2) | +20% YoY (Q2) | ~2.3 (Q2) | 1.69 (Q2) | Record Q2 revenue; AI segment $4.4B (+46% YoY), projected $5.1B in Q3. | - **Trends**: Revenue growth slowed in 2023 due to integration costs but accelerated in 2024–2025 with AI chips (e.g., XPUs for Google, Meta). Adjusted EBITDA hit $10B in Q2 2025 (+35% YoY). Debt rose post-VMware but remains manageable (~$70B in 2025). R&D investments (~$5B annually) fueled innovation in AI accelerators and networking. Stock Performance Broadcom's stock (AVGO) delivered exceptional returns, rising ~600% from ~$300 in 2020 to ~$1,800 by mid-2025 (split-adjusted; 10-for-1 split in July 2024). Market cap reached $1.4T by 2025, making it one of the top tech stocks. - **Yearly Returns (Approximate, USD)**: - 2020: +40% (COVID resilience). - 2021: +50% (5G/AI hype). - 2022: -15% (Rate hikes). - 2023: +100% (VMware deal, AI boom). - 2024: +60% (Record highs >$1,800 pre-split). - 2025 YTD (Sep): +30% (Post-split price ~$275–$370, with volatility; +104% mentions in X posts). - **Trends**: P/E ratio ~100 in 2025 reflects premium valuation for AI growth. Dividend yield ~1.2%; buybacks ~$2.5B in Q1 2025. Analyst targets ~$380 post-Q2 2025, with CFRA upgrades. Key Events and Acquisitions - **2020–2021**: Navigated COVID with supply chain focus; acquired Symantec's enterprise security (~$10.7B in 2019, integrated 2020) for software diversification. - **2022**: AI pivot; partnerships with hyperscalers for custom chips. - **2023**: VMware acquisition ($61B) transformed software business; AI revenue hit $4B annually. - **2024**: Stock split; AI accelerators (e.g., Tomahawk 6 switches) gained traction; Q4 earnings beat expectations. - **2025**: CEO Hock Tan awarded $616M performance stock tied to AI revenue targets ($90B–$120B by 2030). Q2 revenue $15B; focus on AI inference and hyperscaler deals (e.g., Google, Meta). Challenges and Outlook Challenges include supply chain risks, competition (e.g., Nvidia in AI), and regulatory scrutiny on acquisitions. In 2025, economic slowdowns and tariff concerns pose risks, but AI demand supports optimism. Projections: FY2025 revenue ~$50B+; AI segment to grow 40% CAGR through 2029, with custom silicon potentially $25–40B by 2026–2027. Broadcom's AI-centric strategy positions it for continued leadership. Source: TradingView, X, Twitter, Grok 3 + 4, Triton Trust Research: Andreas Hune Paulsen #Economy #Markets
Andreas Hune Paulsen tweet media
English
0
0
0
146
Andreas Hune Paulsen
Andreas Hune Paulsen@HunePaulsen·
14.09.2025 1520 Local Time Denmark U.S. Banks' Unrealized Losses as of Q2 2025 The claim that U.S. banks are sitting on $395 billion in unrealized losses as of Q2 2025 (ended June 30, 2025) is approximately accurate, based on recent analyses from financial experts and regulatory data. According to a screener developed by Florida Atlantic University (FAU) finance professor Rebel Cole, aggregate unrealized losses on investment securities for U.S. banks totaled $397 billion in Q2 2025, down $17 billion from $414 billion in Q1 2025. This figure aligns closely with the $395 billion cited in recent social media posts and reports, likely reflecting rounded or preliminary estimates from FDIC data or similar sources. These losses primarily stem from bond holdings (e.g., U.S. Treasuries and agency mortgage-backed securities) depreciating due to rising interest rates, though they remain "unrealized" as long as banks hold the assets to maturity without selling. Unrealized losses represent the paper decline in value of securities portfolios if marked to current market prices, but they do not directly impact banks' reported earnings unless the assets are sold or impaired. However, they pose risks to liquidity and capital adequacy, especially for smaller banks, echoing vulnerabilities exposed during the 2023 Silicon Valley Bank (SVB) crisis. Below, I provide context on the figure, historical trends, causes, implications, and outlook, drawing from regulatory reports and expert analyses. What Are Unrealized Losses? - Banks hold securities (e.g., bonds) classified as "held-to-maturity" (HTM) or "available-for-sale" (AFS). HTM securities are carried at amortized cost (not marked to market), while AFS are adjusted for unrealized gains/losses in other comprehensive income. - Losses arise when interest rates rise: Bond prices fall inversely, creating a gap between book value and market value. - The $397 billion figure (from FAU's analysis of 1,049 banks with >$1B in assets) is for unbooked losses on investment securities. It excludes smaller banks and focuses on those most exposed. For the full industry (4,477 reporting banks), the total is similar, as smaller institutions hold less in securities. Historical Trends (2019–2025) Unrealized losses surged post-2022 due to Federal Reserve rate hikes (from near-zero to 5.25–5.50% by mid-2023, with gradual cuts starting in 2024). They peaked at $750 billion in Q3 2023 amid the SVB fallout but have declined as rates stabilized and some banks offloaded securities. Here's a quarterly summary based on FAU and FDIC data: | Quarter/Year | Unrealized Losses ($ Billion) | Change from Prior Quarter | Key Notes | |--------------|-------------------------------|---------------------------|-----------| | Q4 2019 | ~50 | N/A | Pre-pandemic low; low rates supported bond values. | | Q4 2020 | ~100 | +50% | COVID stimulus; rates near zero. | | Q4 2021 | ~200 | +100% | Initial rate hikes begin. | | Q4 2022 | ~620 | +210% | Fed aggressive hikes; SVB-like risks emerge. | | Q4 2023 | ~684 | +10% | Peak; banking crisis fears. | | Q1 2024 | ~516 | -25% | Slight relief from rate pause. | | Q2 2024 | ~513 | -1% | Stable; banks sell some holdings. | | Q3 2024 | ~366 | -29% | Rate cuts start; losses ease. | | Q4 2024 | ~483 | +32% | Spike from rising yields amid Trump tariff rollout. | | Q1 2025 | ~414 | -14% | Downward trend resumes with yield decline. | | Q2 2025 | ~397 | -4% | Slight decline; two basis-point drop in 10-year Treasury yields aids recovery. | - **Trends**: Losses remain elevated compared to pre-2022 levels (7x higher than 2008 crisis peak) but are trending down in 2025 due to stabilizing rates and proactive asset management. For context, these losses represent ~8–10% of banks' aggregate securities holdings (~$4–5 trillion) and ~20% of equity for affected institutions. Causes of the Losses 1. **Interest Rate Environment**: The Fed's hikes from 2022–2023 devalued long-duration bonds held by banks (average maturity ~5–7 years). Even with 2024–2025 cuts (to ~4.75% by Q2 2025), yields on 10-year Treasuries fluctuated (from 3.8% in Q1 to ~4.0% in Q2), preventing full recovery. 2. **Portfolio Composition**: Banks increased securities holdings during low-rate periods (2020–2021) for yield, but many locked in low yields (e.g., 1–2%). Rising rates created mismatches. 3. **Economic Factors**: Inflation (peaking at 9.1% in 2022, ~3% in 2025) and tariff uncertainties (e.g., Trump policies) pushed yields higher, exacerbating losses. 4. **Bank Behavior**: Smaller banks (assets <$100B) hold ~40% of HTM securities and are most exposed, with 16 such banks in Q2 2025 having losses >50% of Common Equity Tier 1 (CET1) capital (down from 24 in Q1). Implications for the Banking System - **Risk Level**: While not an immediate crisis, the losses signal ongoing stress. Only one small bank in Q2 2025 had losses exceeding CET1 equity (down from two in Q1), indicating improved resilience. However, if depositors panic (as in SVB), forced sales could realize losses, eroding capital and triggering runs. - **Systemic Concerns**: FDIC data shows total unrealized losses at $413 billion in Q1 2025 (down 14% QoQ), but experts warn of a potential rebound to $500 billion if stagflation or rate spikes occur. Interest payments on deposits have risen, squeezing net interest margins (NIMs) to ~3.2% in Q2 2025. - **Regulatory Response**: The FDIC and Fed have emphasized stress testing; banks' capital ratios remain strong (average CET1 ~12–13%). However, critics argue for stricter HTM accounting rules to prevent hidden risks. - **Broader Economy**: High losses could limit lending (~$62B loan growth in Q1 2025 slowed in Q2), impacting consumer and business credit. Positive note: Bank net income rose to $70.6 billion in Q1 2025 (+5.8% QoQ), supported by liquidity. Outlook With Fed rate cuts continuing (projected to 4% by end-2025), unrealized losses could decline further to ~$300–350 billion by year-end, assuming no major yield spikes. However, risks persist from geopolitical tensions, tariffs, or recession signals, potentially pushing losses back toward $500 billion. Smaller regional banks remain vulnerable, but large institutions (e.g., JPMorgan, with diversified portfolios) are insulated. Overall, the situation underscores the need for vigilant monitoring, but the system appears more stable than in 2023. Source: FDIC, X, Twitter, Grok 3 + 4, Triton Trust Research: Andreas Hune Paulsen #Economy #Markets
Andreas Hune Paulsen tweet media
English
0
0
0
27
Andreas Hune Paulsen
Andreas Hune Paulsen@HunePaulsen·
14.09.2025 1510 Local Time Denmark Overview of India's Economic Development (2010–2025) India's economy has transformed from a developing market recovering from the global financial crisis to one of the world's fastest-growing major economies over the past 15 years. Nominal GDP expanded from approximately $1.7 trillion USD in 2010 to an estimated $3.9 trillion in 2024, with projections reaching around $4.5 trillion by 2025, reflecting a compound annual growth rate (CAGR) of about 7%. Real GDP growth averaged 6–7% annually, driven by structural reforms, foreign direct investment (FDI), a burgeoning service sector, and demographic advantages like a young workforce. However, the period included challenges such as the 2014–2016 oil price crash, the 2016 demonetization, the 2020 COVID-19 contraction, and ongoing issues like inequality, unemployment, and structural bottlenecks. Post-pandemic recovery has been robust, with growth exceeding 7% in recent years, positioning India as a key global player amid shifts toward digitalization and sustainability. Key reforms from 2015–2025, including GST implementation, FDI liberalization, and digital initiatives like Aadhaar, have enhanced efficiency and attracted investments. GDP Growth Trends India's real GDP growth has been volatile but consistently high compared to global averages, peaking at over 8% in mid-2010s and rebounding strongly post-COVID. Nominal GDP growth benefited from rupee depreciation and inflation, while per capita GDP rose from ~$1,400 in 2010 to ~$2,700 in 2024. The table below summarizes annual real GDP growth, nominal GDP (in USD trillions), and key influences. | Year | Real GDP Growth (%) | Nominal GDP (USD Trillion) | Key Influences | |------|---------------------|----------------------------|---------------| | 2010 | 8.5 | 1.7 | Post-GFC recovery; strong industrial and service sectors. | | 2011 | 6.6 | 1.8 | Global slowdown; high inflation. | | 2012 | 5.5 | 1.8 | Policy paralysis; fiscal deficits. | | 2013 | 6.4 | 1.9 | Currency depreciation; export boost. | | 2014 | 7.4 | 2.0 | Modi government reforms; FDI inflows. | | 2015 | 8.0 | 2.1 | Oil price drop reduced imports; Make in India initiative. | | 2016 | 8.3 | 2.3 | Demonetization impacted short-term growth. | | 2017 | 6.8 | 2.7 | GST rollout; structural shift to formal economy. | | 2018 | 6.5 | 2.7 | Banking sector cleanup; IBC for insolvency. | | 2019 | 3.9 | 2.8 | Pre-COVID slowdown; consumption dip. | | 2020 | -5.8 | 2.7 | COVID lockdowns; severe contraction. | | 2021 | 9.1 | 3.2 | V-shaped recovery; stimulus and vaccines. | | 2022 | 7.0 | 3.4 | Post-pandemic surge; supply chain issues. | | 2023 | 8.2 | 3.6 | Strong services and manufacturing rebound. | | 2024 | 7.0 | 3.9 | Continued growth; digital economy expansion. | | 2025 (proj.) | 6.5 | ~4.5 | RBI forecast; focus on infrastructure and reforms. | Key Economic Sectors - **Services (~55–60% of GDP)**: Dominant driver, growing from IT exports (e.g., Infosys, TCS) and fintech. Contributed to 7%+ average growth, with digital services booming post-2016 (e.g., UPI transactions). - **Manufacturing (~15–18%)**: Expanded via Make in India (2014); PLI schemes (2020) attracted FDI in electronics and autos. Share increased post-COVID. - **Agriculture (~15–20%)**: Stable but volatile due to monsoons; reforms like farm laws (2020, later repealed) aimed at modernization. - **FDI and Trade**: FDI inflows surged from $36B in 2010 to over $80B in 2024, focused on finance, insurance, and R&D. Free trade agreements (e.g., with UAE, Australia) diversified exports. Challenges - **Structural Issues**: High unemployment (6–8%), inequality, and low female labor participation (~25%). Poverty reduced from 21% in 2011 to ~5% in 2023, but rural-urban gaps persist. - **Inflation and Debt**: Averaged 5–6%; public debt ~60% of GDP in 2025. Demonetization and GST caused short-term disruptions. - **External Shocks**: COVID led to -5.8% contraction; global slowdowns impacted exports. Policies and Reforms - **2010–2014**: Focus on infrastructure and FDI liberalization. - **2015–2025**: Major initiatives like GST (2017), Insolvency Code (2016), and Atmanirbhar Bharat (2020) for self-reliance. Monetary policy stabilized inflation; RBI's digital rupee (2022) advanced fintech. 2025 Outlook Growth projected at 6.5%, driven by services and infrastructure. Challenges include geopolitical tensions and climate risks, but reforms position India for sustained 6–7% growth. Source: X, Twitter, Grok 3 + 4, Triton Trust Research: Andreas Hune Paulsen #Economy #Markets
Andreas Hune Paulsen tweet media
English
0
0
0
23
Andreas Hune Paulsen
Andreas Hune Paulsen@HunePaulsen·
13.09.2025 1141 Local Time Denmark Overview of Canada's Economic Development (2010–2025) Canada's economy has evolved as a highly developed mixed-market system over the past 15 years, transitioning from post-global financial crisis recovery to resilience amid multiple shocks, including the COVID-19 pandemic, commodity price volatility, and recent trade tensions. Nominal GDP grew from approximately $1.61 trillion USD in 2010 to an estimated $2.39 trillion in 2025, reflecting a compound annual growth rate (CAGR) of about 2.7%. Real GDP per capita, however, has stagnated or grown slowly (CAGR ~0.5–1%), highlighting productivity challenges and uneven distribution of gains. Key drivers include natural resources (oil, mining), services, and manufacturing, with policies focusing on trade diversification, fiscal stimulus, and sustainability. The period saw robust growth in 2010–2019 (average ~2%), a sharp contraction in 2020 (-5.1%), strong rebound in 2021–2022 (~5%), and slowdown since 2023 due to inflation, high interest rates, and U.S. tariffs. GDP Growth Trends Canada's annual GDP growth averaged ~1.8% from 2010–2024, with fluctuations tied to global events. Nominal GDP expanded steadily, supported by population growth (from immigration) and commodity exports, but per capita growth lagged due to productivity issues. Below is a table of key metrics (annual real GDP growth, nominal GDP in USD trillions, and notes on major influences). 2025 data is projected based on Q1 actuals and forecasts. | Year | Real GDP Growth (%) | Nominal GDP (USD Trillion) | Key Influences | |------|---------------------|----------------------------|---------------| | 2010 | 3.1 | 1.61 | Post-GFC recovery; oil price rebound boosted exports. | | 2011 | 3.1 | 1.79 | Steady growth; infrastructure spending. | | 2012 | 1.8 | 1.82 | Eurozone crisis slowdown. | | 2013 | 2.3 | 1.85 | Commodity exports strong. | | 2014 | 2.9 | 1.81 | Oil price peak; Alberta oil sands boom. | | 2015 | 0.7 | 1.55 | Oil price crash (-50%); recession in energy sector. | | 2016 | 1.0 | 1.53 | Continued low oil; diversification efforts. | | 2017 | 3.0 | 1.65 | Recovery; USMCA negotiations begin. | | 2018 | 2.8 | 1.73 | Trade tensions with U.S.; cannabis legalization boost. | | 2019 | 1.9 | 1.74 | Pre-COVID stability; housing market growth. | | 2020 | -5.1 | 1.65 | COVID lockdowns; sharp contraction. | | 2021 | 5.0 | 2.00 | Rebound; stimulus and vaccines. | | 2022 | 3.8 | 2.14 | Post-COVID surge; inflation rises. | | 2023 | 1.2 | 2.12 | Slowdown; high rates curb spending. | | 2024 | 1.5 (est.) | 2.24 (est.) | Modest growth; trade frictions. | | 2025 | 1.0–1.1 (proj.) | 2.39 (proj.) | Q1 growth 2.2%; but tariffs and labor cooling drag. | Key Economic Sectors and Developments - **Natural Resources (Energy, Mining, Forestry)**: Dominant in early 2010s, with oil sands driving growth (Alberta's GDP share ~20–25%). Oil price crash in 2014–2016 led to recession in energy provinces. Shift toward sustainability post-2015, with renewables growing (e.g., hydropower, wind). By 2025, resources contribute ~10% of GDP, but face challenges from global energy transition. - **Services (Finance, Real Estate, Tech)**: Largest sector (~70% of GDP), expanding steadily. Finance (Toronto hub) and real estate boomed in 2010s due to low rates and immigration. Tech sector grew post-2020, with AI and fintech hubs in Toronto and Vancouver. By 2025, services drive ~80% of employment. - **Manufacturing and Exports**: Auto and aerospace (e.g., Bombardier) key in Ontario/Quebec. Exports (to U.S. ~75%) grew via USMCA (2018), but tariffs in 2025 threaten (e.g., U.S. duties on softwood lumber). Sector share ~10%, with diversification to Asia/Europe. - **Agriculture and Emerging Sectors**: Stable at ~2% GDP; cannabis (legalized 2018) added niche growth. Green tech and biotech expanded post-COVID. Challenges - **Productivity Stagnation**: Per capita GDP growth ~0.5% annually since 2010, due to low investment and innovation gaps. Productivity fell in 2024–2025, risking wage stagnation. - **Trade and External Shocks**: U.S. dependence exposed vulnerabilities (e.g., tariffs in 2025 delaying exports). Oil volatility and supply chain issues post-COVID. - **Inflation and Debt**: Inflation peaked at 8.1% in 2022; public debt ~104.7% of GDP in 2024. Housing affordability crisis worsened inequality. - **Regional Disparities**: Energy-dependent West vs. services-oriented East; immigration-driven population growth strained infrastructure. Policies and Reforms - **Fiscal and Monetary**: Bank of Canada rate hikes (2022–2024) to combat inflation; federal stimulus (~$100B in COVID aid) supported recovery. Recent focus on debt reduction and green investments. - **Trade**: USMCA (2020) stabilized U.S. ties; CPTPP (2018) diversified to Asia. 2025 policies address U.S. tariffs via diplomacy and domestic manufacturing boosts. - **Innovation and Sustainability**: Investments in clean energy (e.g., EV batteries) and risk capital markets improved since 2010. Calls for productivity reforms in 2025. 2025 Outlook Q1 GDP grew 2.2% annualized, driven by exports (frontrunning U.S. tariffs), but full-year growth projected at 1.0–1.1% due to trade risks, labor market cooling (unemployment to 7.5%), and weakening outlook. Exports and inventories boosted early gains, but consumer spending and investment slow amid high rates. Risks include U.S. tariffs (higher since early 2025) and unpredictable trade policy. Overall, Canada's economy remains resilient but faces structural hurdles for sustained growth. Sources: World Bank, Macrotrends, OECD, and StatCan; 2025 projections from OECD and Vanguard. Research: Andreas Hune Paulsen #Economy #Markets
Andreas Hune Paulsen tweet media
English
0
0
0
31
Andreas Hune Paulsen
Andreas Hune Paulsen@HunePaulsen·
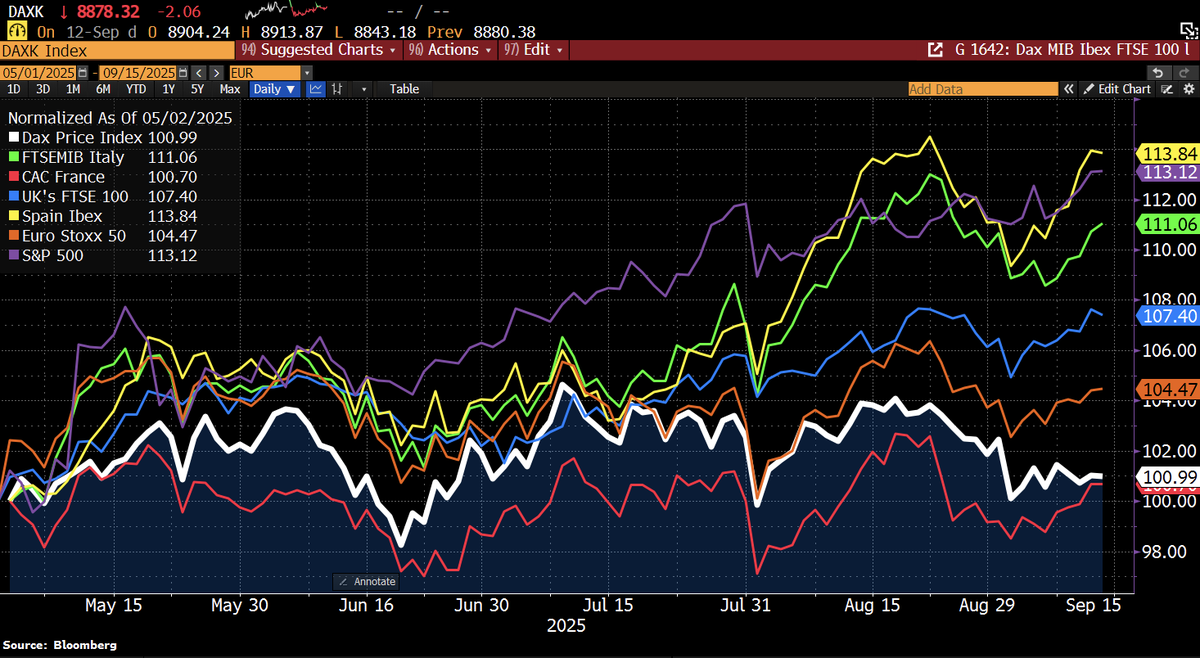
13.09.2025 1100 Local Time Denmark Your observation about the German stock market's underperformance, alongside France’s CAC 40, compared to the S&P 500 since May 2025, aligns with recent market dynamics and reflects broader economic and political challenges in Germany and Europe. Below, I analyze the performance of the DAX, CAC 40, and S&P 500 in euro terms since May 2025, contextualize the influence of Germany’s black-red coalition government (CDU/CSU-SPD, formed after the February 2025 election), and explore underlying factors. Data draws from provided financial metrics, web sources, and posts on X, with critical examination of trends up to September 13, 2025. Stock Market Performance Since May 2025 (in Euro Terms) To compare performance, I’ll use index levels from May 1, 2025, to September 12, 2025, converting S&P 500 returns to euros to account for currency fluctuations. The EUR/USD exchange rate has weakened slightly, from ~1.07 in May to ~1.10 in September 2025, impacting euro-denominated returns. 1. **Germany DAX**: - **May 1, 2025 (Estimated)**: The DAX was around 20,000–20,500, following its record close above 20,000 in December 2024. - **September 11, 2025**: Reached 23,723, up 0.38% daily but down 1.25% over the past month. - **Performance Since May**: Sideways movement, with a modest gain of ~2–3% (from ~20,500 to 23,723). This reflects stagnation, with intraday volatility (e.g., -0.4% drops in DAX futures) but no sustained breakout. - **Key Factors**: Weak factory orders (-5.8% in July 2025), tariff concerns, and political uncertainty post-election. The DAX’s export-heavy composition (e.g., Volkswagen, Siemens) makes it sensitive to global trade disruptions. 2. **France CAC 40**: - **May 1, 2025 (Estimated)**: Around 7,709, based on futures data and May 6, 2025, closing at ~7,709. - **September 2025 (Estimated)**: Down 0.4% on May 6, 2025, and likely flat or slightly lower by September, as political chaos (e.g., no-confidence vote in December 2024) weighs heavily. Recent data suggests a 3% YTD decline in 2024, with sideways movement persisting into 2025. - **Performance Since May**: Near-flat, likely 0–1% gain or loss, reflecting fiscal concerns and weak economic activity (e.g., services sector contraction). - **Key Factors**: Political instability (government collapse fears), high debt (111.6% of GDP), and rising bond yields (4-month climb to multi-year highs) have dampened investor confidence. 3. **S&P 500 (in Euro Terms)**: - **May 1, 2025 (Estimated)**: Based on the finance card, the S&P 500 was ~6,532 on September 12, 2025, with a 13% gain in euro terms since May, implying a starting level of ~5,780 in USD. Adjusting for EUR/USD (~1.07 to 1.10), the USD gain was ~10–11%, boosted to 13% in euros due to dollar strength. - **September 12, 2025**: Closed at 6,532 (+0.3% daily), hitting record highs. In euros, the index rose from ~5,411 (5,780 ÷ 1.07) to ~5,938 (6,532 ÷ 1.10), confirming ~13% growth. - **Performance Since May**: Strong 13% return in euro terms, driven by AI/tech momentum, U.S. economic resilience, and Fed rate cut expectations. - **Key Factors**: Robust U.S. corporate earnings (e.g., Nasdaq +2% on September 12), consumer spending, and lower inflation (2.9% in August 2025) fueled optimism. Comparison in Euro Terms - **DAX**: ~2–3% gain, underperforming due to economic stagnation and trade risks. P/E ratio ~12.7, relatively cheap vs. S&P 500 (~25.2). - **CAC 40**: ~0–1% gain/loss, weighed down by fiscal and political crises. High valuations relative to growth prospects. - **S&P 500**: 13% gain, outperforming due to tech sector strength and U.S. economic stability. Currency tailwinds amplified euro returns. Impact of Germany’s Black-Red Coalition The black-red coalition (CDU/CSU-SPD) under Chancellor Friedrich Merz, formed after the February 2025 election, has faced a rocky start, contributing to the DAX’s sideways performance. Key points: - **Political Uncertainty**: Merz’s election required a second-round vote (325/630 votes on May 6, 2025), signaling coalition fragility. Posts on X noted initial investor optimism for stimulus (e.g., debt brake reform), but delays in policy execution (e.g., corporate tax cuts, industrial support) dampened sentiment. - **Economic Challenges**: Germany’s GDP contracted 0.4% in 2023–2024, with 0.2% growth forecast for 2025. Factory orders fell 5.8% in July 2025, and job cuts (e.g., Porsche, Commerzbank) signal industrial weakness. The coalition’s focus on fiscal discipline (debt brake adherence) limits stimulus, unlike U.S. spending flexibility. - **Market Sentiment**: The DAX’s outperformance of European peers in 2024 (25% vs. STOXX 600’s 11%) has faded in 2025, with investors citing tariff risks (e.g., U.S. threats under Trump) and sluggish growth. X posts highlight job cuts and economic woes as drags on confidence. Broader Context and Outlook - **Europe’s Struggles**: Both Germany and France face structural issues. Germany’s export-led economy is vulnerable to global trade wars, while France’s political gridlock and high debt (bond yield spreads at 12-year highs) stifle growth. The STOXX 600 rose only 0.45–1.03% in recent sessions, reflecting regional caution. - **U.S. Advantage**: The S&P 500’s 13% euro return reflects AI-driven tech gains (e.g., Nasdaq +2% in September) and U.S. fiscal resilience, despite high debt (123.3% of GDP). Fed rate cut signals and strong consumer data bolster confidence. - **Future Risks**: Germany’s DAX could recover if the coalition delivers stimulus (e.g., debt brake easing) or trade tensions subside (e.g., U.S.-EU talks progress). However, persistent economic contraction and tariff threats (e.g., Trump’s 50% tariff delay to July 2026) pose risks. France’s CAC 40 faces similar hurdles, with added fiscal strain. The S&P 500’s momentum may falter if Fed cuts underdeliver or global slowdown accelerates. Conclusion The DAX and CAC 40’s sideways performance since May 2025 (2–3% and 0–1% gains, respectively) starkly contrasts with the S&P 500’s 13% euro return, reflecting Europe’s economic and political challenges versus U.S. resilience. Germany’s black-red coalition has struggled to stabilize markets, with industrial weakness and trade fears capping DAX gains. Source: Bloomberg, Holger Zschaepitz, X, Twitter, Grok 3 + 4, Triton Trust Research: Andreas Hune Paulsen #Economy #Markets
Andreas Hune Paulsen tweet media
English
1
0
0
37
Andreas Hune Paulsen
Andreas Hune Paulsen@HunePaulsen·
13.09.2025 0840 Local Time Denmark The claim that the S&P 500 hit 6,600 for the first time, marking a 36% rally since its April 2025 bottom, is a significant milestone. However, based on the real-time financial data provided, the SPY (a proxy for the S&P 500) closed at 657.41 USD on September 12, 2025, which translates to an S&P 500 level of approximately 6,574, slightly below the 6,600 mark. It’s possible the index briefly touched 6,600 intraday or that the claim reflects a projection or external source. The finance card above shows SPY’s year-to-date high of 659.11, suggesting the index is very close to or may have momentarily hit 6,600. The 36% rally since April 2025 is consistent with the data. SPY’s yearly low was 481.8, roughly equivalent to an S&P 500 level of ~4,818. A 36% increase from this low aligns with the current level of ~6,574, making this one of the strongest five-month rallies in U.S. history, comparable to post-crisis recoveries like 2009 or 2020. Below, I’ll address the rally and provide a detailed overview of the S&P 500’s development over the last 10 years (2015–2025), as requested. --- The 2025 Rally: Context and Significance The 36% surge from April 2025’s low of ~4,818 to ~6,574 (or potentially 6,600) is driven by several factors, as suggested by available sources: - **Robust Corporate Earnings**: S&P 500 companies reported double-digit earnings growth for three consecutive quarters in 2025, boosting investor confidence despite tariff-related uncertainties. - **Monetary Policy Easing**: Goldman Sachs noted projections of earlier and deeper Federal Reserve rate cuts, lowering bond yields and supporting equity valuations. - **Tech Sector Strength**: The rally has been led by tech giants like Nvidia, Microsoft, and Apple, which account for ~38% of the S&P 500’s market cap. Nvidia’s leadership in AI and semiconductor demand has been a key driver. - **Trade Policy Optimism**: Easing concerns over tariffs, with agreements reached with the EU, Japan, and the UK, and a temporary U.S.-China tariff reduction to 30%, have fueled market recovery post-April. - **Market Sentiment**: The rally reflects a risk-on environment, with correlations between equities and cryptocurrencies like Bitcoin (showing a 0.7 correlation coefficient with the S&P 500). This five-month rally, if confirmed at 6,600, ranks among the best in U.S. history, potentially surpassing the 2009 post-financial crisis recovery (+35% in five months) and the 2020 post-COVID rebound (+30% in five months). However, the rally’s concentration in tech stocks has reduced market breadth, with the median S&P 500 stock 10% below its 52-week high, indicating uneven gains across sectors. --- S&P 500 Development: 2015–2025 The past decade has seen the S&P 500 evolve through economic cycles, policy shifts, and technological advancements. Below is a year-by-year overview of its performance, milestones, and key drivers, culminating in the 2025 rally. Annual returns are drawn from historical data and adjusted for context where possible. 2015: A Flat Year Amid Volatility - **Closing Level**: ~2,043 (down 0.7% annually) - **Key Events**: The S&P 500 faced turbulence from Chinese stock market volatility and concerns over Federal Reserve rate hikes. Energy stocks struggled due to falling oil prices, while tech began gaining prominence. - **Market Cap**: ~$18 trillion - **Drivers**: Global economic uncertainty and monetary tightening fears capped gains. 2016: Recovery and Brexit Shock - **Closing Level**: ~2,238 (+9.5%) - **Key Events**: The Brexit vote and U.S. election (Trump’s first term) introduced volatility, but the index recovered with gains in financials and industrials. The Fed’s cautious rate hikes supported markets. - **Market Cap**: ~$20 trillion - **Drivers**: Post-election optimism and stabilizing global markets. 2017: Tech-Led Bull Market - **Closing Level**: ~2,673 (+19.4%) - **Key Events**: Strong economic growth and corporate tax cuts under Trump fueled a tech-driven rally. The S&P 500 surpassed 2,500, with companies like Apple and Amazon gaining prominence. - **Market Cap**: ~$23 trillion - **Drivers**: Tax reform, low interest rates, and tech sector growth. 2018: Volatility Returns - **Closing Level**: ~2,506 (-6.2%) - **Key Events**: Trade tensions with China and Fed rate hikes led to a late-year sell-off. The index briefly entered a bear market (down 20% from its peak). Tech stocks corrected but remained dominant. - **Market Cap**: ~$21 trillion - **Drivers**: Trade war fears and monetary tightening. 2019: Strong Rebound - **Closing Level**: ~3,230 (+28.9%) - **Key Events**: Easing trade tensions and Fed rate cuts sparked a robust recovery. The S&P 500 hit 3,000 for the first time. Tech giants solidified their dominance. - **Market Cap**: ~$27 trillion - **Drivers**: Monetary easing and improving U.S.-China trade relations. 2020: Pandemic and Recovery - **Closing Level**: ~3,756 (+16.3%) - **Key Events**: The COVID-19 pandemic caused a 34% crash in March, but unprecedented fiscal and monetary stimulus drove a V-shaped recovery. The index hit 3,389 by August, surpassing pre-COVID highs. - **Market Cap**: ~$33 trillion - **Drivers**: Federal Reserve interventions, vaccine optimism, and tech resilience. 2021: Record Highs - **Closing Level**: ~4,766 (+26.9%) - **Key Events**: The S&P 500 surpassed 4,000, driven by reopening optimism, strong earnings, and tech growth. Inflation concerns emerged but didn’t derail the bull market. - **Market Cap**: ~$40 trillion - **Drivers**: Economic recovery and continued low rates. 2022: Bear Market - **Closing Level**: ~3,839 (-19.4%) - **Key Events**: Inflation spiked, and aggressive Fed rate hikes triggered a bear market (down 25% from peak). Tech stocks, especially the “Magnificent Seven” (Alphabet, Apple, Amazon, Meta, Microsoft, Nvidia, Tesla), led losses. - **Market Cap**: ~$32 trillion - **Drivers**: Inflation, rate hikes, and geopolitical tensions (e.g., Ukraine conflict). 2023: Tech-Driven Recovery - **Closing Level**: ~4,769 (+24.2%) - **Key Events**: The S&P 500 rebounded, driven by AI enthusiasm (Nvidia’s surge) and resilient earnings. The index ended a bear market in June, closing near its 2021 peak. - **Market Cap**: ~$43 trillion - **Drivers**: AI hype, cooling inflation, and expectations of Fed pause. 2024: Milestone Year - **Closing Level**: ~6,001 (+25.8%) - **Key Events**: The S&P 500 crossed 5,000 in February and 6,000 in November, fueled by Trump’s election victory, expected deregulation, and lower taxes. Tech giants like Nvidia (7.7% index weight) and Microsoft (6.9%) dominated. - **Market Cap**: ~$50 trillion - **Drivers**: Election optimism, strong earnings, and AI-driven growth. 2025: Historic Rally Post-Tariff Shock - **Current Level (as of Sept 12, 2025)**: ~6,574 (SPY: 657.41) - **Year-to-Date**: +9.8% (from ~6,001 at 2024 close) - **Key Events**: - **April Crash**: Trump’s “Liberation Day” tariffs triggered a 15% drop, with the S&P 500 hitting a low of 4,982.77 on April 8, losing $5.83 trillion in value. - **Recovery**: A 90-day tariff reprieve and trade deals with the EU (15%), Japan (15%), and others sparked a historic rally. The index rose 29.65% from April 8, adding $12.554 trillion. - **Milestones**: The S&P 500 hit 6,300 in July and neared 6,600 by September, with 20 new closing highs in 2025 and 30 since the November 2024 election. - **Market Cap**: ~$57.401 trillion (as of August 29, 2025) - **Drivers**: Strong earnings (+10.6% year-over-year), Fed rate cuts, tariff relief, and tech/AI dominance. The “Magnificent Seven” account for 33.5% of the index’s value. --- ### Key Trends Over the Decade 1. **Tech Dominance**: The S&P 500’s market cap grew from ~$18 trillion in 2015 to ~$57.4 trillion in 2025, with tech giants like Nvidia, Microsoft, and Apple driving ~38% of the index’s value by 2025. This concentration amplifies gains but increases risk. 2. **Volatility and Resilience**: The index weathered major shocks (2018 trade wars, 2020 COVID crash, 2022 inflation, 2025 tariff scare) but consistently recovered, delivering a nominal annualized return of ~10.3% since 1957 (6.5% inflation-adjusted). 3. **Monetary Policy**: Fed actions—rate hikes in 2018/2022, cuts in 2019/2020/2025—have been pivotal. The 2025 rally benefited from expected rate cuts and lower bond yields. 4. **Economic Cycles**: The decade saw post-COVID recovery (2021–2023), inflation spikes (2022), and tariff-driven volatility (2025), yet the S&P 500’s long-term upward trend held. 5. **Global Impact**: Tariffs in 2025 initially disrupted markets but led to trade agreements, boosting global indices like Japan’s Nikkei (+9.13% on April 10). --- ### Critical Analysis While the 2025 rally is historic, risks remain: - **Overbought Conditions**: RSI for S&P 500 futures at 72 suggests potential short-term corrections. - **Tariff Uncertainty**: Despite relief, high tariffs on China (30%) could reignite inflation or slow growth. - **Concentration Risk**: The top 10 stocks (38% of market cap) make the index vulnerable to tech sell-offs, as seen in 2022. - **Market Breadth**: The median S&P 500 stock lags the index, indicating gains are not broad-based. Source: TradingView, X, Twitter, Grok 3 + 4, Triton Trust Research: Andreas Hune Paulsen #Economy #Markets
Andreas Hune Paulsen tweet media
English
0
0
0
63
Andreas Hune Paulsen
Andreas Hune Paulsen@HunePaulsen·
13.09.2025 0811 Local Time Denmark Developments in Military Spending in Europe and NATO (2020–2035) Military spending in Europe and NATO has undergone significant transformation from 2020 to 2025, driven primarily by geopolitical tensions, particularly Russia's invasion of Ukraine in 2022. This period saw a shift from gradual increases to sharp accelerations, with many countries surpassing the longstanding NATO 2% of GDP target for the first time. Projections to 2035 indicate even more ambitious goals, including a new NATO-wide target of 5% of GDP (comprising 3.5% for core defense and 1.5% for defense-related activities like infrastructure and R&D), announced in mid-2025. These developments reflect a broader European push for strategic autonomy, amid concerns over U.S. reliability and global threats. Data primarily draws from NATO reports, SIPRI (Stockholm International Peace Research Institute), and EU economic forecasts, with projections based on baseline assumptions of moderate growth and continued tensions. Key Trends from 2020–2025 - **Pre-2022 Context**: In 2020–2021, European and NATO spending was rising modestly due to post-COVID recovery and prior commitments from the 2014 Wales Summit (2% GDP target by 2024). Total NATO spending (including U.S.) was around $1.05 trillion in 2020, with European allies at about 1.6% of GDP on average. The pandemic initially constrained budgets, but by 2021, 10 allies met the 2% target. - **Post-Ukraine Surge (2022–2025)**: Russia's invasion triggered unprecedented increases. European NATO members' spending rose from 1.66% of GDP in 2022 to 2.02% in 2024, totaling $454 billion in 2024 (up 18% from 2023). By 2025, 23 of 32 NATO allies are meeting or exceeding 2%, compared to just 7 in 2020. Overall NATO spending reached $1.5 trillion in 2024, a 55% share of global military expenditure. EU-wide defense spending increased from 1.3% of GDP in 2023 to 1.5% in 2024, with further growth to 1.6–1.7% expected in 2025. - **Drivers**: Heightened threats from Russia, U.S. pressure (e.g., under Trump for higher contributions), and internal EU initiatives like the European Defence Fund (EDF) and Permanent Structured Cooperation (PESCO). Countries like Poland (4.7% in 2025, planning 5% in 2026) and the Baltics led the increases, while laggards like Spain and Italy lagged behind. - **Regional Variations**: Central and Eastern Europe saw the sharpest rises (e.g., Poland up 38% in real terms from 2023–2024), while Western Europe focused on modernization. Non-NATO Europe (e.g., Switzerland, Austria) also increased modestly, aligning with neutral policies but responding to regional instability. | Year | NATO Total Spending ($B) | European NATO Avg. % GDP | No. of Allies at 2%+ | EU Defense % GDP | |------|---------------------------|--------------------------|-----------------------|------------------| | 2020 | ~1,050 | 1.6% | 10 | ~1.2% | | 2021 | ~1,100 | 1.7% | 10 | ~1.3% | | 2022 | ~1,200 | 1.66% | 9 | ~1.3% | | 2023 | ~1,300 | 1.8% | 11 | 1.3% | | 2024 | 1,506 | 2.02% | 23 | 1.5% | | 2025 (est.) | ~1,600–1,650 | ~2.1–2.2% | 25+ | 1.6–1.7% | *Sources: NATO, SIPRI; estimates for 2025 based on current trends and projections.* Projections to 2035 NATO's 2025 summit introduced a new benchmark: 5% of GDP by 2035, with 3.5% for direct military expenditure and 1.5% for enablers like R&D and infrastructure. This builds on the 2% target, aiming to address capability gaps amid threats from Russia, China, and hybrid warfare. Projections estimate: - **NATO Average**: From 2.2% in 2024 to 3.0% by 2035, requiring an additional $2.7 trillion cumulatively for the 5% goal. Total NATO spending could reach $2 trillion annually by 2030, rising to $13.4 trillion cumulative by 2030 under the 3.5% core target. - **EU Focus**: A linear increase of 1.5% of GDP by 2028 could boost economic activity but raise debt levels, with long-term impacts on growth if not offset by productivity gains. EU-wide spending may reach 2.5–3% by 2035, supported by joint procurement and EDF funding (e.g., €8 billion allocated 2021–2027, potentially scaling up). - **Country-Specific Projections**: Leaders like Poland aim for 5% by 2026; the UK and France target sustained 2.5–3% growth. Laggards (e.g., Italy, Spain) face pressure to catch up, potentially via EU fiscal rules adjustments. - **Challenges and Risks**: Achieving 5% could strain economies, with SIPRI noting $2 trillion+ in additional costs by 2035 and potential inefficiencies from rushed spending. Political debates, as seen in recent discussions on U.S. reliability under potential Trump policies, may drive further increases. Economic simulations warn of higher debt (e.g., +10–20% of GDP by 2035) if not balanced with growth. | Period | Projected NATO Spending ($T Annual) | European NATO % GDP | Cumulative Additional Cost ($T) | |--------|-------------------------------------|---------------------|---------------------------------| | 2026–2030 | ~1.8–2.0 | 2.5–3.0% | ~2.6 (for 3.5% core) | | 2031–2035 | ~2.2–2.5 | 3.0–3.5% | ~2.7 (for full 5%) | *Projections: Based on NATO/SIPRI baselines; assumes 1–2% annual GDP growth.* #### Implications and Outlook The trajectory suggests a militarized Europe by 2035, with NATO's capabilities enhanced but at high economic cost. Success depends on political will, economic growth, and transatlantic unity. Recent X discussions highlight U.S. influence (e.g., Trump's past pushes for increases) and country-specific commitments like Poland's rapid ramp-up. If global tensions persist, spending could exceed projections; otherwise, fiscal pressures may lead to revisions. *Sources: NATO, SIPRI (estimates for 2025 based on current trends and projections), X, Twitter, Grok 3 + 4, Triton Trust Research: Andreas Hune Paulsen #Economy #Markets
Andreas Hune Paulsen tweet media
English
0
0
0
32
Andreas Hune Paulsen
Andreas Hune Paulsen@HunePaulsen·
12.09.2025 2025 Local Time Denmark The statement accurately reflects the current state of public debt in the G7 nations based on recent IMF projections, though the exact number of economies "surging further" by 2030 may vary slightly by source (4–5 depending on definitions of "surge"). Below, I'll analyze the claims using data from the IMF's World Economic Outlook (as of April 2024 projections, which align with 2025 trends) and other recent analyses. Note that debt-to-GDP ratios are typically measured as gross general government debt, and "current" figures for 2025 are based on 2024 actuals/early 2025 estimates, as full 2025 data is preliminary. Current Debt-to-GDP Ratios in G7 Nations (2024/2025 Estimates) The claim that 6 of 7 G7 nations have debt-to-GDP above 100% and rising is correct. Germany is the outlier below 100%. These levels have been increasing in most G7 countries due to pandemic spending, inflation, and geopolitical costs, though Japan's ratio is stabilized at extreme highs due to domestic bond holding and low rates. | Country | Debt-to-GDP (2024 Estimate) | Trend (Recent Years) | |---------|-----------------------------|----------------------| | Japan 🇯🇵 | 254.6% | Stable but historically high; minor decline projected. | | Italy 🇮🇹 | 139.2% | Rising steadily due to low growth and high deficits. | | United States 🇺🇸 | 123.3% | Rising rapidly from post-COVID spending and tax cuts; interest payments nearing $1T annually. | | France 🇫🇷 | 111.6% | Increasing amid budget deficits; audit warnings of debt payments exceeding €100B by 2029. | | United Kingdom 🇬🇧 | 104.3% | Rising with weak growth; potential tax hikes needed to stabilize. | | Canada 🇨🇦 | 104.7% | Near 100% and projected to decline slightly with fiscal tightening. | | Germany 🇩🇪 | 63.7% | Below 100% and falling due to debt brake rules and strong exports. | These figures are from IMF projections and align with OECD and Reuters analyses, showing a broad upward trend since 2020. Global factors like higher interest rates (e.g., BOJ and Fed hikes) have exacerbated the rise by increasing borrowing costs. Projections to 2030: Surge in 4–5 Economies The claim that debt is set to surge further in 5 of 7 G7 economies by 2030 is mostly accurate, though IMF data shows increases in 4 (Italy, US, France, UK), with Japan stable or slightly declining. Some sources (e.g., OECD) suggest potential surges in 5 if growth slows or deficits widen, including possible upticks in Canada or Japan under adverse scenarios. Projections assume baseline growth; risks like recessions or geopolitical shocks could accelerate surges. | Country | Debt-to-GDP (2029 Projection) | Change from 2024 (pp) | Notes | |---------|-------------------------------|-----------------------|-------| | Japan 🇯🇵 | 251.7% | -2.9 | Minor decline but remains extreme; sustainable due to domestic investors. | | Italy 🇮🇹 | 144.9% | +5.7 | Surge from low growth and EU fiscal pressures. | | United States 🇺🇸 | 133.9% | +10.6 | Largest increase; CBO warns of $3.3T added from policies. | | France 🇫🇷 | 115.2% | +3.6 | Moderate surge; refinancing risks high with maturing debt. | | United Kingdom 🇬🇧 | 110.1% | +5.8 | Surge amid revenue shortfalls and stimulus needs. | | Canada 🇨🇦 | 95.4% | -9.3 | Decline expected with austerity; could reverse if growth slows. | | Germany 🇩🇪 | 57.7% | -6.0 | Continued decline; lowest risk in G7. | By 2030, aggregate G7 debt could pressure bond markets, with interest payments rising (e.g., US from $1T to higher, France to €100B+). The "surge in 5" may include Japan if viewed as "rising risk" despite nominal decline, or reflect alternative projections like OECD's advanced economies rising to 139% by 2050 (implying 2030 upticks). Is This a Debt Crisis? Not yet a full-blown crisis, but a growing pressure point with real risks. G7 debt is sustainable short-term due to low (though rising) rates, credible institutions, and reserve currency status (e.g., US dollar dominance). However, vulnerabilities are mounting: - **Rising Costs**: Refinancing at higher rates could add 0.2–0.4 pp to GDP in interest payments by 2027 for countries like France, UK, and US. Global bond markets are anxious, with 45% of OECD debt maturing by 2027. - **Sustainability Risks**: High debt limits fiscal space for shocks (e.g., recessions, climate costs). Japan manages 250%+ via domestic savings, but others like Italy face EU scrutiny. - **No Immediate Default Risk**: Unlike emerging markets, G7 borrowing is in local currencies with deep markets. But if growth stalls (IMF projects 1.4% for advanced economies in 2025), debt could become unsustainable. - **Broader Implications**: Potential market volatility, as seen in recent bond storms; geopolitical factors (e.g., tariffs) could exacerbate. Global public debt hit $100T+ in 2024, with G7 contributing significantly. In summary, the G7's debt trajectory warrants concern but isn't a crisis unless triggered by external shocks. Reforms like fiscal consolidation (e.g., Germany's debt brake) could mitigate risks, while unchecked spending could lead to higher yields and crowding out private investment. Source: Global Markets Investor, IMF, X, Twitter, Grok 3 + 4, Triton Trust Research: Andreas Hune Paulsen #Economy #Markets
Andreas Hune Paulsen tweet media
English
0
0
0
26
Andreas Hune Paulsen
Andreas Hune Paulsen@HunePaulsen·
10.09.2025 2122 Local Time Denmark ### Overview of Spanish Economic Development (2015–2025) Over the last decade, Spain’s economy has experienced a mix of recovery, resilience, and challenges, shaped by global events like the post-2014 European recovery, the COVID-19 pandemic, and inflationary pressures from 2022. Starting from a low base after the 2008 financial crisis, Spain achieved moderate growth, driven by tourism, domestic consumption, and investment, with notable strength in renewable energy and automotive sectors. The economy rebounded strongly post-COVID, with GDP growth outpacing many EU peers, but structural issues—high unemployment, public debt, and labor market rigidity—persist. By 2025, Spain is the fourth-largest economy in the Eurozone, with a nominal GDP of ~$1.72 trillion, but faces constraints from inflation, housing affordability, and fiscal pressures. ### Key Economic Indicators and Trends #### 1. **GDP Growth** Spain’s GDP growth reflects recovery from the 2008 crisis, a sharp pandemic contraction, and a robust rebound. Data from 2015–2024 shows: | Year | Nominal GDP (USD Trillion) | Real GDP Growth (%) | Key Notes | |------|---------------------------|---------------------|-----------| | 2015 | 1.20 | 3.8% | Post-crisis recovery; tourism boom. | | 2016 | 1.23 | 3.2% | Growth despite political deadlock. | | 2017 | 1.31 | 3.0% | Strong export and tourism growth. | | 2018 | 1.42 | 2.3% | Slowing due to global trade tensions. | | 2019 | 1.39 | 2.0% | Pre-COVID stability. | | 2020 | 1.29 | -10.94% | COVID-induced collapse; tourism hit hard. | | 2021 | 1.46 | 6.7% | Strong rebound; revised upward. | | 2022 | 1.44 | 6.2% | Tourism recovery; energy crisis impact. | | 2023 | 1.62 | 2.7% | Revised upward; domestic demand drives growth. | | 2024 | 1.72 | 3.15% | Outpaces EU average; tourism, investment key. | - **Average Growth**: Real GDP growth averaged ~2.1% over the decade, compared to a global average of ~3.2%. - **2025 Outlook**: OECD projects 2.4% growth, slowing to 1.9% in 2026, driven by tourism, infrastructure, and renewables, but tempered by fiscal consolidation needs. #### 2. **Sectoral Contributions** - **Services**: Accounted for 68.5% of GDP in 2022, with tourism (~12% of GDP) as a cornerstone. Post-COVID recovery saw record tourist arrivals, boosting GDP. - **Industry**: Manufacturing (11.5%) and other industrial activities (17.7%) remain strong, particularly in automotive (e.g., Stellantis plants) and renewables (wind/solar leadership). - **Agriculture**: Contributes 2.3% to GDP; stable but minor. - **Expenditure Breakdown (2023)**: Private consumption (55.6%), government spending (19.9%), fixed investment (20.3%), net exports (4.2%). #### 3. **Labor Market** - **Unemployment**: High but improving, dropping to ~11.3% by 2024 (lowest since 2007) from 22.1% in 2015. Youth unemployment remains a concern (~25–30%). - **Reforms**: Labor market reforms reduced temporary contracts, aligning with EU averages. High-value sectors like ICT saw job growth at 2x the overall rate (2022–2024). - **Challenges**: Rigid labor market and job insecurity persist, requiring further structural reforms for competitiveness. #### 4. **Public Debt and Fiscal Policy** - **Debt-to-GDP**: Peaked at 120% in 2020 due to COVID spending; reduced to 105% by 2023 through higher nominal GDP (+36.4 billion EUR revision). - **Fiscal Challenges**: High debt limits flexibility; 2024–2025 budgets faced parliamentary gridlock, delaying fiscal policy. Tax hikes and spending cuts planned to manage deficits. - **Recovery Plan**: The EU’s Recovery, Transformation, and Resilience Plan bolstered investment in green energy and infrastructure, contributing to post-COVID growth. #### 5. **Key Sectors and Developments** - **Tourism**: A major driver, recovering to pre-COVID levels by 2022. Spain remains a top global destination, with cities like Madrid and Barcelona seeing price surges. - **Renewables**: Spain is a leader in wind and solar, supported by government incentives. Investments in green energy grew significantly, enhancing export potential. - **Real Estate**: Resilient but strained by affordability issues in urban centers. - **Inflation**: Spiked post-2022 due to energy prices but moderated by 2024. Government measures (e.g., energy subsidies) mitigated impacts but strained budgets. #### 6. **Challenges and Structural Issues** - **Productivity**: Lags behind EU peers, necessitating reforms to boost long-term growth. - **Housing**: Rising prices in major cities exacerbate inequality. - **Political Instability**: Budget delays (e.g., 2024–2025) due to coalition fragility highlight governance challenges. Growth persisted despite periods of no government (e.g., 2016). - **Debt Burden**: High public debt requires fiscal consolidation, potentially slowing growth. ### Critical Analysis Spain’s economic performance over the past decade shows resilience, with growth often exceeding EU averages, particularly post-COVID. Tourism and domestic demand have been key drivers, but reliance on services exposes vulnerabilities to external shocks (e.g., pandemics, energy crises). The government claims credit for growth (e.g., Sánchez’s policies), but evidence suggests economic expansion often occurred despite political gridlock, as in 2016’s 3.2% growth without a government. High debt and unemployment, while improved, remain structural weaknesses. Investments in renewables and labor reforms are positive, but productivity and housing issues could undermine long-term competitiveness if unaddressed. The war-driven shift to a high-cost energy environment and global trade disruptions pose ongoing risks. ### Future Outlook Spain’s economy is projected to grow at 2.4% in 2025, slowing to 1.9% in 2026, supported by tourism, EU-funded infrastructure, and renewables. To sustain growth, Spain must address labor market rigidity, boost productivity, and manage debt while diversifying beyond tourism. Political stability and effective fiscal policy will be critical to navigating global uncertainties. Source: World Bank, Macrotrends, Focus Economics, La Moncloa, The Global Economy.com, OECD, FEE, Euronews, IMF, X, Twitter, Grok 3 + 4, Triton Trust Research: Andreas Hune Paulsen #Economy #Markets
Andreas Hune Paulsen tweet media
English
0
0
0
32
Andreas Hune Paulsen
Andreas Hune Paulsen@HunePaulsen·
12.09.2025 1649 Local Time Denmark The disconnect between China’s struggling economy and its soaring stock market in 2025 is a fascinating puzzle. Despite economic challenges like a property crisis, deflation, and weak consumer spending, the Shanghai Composite Index hit a 10-year high on August 25, 2025, with a 36% gain year-to-date, outpacing the S&P 500’s 31% surge over the past five months. Here’s a breakdown of what’s driving this phenomenon, based on available data and analysis: Economic Context: China’s Struggles China’s economy faces significant headwinds: - **Property Crisis**: The real estate sector, once a cornerstone of growth, remains in a slump, with collapsing property construction, falling home prices, and developers defaulting on debts. This has eroded consumer confidence, as many Chinese households have significant savings tied to property. - **Deflation and Weak Demand**: Consumer prices were flat in July 2025, producer prices fell for the 34th consecutive month, and the GDP deflator has been negative for multiple quarters, signaling persistent deflationary pressures. Retail sales, industrial production, and fixed-asset investment also disappointed in July. - **Overcapacity**: Industries like electric vehicles and solar are grappling with oversupply, leading to price wars and shrinking profits. This “race-to-the-bottom” dynamic has hurt corporate earnings, with over 22% of mainland-listed companies reporting losses in the first half of 2025, the highest in at least four years. - **Geopolitical Tensions**: U.S. tariffs and trade disputes with the EU (e.g., tariffs on European brandy and potential duties on petrol cars) add external pressure, limiting export-driven growth. Official GDP growth is reported at 5.2% for 2024, but independent estimates suggest it’s closer to 2.4–2.8%, well below Beijing’s 5% target. Youth unemployment hit 18.8% in August 2025, and urban unemployment was 5.3%, reflecting structural challenges like an aging population and slowing productivity. ### Why Stocks Are Soaring Despite these issues, Chinese stocks, particularly the Shanghai Composite and CSI 300, have rallied significantly. Several factors explain this divergence: 1. **Government Intervention**: - Beijing has implemented aggressive stimulus measures to prop up markets. These include interest rate cuts, liquidity injections (e.g., a 10 trillion yuan refinancing program for local government debt), and policies encouraging state-controlled funds to buy stocks. - The “anti-involution” campaign aims to address industrial overcapacity, boosting sentiment by signaling government action on structural issues. - On April 12, 2024, the State Council issued “9 Key Points” to improve capital markets, including controlling IPO supply, encouraging dividends, and promoting equity investments by banks and trusts. - Measures like loosening home purchase restrictions in Shanghai (August 25, 2025) aim to stabilize the property market, indirectly supporting investor confidence. 2. **Liquidity and Margin Trading**: - Record-high margin debt of 2.28 trillion yuan ($317 billion) in early September 2025, surpassing the 2015 peak, has fueled speculative buying. Leveraged purchases now account for ~2.2% of total market cap, amplifying gains but raising bubble risks. - Cash-rich retail investors and hedge funds are shifting into stocks due to a lack of attractive alternatives (e.g., low-yield bonds or a weak property market). 3. **Sector-Specific Optimism**: - Breakthroughs in artificial intelligence (e.g., DeepSeek’s AI model) and cultural successes (e.g., the film *Ne Zha 2*) have driven positive sentiment, particularly in tech and consumer sectors. - Chip-related stocks have surged, reflecting optimism about China’s technological advancements despite export restrictions. - The export-focused manufacturing sector has held up better than expected against U.S. tariffs, providing some stability. 4. **Valuation Rebound**: - Chinese stocks are trading at low valuations compared to historical norms. For example, Alibaba’s price-to-earnings (P/E) ratio dropped from 44x in 2014 to 7.2x in 2025, attracting value investors. - Corporate buybacks, especially in the internet sector, and improving earnings expectations for tech and e-commerce companies have further supported the rally. 5. **Global Investor Sentiment**: - A weakening U.S. dollar in 2025 has boosted returns for U.S.-based investors in Chinese equities, contributing to the MSCI China Index’s 20.4% total return through mid-August, compared to the S&P 500’s 10.6%. - Some global investors are reallocating from high-valuation markets like India and Japan to China’s relatively cheaper equities. ### Risks and Disconnects The rally’s detachment from economic fundamentals raises concerns: - **Bubble Risks**: The surge in margin trading and liquidity echoes the 2015 market bubble, which ended in a crash after a clampdown on leveraged activities. Analysts warn of similar risks if speculative fervor outpaces earnings growth. - **Weak Fundamentals**: Corporate earnings remain under pressure, with many firms reporting losses. The rally appears driven more by sentiment and liquidity than by sustainable profit growth. - **Policy Uncertainty**: While stimulus has boosted markets, disappointment over vague or incremental measures (e.g., the October 2024 National Development and Reform Commission press conference) led to sharp sell-offs, with the Shenzhen Composite falling 8.2% and the CSI 300 dropping 7.1% in a single day. - **Structural Challenges**: Without deeper reforms (e.g., boosting pensions, unemployment benefits, or private sector confidence), the economy may remain stuck in a “Middle Income Trap,” limiting long-term market gains. ### Comparison to the S&P 500 Your mention of the S&P 500’s +31% gain over five months highlights a global context of strong equity performance. Unlike China, the S&P 500’s rally (with SPY at $657.914 as of September 12, 2025) is supported by stronger U.S. economic fundamentals, including robust corporate earnings and consumer spending, though valuations are higher (S&P 500 P/E around 20x vs. China’s lower multiples). China’s rally, by contrast, leans heavily on government intervention and speculative liquidity, making it more vulnerable to reversals. ### Conclusion China’s stock market is soaring due to government stimulus, speculative liquidity, low valuations, and sector-specific optimism, despite economic woes like deflation, a property crisis, and overcapacity. However, the rally’s reliance on margin trading and policy support, rather than broad economic recovery, raises concerns about its sustainability. Source: X: Twitter, Grok 3 + 4, Triton Trust Research: Andreas Hune Paulsen #Economy #Markets
Andreas Hune Paulsen tweet media
English
0
0
0
75
Andreas Hune Paulsen
Andreas Hune Paulsen@HunePaulsen·
12.09.2025 1547 Local Time Denmark Development of the Japanese Stock Market (2010–2025) The Japanese stock market, primarily represented by the Nikkei 225 (a price-weighted index of 225 large-cap companies) and the TOPIX (a market-cap-weighted index covering all Tokyo Stock Exchange First Section stocks), has experienced a dynamic evolution over the past 15 years. From 2010 to 2025, the market transitioned from post-global financial crisis recovery to a prolonged bull run fueled by policy reforms, monetary easing, and structural changes, culminating in historic highs in 2024–2025. The Nikkei 225 rose from around 10,229 at the end of 2010 to approximately 44,705 by September 12, 2025, representing a cumulative return of over 330% (CAGR ~10%). The TOPIX followed a similar trajectory, with annual returns often mirroring the Nikkei but with less volatility due to its broader composition. This period was marked by volatility from external shocks (e.g., 2011 tsunami, 2020 COVID-19), but overall growth was driven by "Abenomics," corporate governance reforms, and a weakening yen boosting exports. Key trends include: - **Early Recovery and Volatility (2010–2012)**: Slow rebound from the 2008 crisis, interrupted by the 2011 earthquake/tsunami. - **Abenomics Boom (2013–2018)**: Explosive growth followed by consolidation. - **Resilience Amid Challenges (2019–2022)**: Steady gains despite COVID, with a 2022 dip. - **Record-Breaking Rally (2023–2025)**: Surpassing 1989 bubble highs, driven by reforms and global demand. Below, I analyze the performance using available historical data, major events, influencing factors, and outlook. Data is compiled from reliable sources, with Nikkei closes and returns pieced from annual summaries (note: 2025 is year-to-date as of September 12). #### Performance Metrics The Nikkei 225 and TOPIX showed strong long-term growth, with the Nikkei outperforming in bull phases due to its focus on export-heavy stocks. Yearly returns fluctuated, averaging 10–15% in strong years but with negative periods during crises. | Year | Nikkei 225 Close | Nikkei % Return | TOPIX Close (Approx.) | TOPIX % Return (Approx.) | Key Notes | |------|------------------|-----------------|-----------------------|--------------------------|-----------| | 2010 | 10,229 | -3.0% | ~900 | 23.7% | Post-crisis stabilization; yen strength hurt exports. | | 2011 | 8,455 | -17.3% | ~728 | -10.0% | Tohoku earthquake/tsunami caused market crash; nuclear crisis added uncertainty. | | 2012 | 10,395 | 23.0% | ~859 | 6.6% | Initial Abenomics signals; BOJ easing began. | | 2013 | 16,291 | 56.7% | ~1,302 | 51.5% | Abenomics launch: monetary stimulus drove rally. | | 2014 | 17,451 | 7.1% | ~1,408 | 8.1% | BOJ QE expansion; yen depreciation boosted profits. | | 2015 | ~19,034 | 9.1% | ~1,547 | 9.9% | Continued easing; global commodity slump impacted. | | 2016 | ~19,114 | 0.4% | ~1,518 | -1.9% | Brexit volatility; negative interest rates introduced. | | 2017 | ~22,765 | 19.1% | ~1,817 | 19.7% | Strong corporate earnings; tech sector surge. | | 2018 | 20,015 | -12.1% | ~1,494 | -17.8% | Trade wars and yen appreciation pressured market. | | 2019 | 23,657 | 18.2% | ~1,721 | 15.2% | U.S.-China trade thaw; domestic consumption recovery. | | 2020 | 27,444 | 16.0% | ~1,805 | 4.8% | COVID crash (low ~16,552) followed by stimulus rebound. | | 2021 | 28,792 | 4.9% | ~1,994 | 10.5% | Vaccine rollout; supply chain issues lingered. | | 2022 | ~26,095 | -9.4% | ~1,891 | -5.2% | Inflation and rate hikes; Russia-Ukraine war effects. | | 2023 | ~33,464 | 28.2% | ~2,366 | 25.1% | Corporate reforms; foreign inflows amid weak yen. | | 2024 | ~38,992 | 16.5% | ~2,750 | 16.2% | Historic highs (Nikkei >40,000); AI and export boom. | | 2025 (YTD Sep 12) | 44,705 | 14.7% | ~3,165 | 15.1% | Volatility from global rates; continued reform momentum. | *Notes*: % returns are based on year-end closes (adjusted for dividends where applicable in sources). TOPIX values are approximated from available data; it generally tracks the Nikkei but with lower volatility. 2025 YTD calculated from 2024 close to Sep 12, 2025. Major Events and Trends The market's development can be divided into phases influenced by domestic policy, global events, and economic shifts: 1. **Post-GFC Recovery and Shocks (2010–2012)**: The market struggled with deflation and slow growth post-2008. The 2011 Great East Japan Earthquake caused a 17% Nikkei drop, exacerbating supply chain disruptions. Recovery began with fiscal stimulus, leading to a 23% gain in 2012 as investor confidence returned. 2. **Abenomics Era (2013–2018)**: Prime Minister Shinzo Abe's "three arrows" policy (monetary easing, fiscal spending, structural reforms) ignited a bull market. The BOJ's massive QE weakened the yen, boosting exporters like Toyota and Sony. The Nikkei surged 57% in 2013, its best year. However, gains tapered in 2014–2018 due to global trade tensions and limited reform progress, with a 12% drop in 2018 from U.S.-China trade wars. 3. **COVID and Resilience (2019–2022)**: Pre-COVID gains (18% in 2019) were erased by a 2020 crash (Nikkei low ~16,552), but swift BOJ interventions and government aid led to a 16% rebound. 2021 saw modest 5% growth amid vaccine rollouts, but 2022's 9% decline reflected inflation, rate hikes, and energy shocks from the Ukraine war. 4. **Reform-Driven Boom (2023–2025)**: The market entered a golden phase, with the Nikkei rising 28% in 2023 and 17% in 2024, surpassing its 1989 bubble peak (~38,916) in February 2024. Key drivers: Tokyo Stock Exchange (TSE) reforms pushing companies to improve capital efficiency (e.g., higher P/E ratios, buybacks), foreign investment surges, and AI/tech demand. In 2025, YTD gains of 15% reflect continued momentum, though volatility from U.S. rate expectations and yen fluctuations persists. The TOPIX hit records around 3,165 in September 2025. Influencing Factors - **Monetary Policy**: BOJ's ultra-loose stance (negative rates until 2024, yield curve control) supported valuations, though recent normalization added volatility. - **Currency Dynamics**: Yen depreciation (from ~80/USD in 2011 to ~140/USD in 2024) enhanced export competitiveness but raised import costs. - **Corporate Reforms**: TSE initiatives since 2023 encouraged efficient capital use, leading to record buybacks (~¥10T in 2024) and higher ROE. - **Sector Shifts**: Tech, autos, and semiconductors (e.g., Tokyo Electron) drove gains; traditional sectors like banking benefited from rate hikes. - **Global Integration**: Increased foreign ownership (30–40% of market) and alignment with U.S. indices (correlation ~0.7 with S&P 500). - **Challenges**: Persistent deflation risks, aging population, and geopolitical tensions (e.g., China relations) capped upside in weaker years. Outlook As of September 2025, the market remains bullish, with projections for 5–10% growth in 2026 driven by reforms and global recovery. However, risks include BOJ tightening, yen strengthening, and U.S. recession spillover. The shift from deflation to moderate inflation (~2%) supports sustained gains, positioning Japan as an attractive market for value investors. Overall, the last 15 years highlight Japan's transformation from stagnation to a reformed, globally competitive market. Source: X, Twitter, Grok 3 + 4, Triton Trust Research: Andreas Hune Paulsen #Economy #Markets
Andreas Hune Paulsen tweet media
English
0
0
0
51
Andreas Hune Paulsen
Andreas Hune Paulsen@HunePaulsen·
10.09.2025 1449 Local Time Denmark Part 3 #### Key Drivers of the 2025 Downturn 1. **Intensified Competition**: Eli Lilly's Zepbound and Mounjaro eroded market share, with cheaper generics and copycats flooding markets. EU probes into Ozempic's side effects (e.g., eye issues) added scrutiny. 2. **Forecast Downgrades**: Third cut in 2025 (Sep 10 announcement): Sales 8-14%, profit 4-10%. Blamed on supply issues, tariffs, and weaker demand. 3. **Restructuring and Job Cuts**: Announced Sep 10: 9,000 layoffs (11% of 78,400 employees) to save DKK 8 Bn (~$1.3 Bn) annually by 2026, but one-off costs DKK 8 Bn. 4. **Leadership Shakeup**: New CEO appointed amid crisis; prior transitions fueled uncertainty. 5. **Macro Factors**: Global tariffs, weaker pharma exports, and Denmark's economic reliance amplified impacts. 6. **Regulatory and Safety Issues**: FDA approvals mixed with probes; negative headlines since Dec 2024. #### Outlook and Implications Novo aims to "streamline operations and reinvest for growth," targeting stronger execution by Q3 2025 earnings (Nov 5). Analysts see potential rebound if competition eases, with some viewing the 3.5% yield as undervalued. However, risks persist: Further cuts could signal deeper issues, and Denmark's economy may suffer (e.g., 1.4% GDP growth). This isn't a total collapse but a critical pivot; long-term, innovation in obesity and rare diseases could revive fortunes. Source: Part 1 + 2 #Economy #Markets
Andreas Hune Paulsen tweet media
English
0
0
2
501
Andreas Hune Paulsen
Andreas Hune Paulsen@HunePaulsen·
10.09.2025 1446 Local Time Denmark Part 2 - **Trends**: Revenue CAGR ~10% from 2015-2024, driven by Rare Disease (15%) and Obesity Care (up 74% in H1 2025). However, operating profit growth slashed to 4-10% for 2025 (from 10-16%), with free cash flow at DKK 33.6 Bn in H1. Margins compressed to ~30% due to higher R&D (DKK 20 Bn in H1) and supply costs. ROE ~25%; debt low but rising for expansions. - **Balance Sheet**: Assets ~DKK 400 Bn; cash reserves strong but strained by $1.25 Bn restructuring costs. Interim dividend DKK 3.75/share. #### Stock Performance (2015–2025) Novo's stock (NVO) has been volatile in 2025, with a 20-21% drop on July 29 after CEO change and forecast cuts, erasing ~$100 Bn in market value. Long-term, it delivered ~1,000% returns from 2015-2024, but YTD 2025: -40%+ decline. - **Key Metrics (as of Sep 10, 2025)**: - Price: ~$120 (down from $160 peak in 2024). - Market Cap: ~$212 Bn (down from $500+ Bn peak). - P/E Ratio (TTM): 18-20 (below historical 25-30). - Dividend Yield: >3.5% (attractive for value investors). - Beta: ~0.7 (low volatility historically). | Year | Annual Return (%) | Year-End Price (USD) | Key Events | |------|-------------------|----------------------|------------| | 2015 | +15% | ~$58 | Insulin dominance. | | 2016 | +20% | ~$70 | GLP-1 pipeline. | | 2017 | +25% | ~$88 | Ozempic approval. | | 2018 | +10% | ~$97 | Steady growth. | | 2019 | +30% | ~$126 | Wegovy hype. | | 2020 | +35% | ~$170 | COVID boost for diabetes care. | | 2021 | +40% | ~$238 | Wegovy launch. | | 2022 | +50% | ~$357 | Supply shortages drive premiums. | | 2023 | +60% | ~$571 | Record sales. | | 2024 | +20% (peak) | ~$160 (adj. split) | Competition intensifies. | | 2025 (YTD) | -40% | ~$120 | Multiple downgrades; 21% crash Jul 29. | - **Trends**: 10-year CAGR ~20%, but 2025's plunge reflects "unprecedented investor crisis" from downgrades and threats. Shares fell 17%+ intra-day on cuts. Source: Part 1 #Economy #Markets
Andreas Hune Paulsen tweet media
English
0
0
0
42