Robert (infra 🏛️⌛️)@infraa_
Oil breaking out = higher inflation, higher rates
Back in 2022 when Russia invaded Ukraine, the price of oil increased 15% within 2 months. Oil seen here in white, hit its peak of $120 a barrel a few months after.
Overlaying CPI in green, we see inflation is essentially a perfect fit to the price of oil. So what did the US do? Inflation was becoming politically untenable.
Well, we ran down the strategic petroleum reserve, seen in red
The US has long depended on the ROW to purchase our debt, and because of the massive fiscal spend following COVID, we needed every buyer we could get.
There was a problem, though.
All of those countries that had long bought our debt, they also were net importers of oil (Japan, South Korea, Eurozone, etc.).
These countries were short energy, just as energy was skyrocketing. Not a good position.
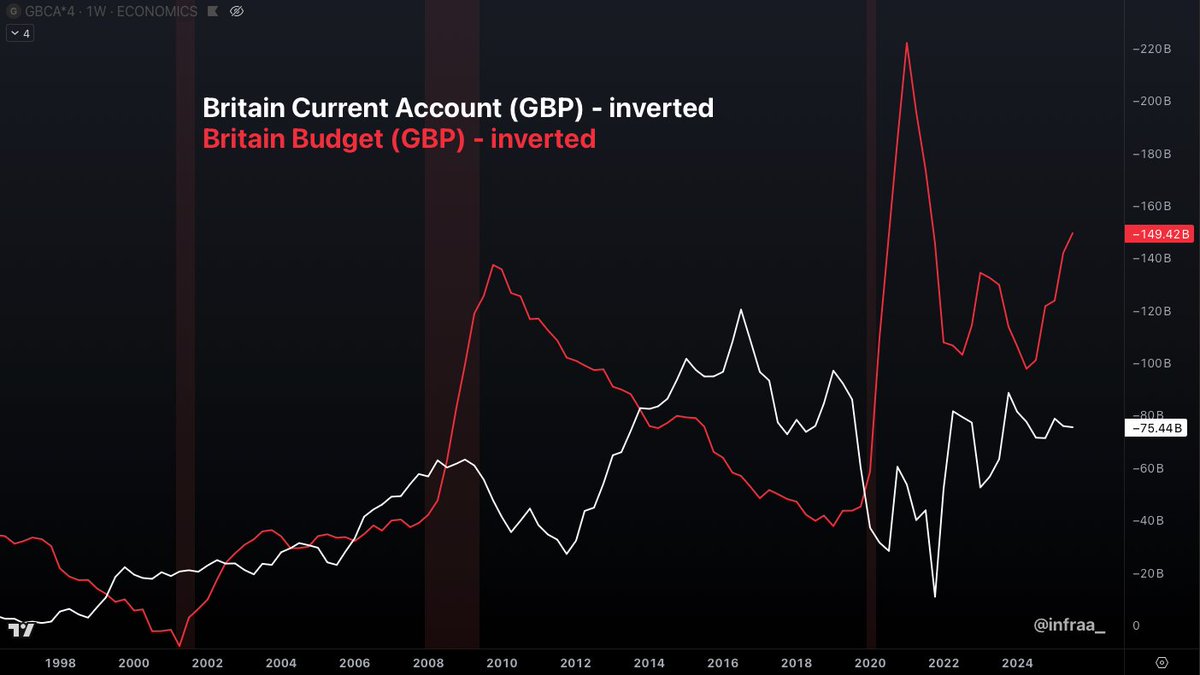
At the same exact time, these net energy importers were being pushed into deficits because of the higher cost of energy.
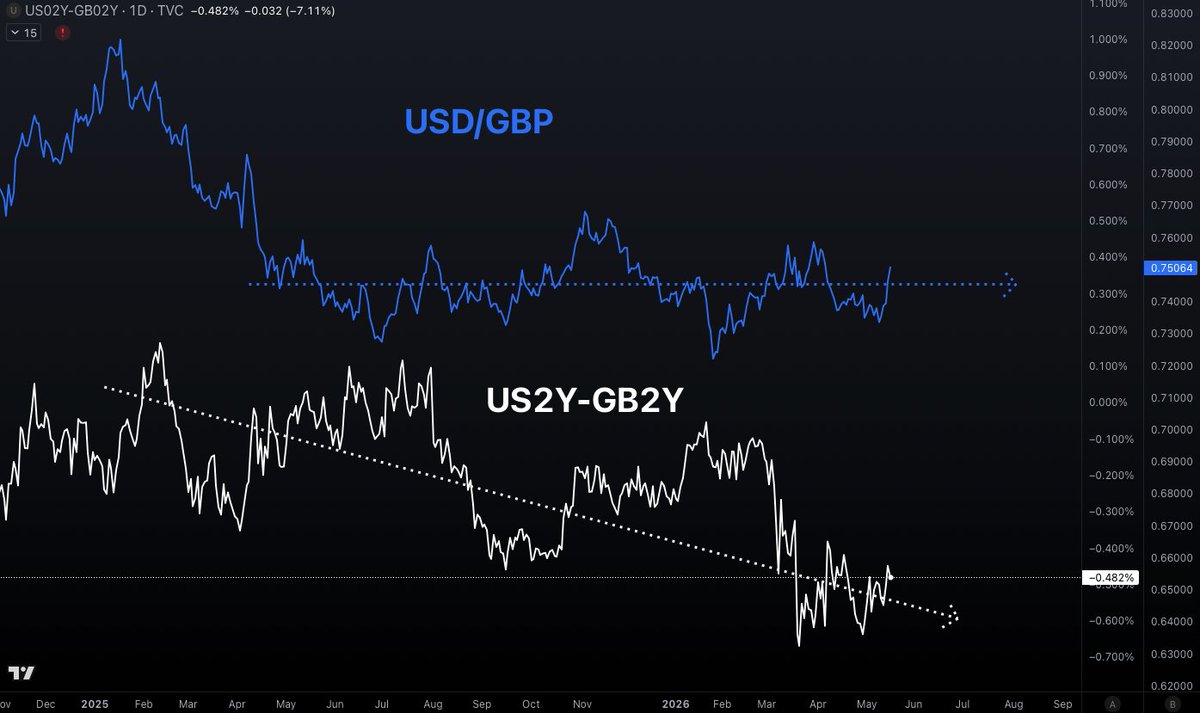
For example, USD/Korea, USD/Yen and USD/Euro (seen in green, yellow and purple) started to massively weaken against the USD. You can see their currencies lag the price of oil by a couple of months.
These countries needed energy. They didn't need treasury bonds- they need gasoline and diesel so their economies didn't immediately collapse.
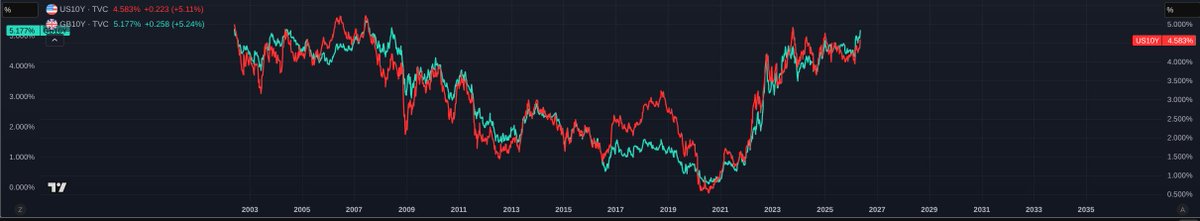
Now let's lay the US 10 year rate in (seen in blue). I removed Euro and KRW and left Yen in yellow, for simplicity's sake (but you can see above what the trend was for all 3).
Sure looks like the Yen (yellow) and US 10yr rate (blue) are a perfect, direct fit with almost 100% correlation
[Oil is still in white, strategic petroleum reserve still in red]
This makes sense if you have hundreds of billions of dollars of treasuries that aren't doing you any good because you're short energy and oil is ripping (importantly, oil is appreciating faster than the yield on those treasuries).
Oil is in the process of breaking out. If this trend continues, not only will we see higher inflation (ex in first slide), but we should also see more selling of treasuries, at a time when we are needing to roll over $9T in debt in the coming 12 months, and let's not forget the $1.8T deficit we are running (with full employment, during peacetime)
They ran the strategic petroleum reserve down by ~350M barrels in the year following the RU/UA war, and there's only another 360M barrels left before it's bone dry.
We know foreign demand of treasuries has been waning for close to a decade. Banks are traumatized from the hundreds of billions in unrealized losses they faced on their treasury positions. Fed, the largest buyer, is saying not only will they not be buying, they'll continue QT.
All at a time that we are running historic deficits, issuing massive avalanches of treasury supply to fund, and in a year in which we need to roll over $9T in debt.
Something is going to break if oil continues higher.