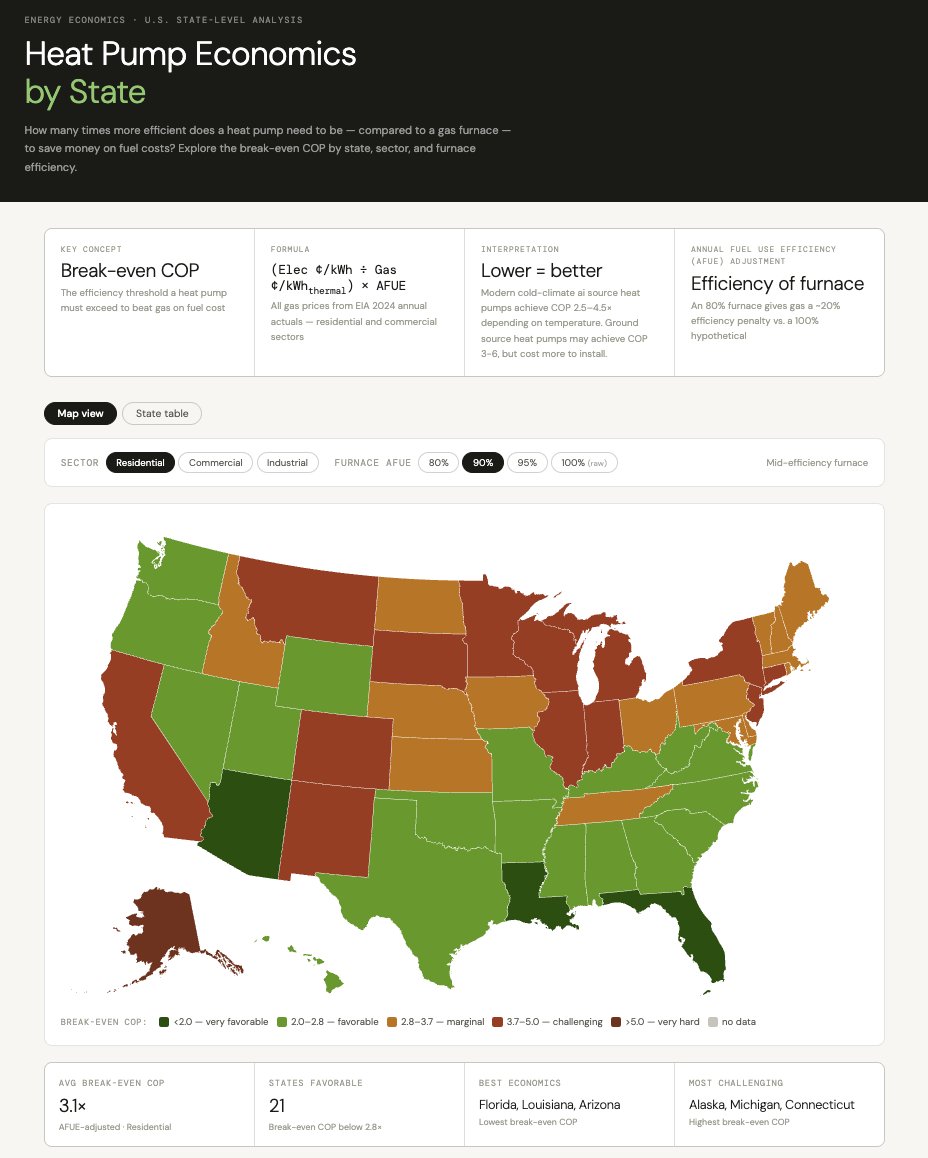
I made a thing: jessejenkins.github.io/heat-pump-map/
By which I mean I told Claude to make a thing.
The economics of heat pumps are very challenging in a country that has cheap gas and where policy makers load retail electricity rates with a whole bunch of policy-related costs (rooftop solar cross-subsidies; 'decoupling' policies that raise volumetric rates to compensate utilities for implementing efficiency programs; public benefits charges, etc.) and price network services volumetrically.
If folks want electrification, affordable electricity is essential, and we need rate reforms that more accurately price electricity's real cost.
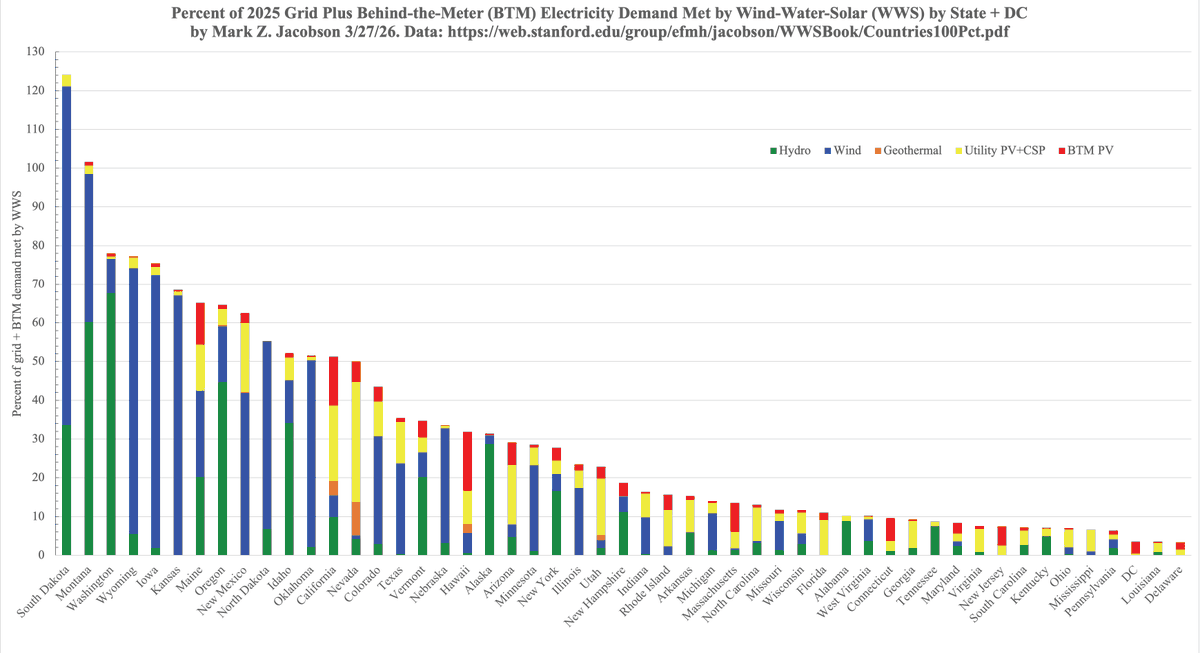
In 2025, two U.S. states met >100% of grid + behind-the-meter electricity demand with WindWaterSolar.
14 states met 50-124% of demand:
7 dominated by wind
3 by solar
4 by hydro
U.S. average: 25.72% WWS
web.stanford.edu/group/efmh/jac…
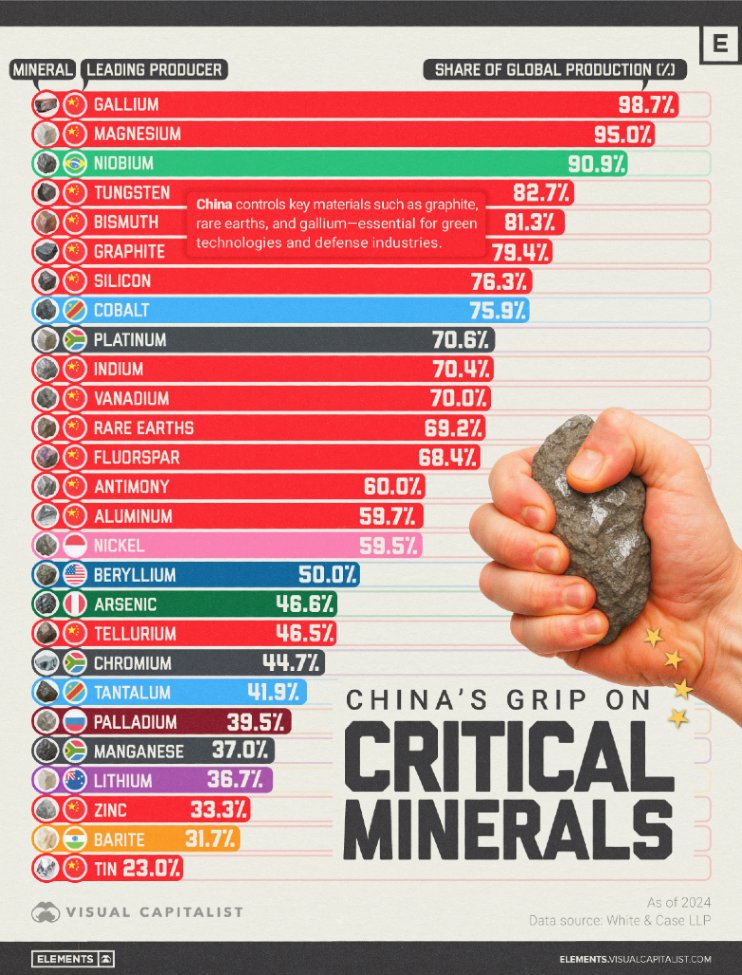
China’s new Five-Year Plan will increase demand for copper
- Add 238-287 GW of new solar capacity annually
- Add at least 120 GW of new wind capacity annually
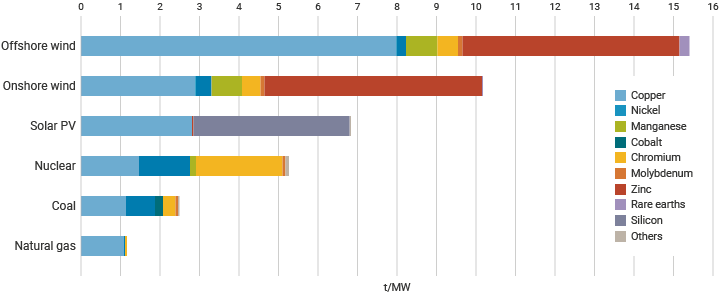
Copper requirement per installed MW of capacity
- Offshore wind: 8t
- Onshore wind: 3t
- Solar: 3t
- Coal: 1t
- Gas: 1t
Renewables need 3x-8x more copper per installed MW than fossil fuels
This is a massive tailwind for copper demand. In fact, the energy transition is the main driver of copper demand, accounting for ~60%.
China currently has 339 gigawatts of wind and solar capacity under construction — roughly two-thirds of the world’s total.
By any serious measure, China is leading the clean energy revolution.
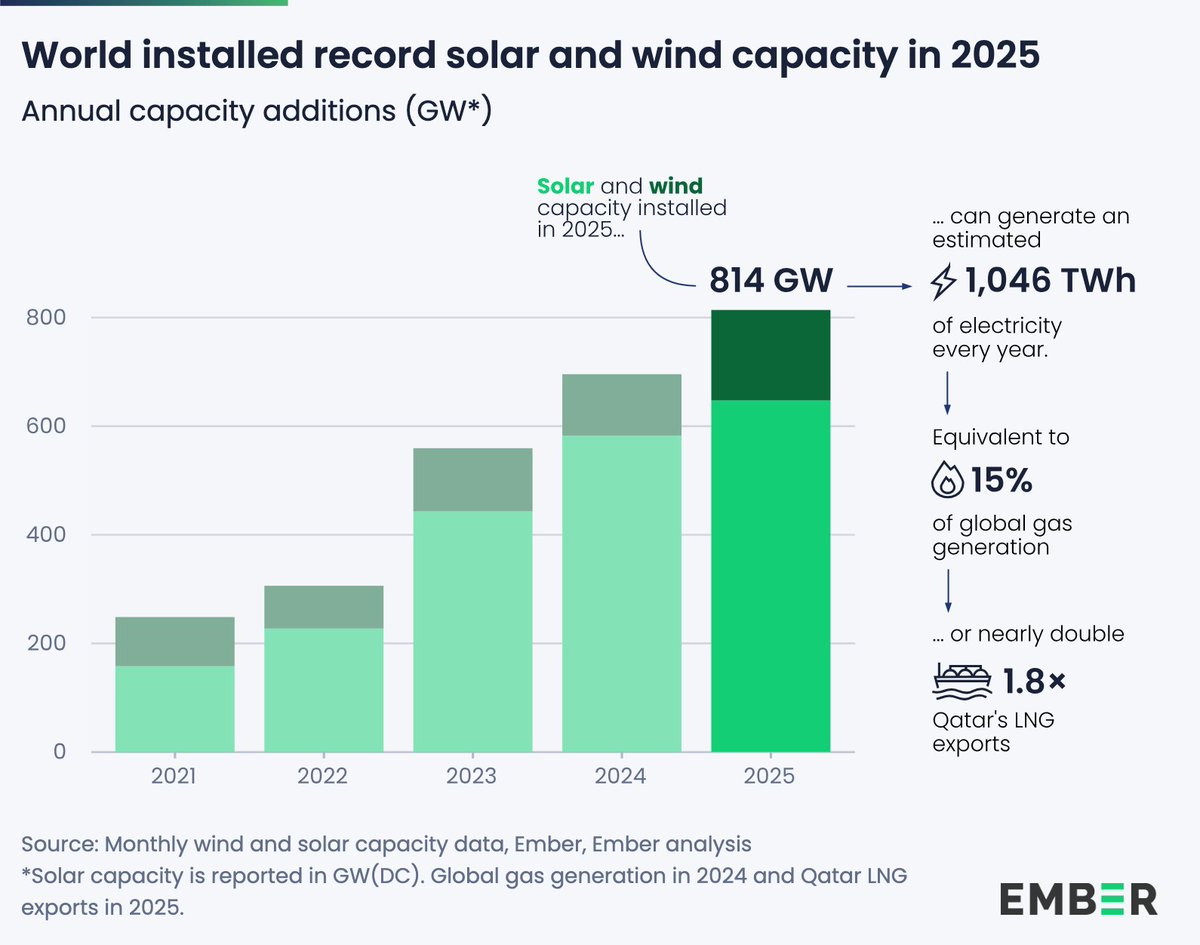
NEW | World adds record 814 GW of solar and wind in 2025, cushioning impact of the gas price crunch ☀️🌪️
The new capacity can generate enough power every year to displace a SEVENTH of global gas generation —or almost DOUBLE Qatar’s annual LNG export volume—saving ~$138 bn 💰
We're having the second energy price crisis in five years caused by volatile global fossil fuel markets.
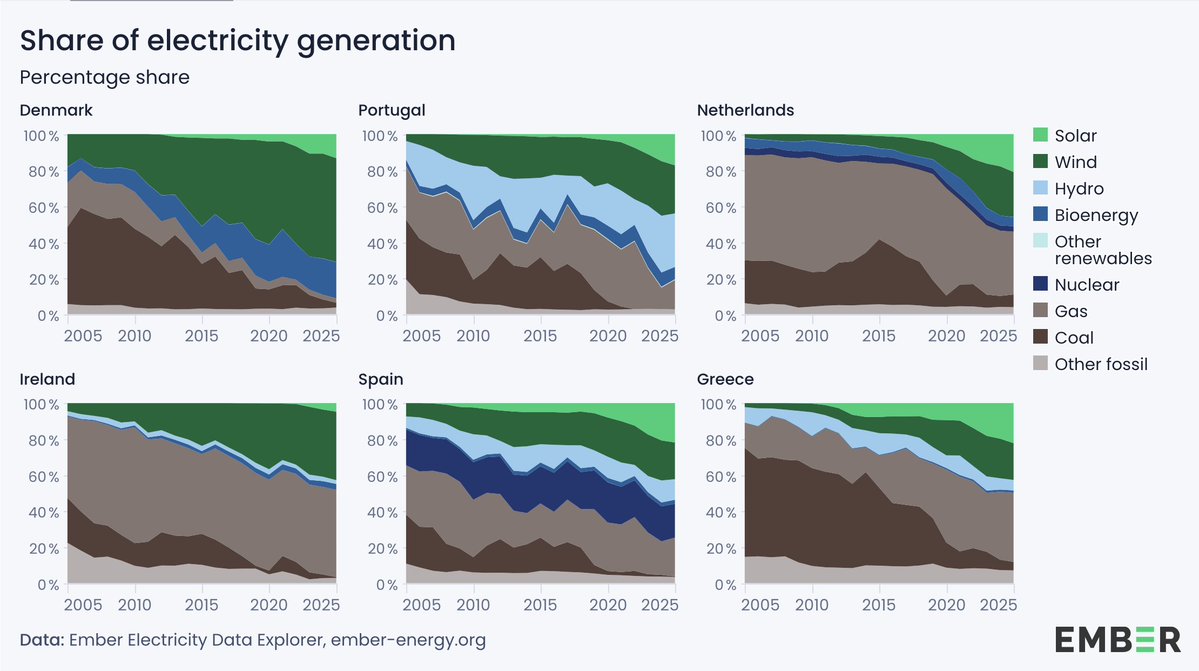
Now imagine how bad the crisis would be in the EU if the electricity mix still looked like it did 20 years ago.
Electricity mix fossil share 2005 → 2025
🇩🇰Denmark: 73% → 9%
🇵🇹Portugal: 82% → 19%
🇳🇱Netherlands: 88% → 46%
🇮🇪Ireland: 93% → 52%
🇪🇸Spain: 66% → 25%
🇬🇷Greece: 89% → 50%
Domestically produced clean energy → energy independence
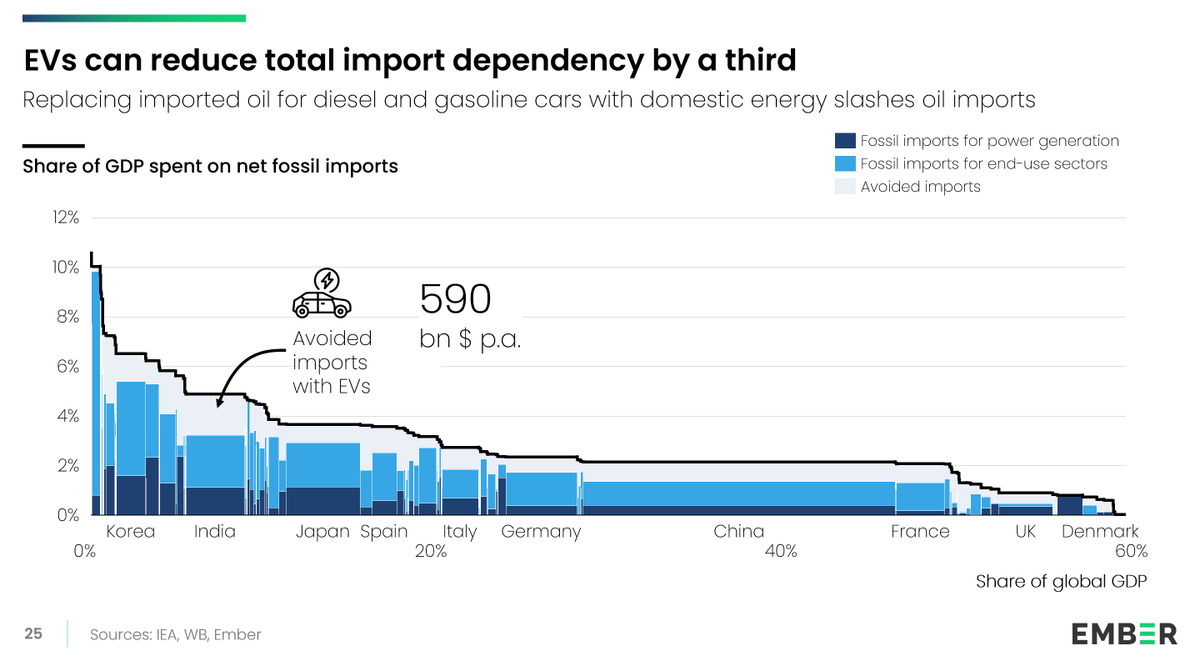
Fossil fuel price shocks due to the Strait of Hormuz conflict show the risk of oil import dependency 🛢️
Replacing imported fossil fuels in transport with EVs can cut fossil imports by a THIRD, reducing exposure to volatile oil markets.
ember-energy.org/latest-insight…
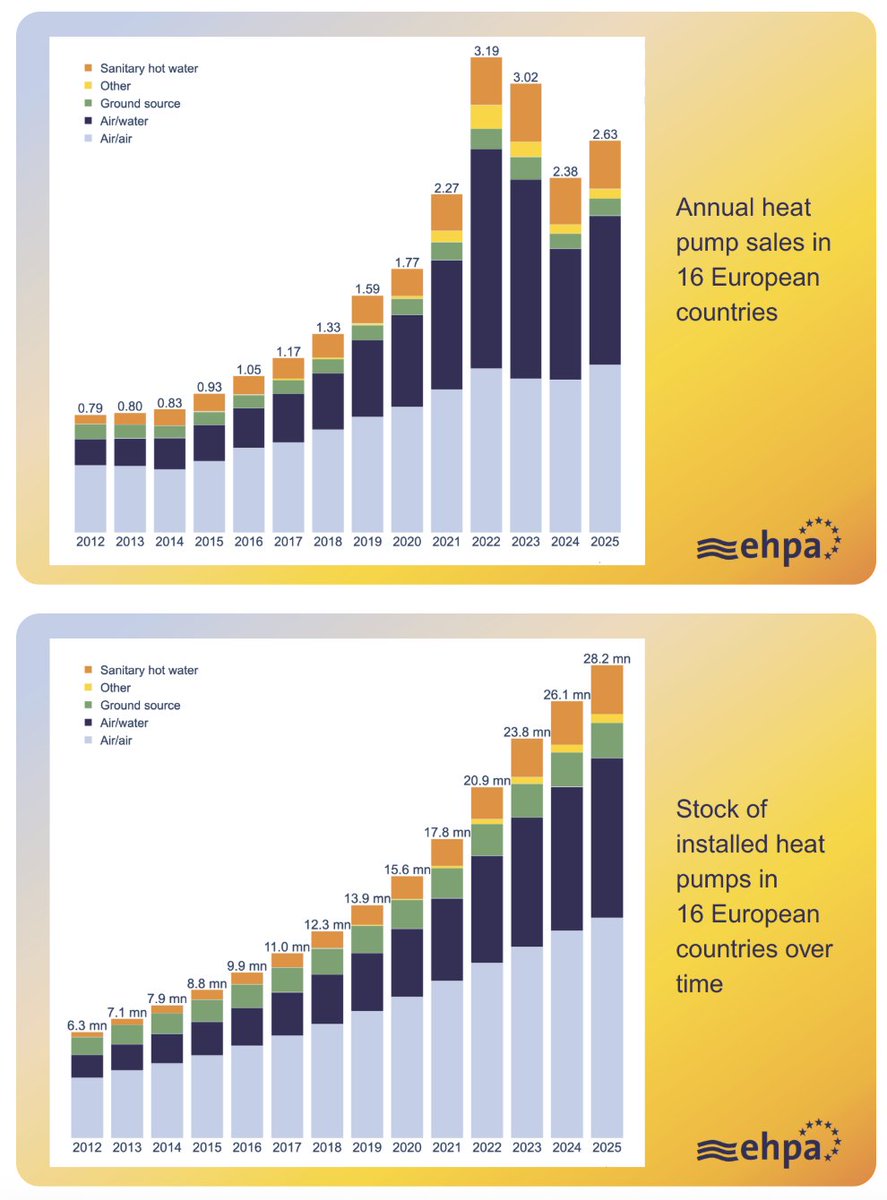
Heat pump sales rose 11% in 2025 across 16 European countries, with 2.63 million units sold.
Twelve countries saw growth, largely where subsidy schemes were stabilised and electricity costs addressed.
Policy certainty and energy levies & taxation are proving decisive.
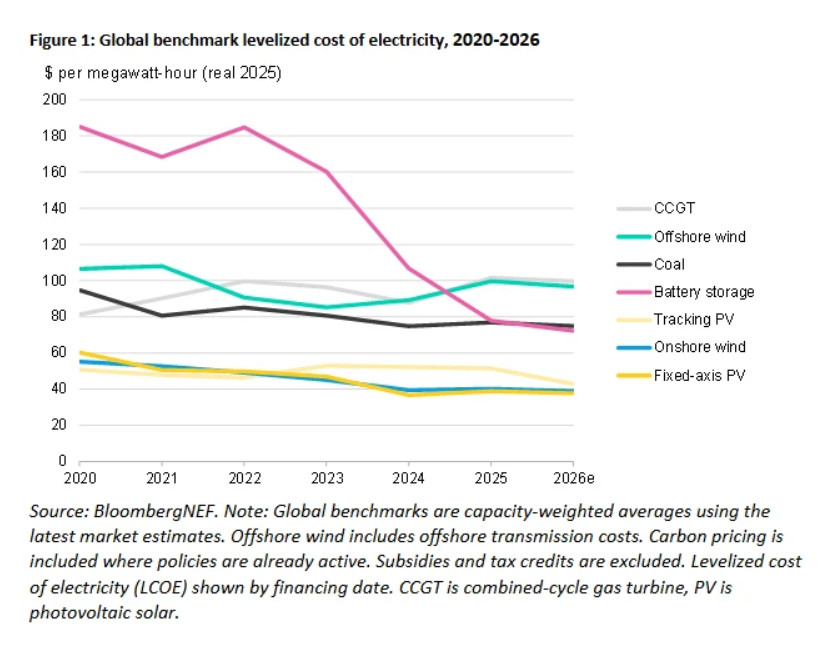
Good morning with good news: Combined solar and battery plant's global average cost is 44% LOWER than the cost of combined-cycle gas plant!
Solar & battery: $57/MWh
Gas: $102/MWh
Solar: $39/MWh
Land wind: $40/MWh
Offshore wind: $100/MWh
WOW!!!
about.bnef.com/insights/clean…
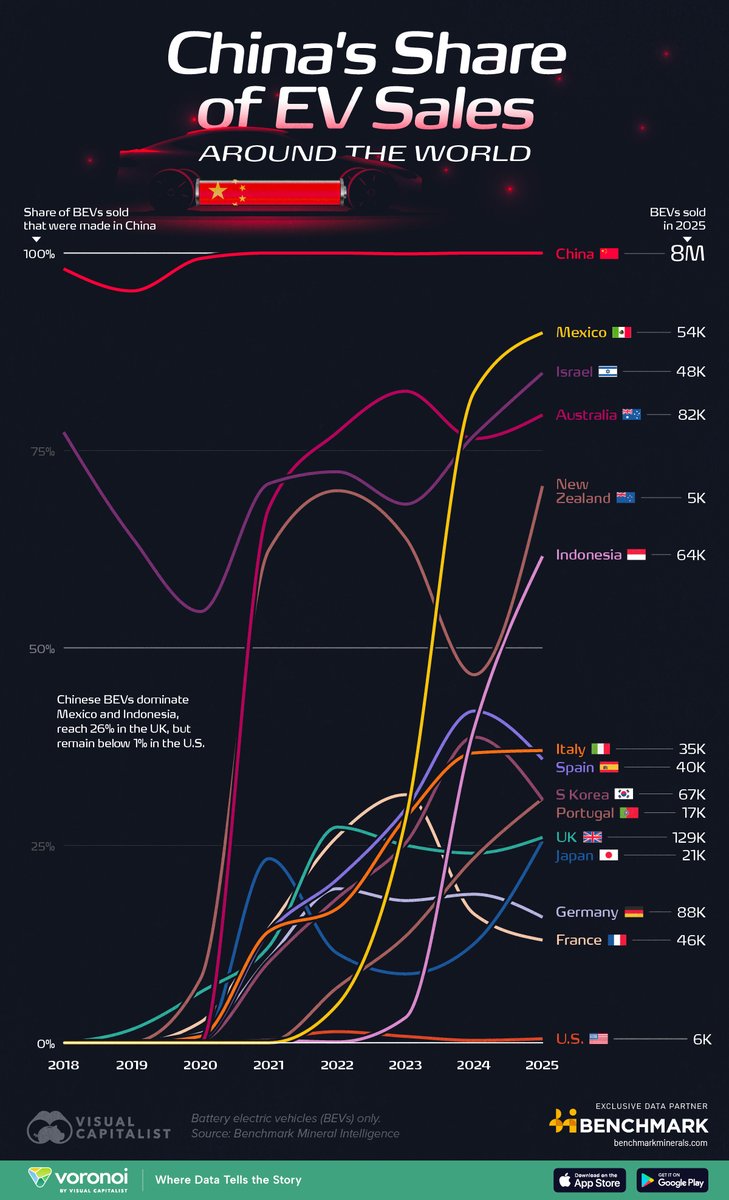
Where Chinese EVs Are Selling the Most Worldwide 🔋
Here, we visualize the share of battery electric vehicles (BEVs) sold in selected countries that were made in China from 2018 to 2025, using exclusive data from our partner, @benchmarkmin.
elements.visualcapitalist.com/where-chinese-…
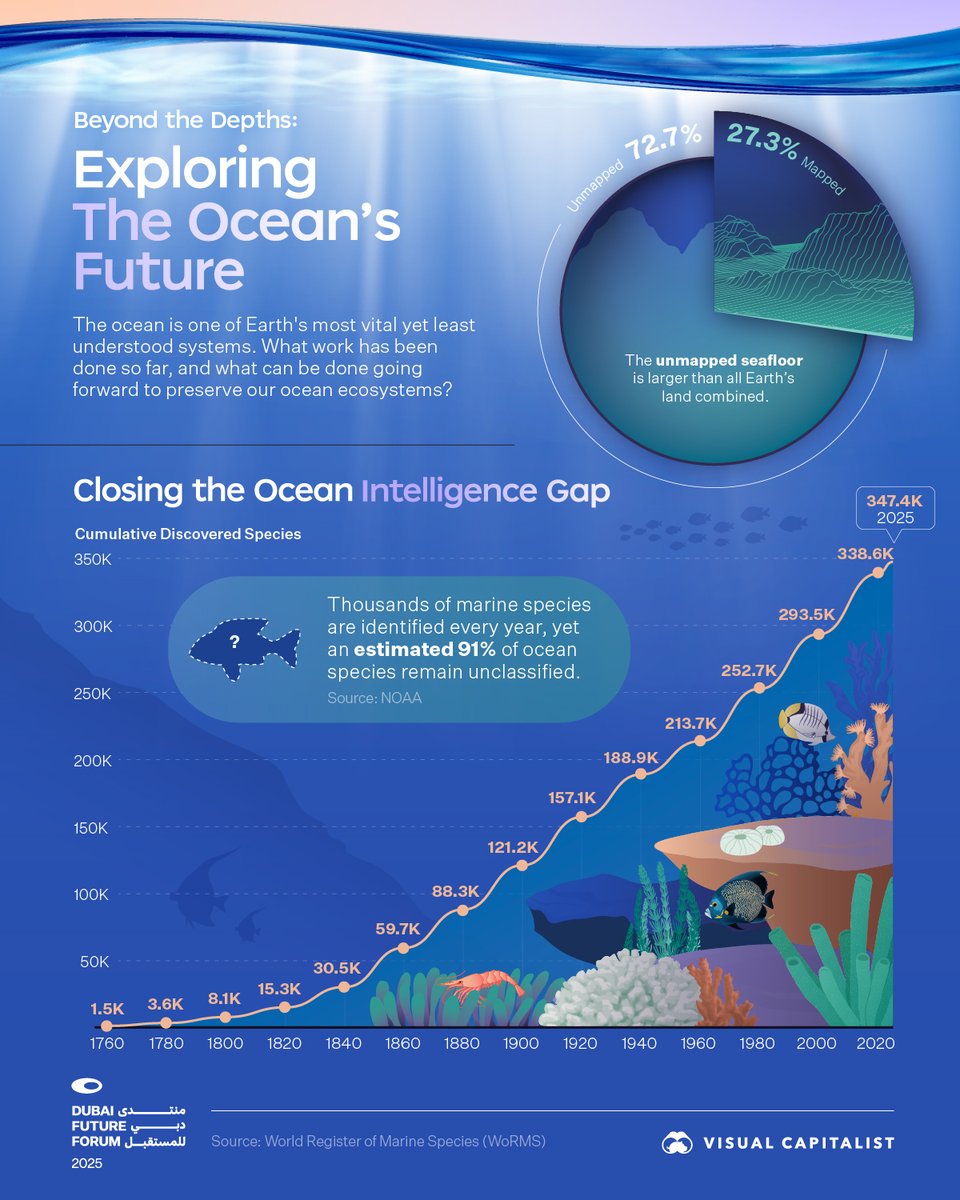
Every year, ocean scientists identify and catalog thousands of new marine species, yet they estimate that 91% of ocean life remains unidentified 🐠
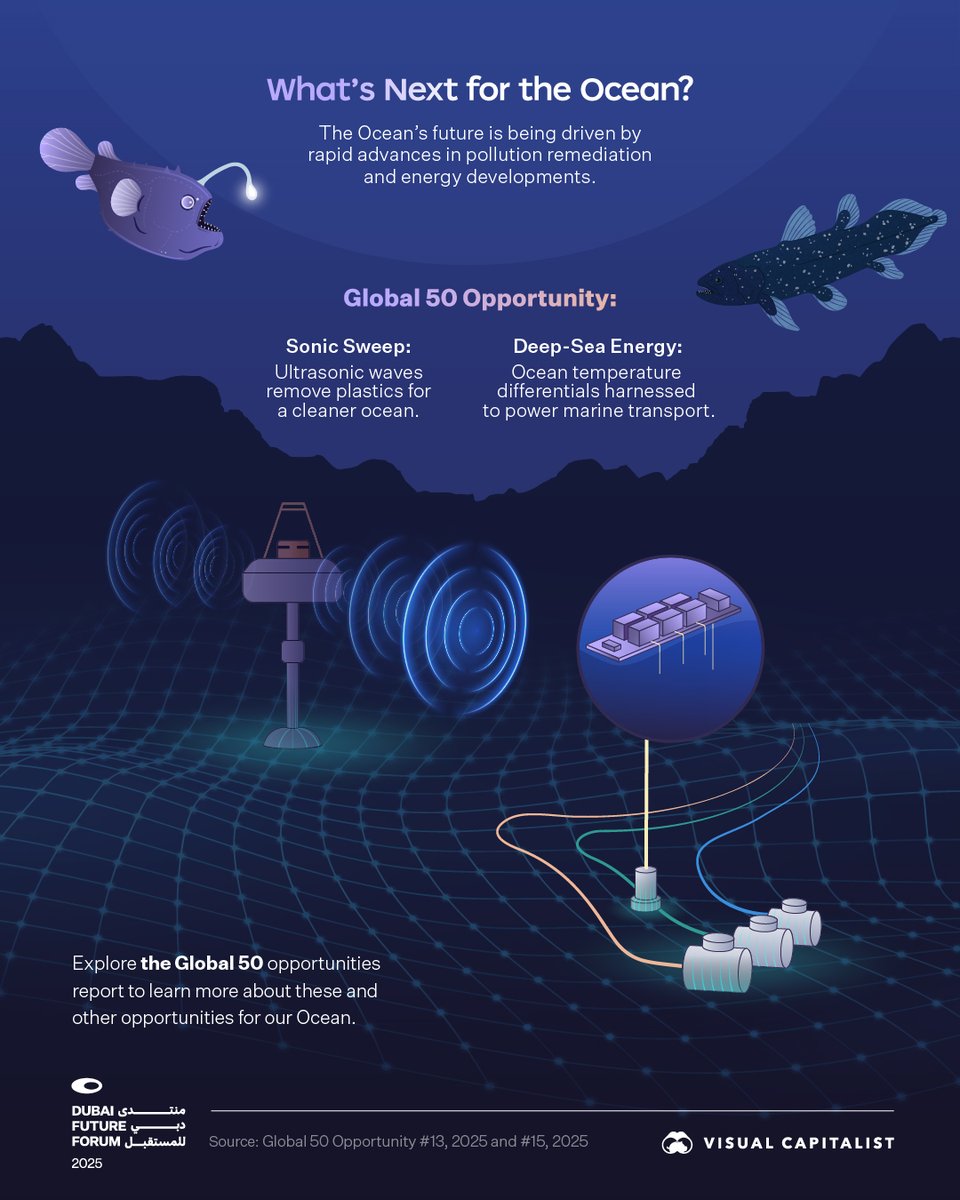
In partnership with @DubaiFuture Forum, this carousel shows how the ocean is filled with untapped opportunities that could shape the future through discovery, investment, and innovation.
visualcapitalist.com/sp/visualized-…#dff02
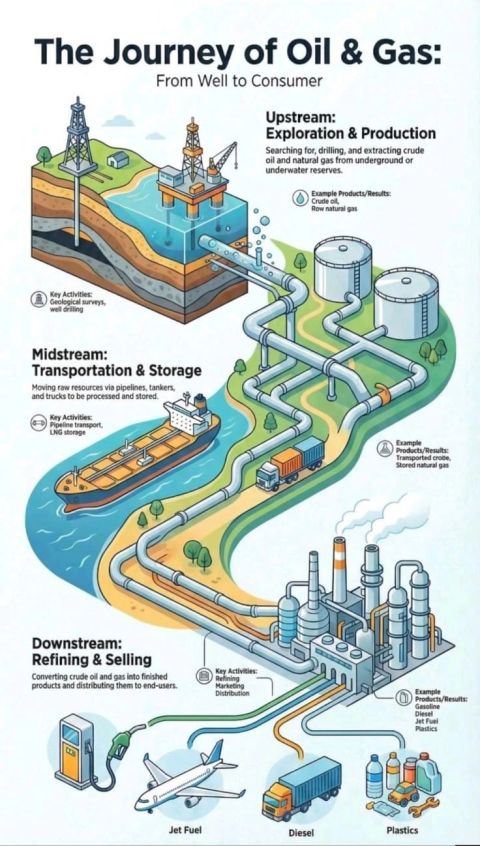
🛢️ The Journey of Oil & Gas. From Well to Consumer
Energy moves through three core stages:
1️⃣ Upstream ( Exploration & Production)
Geologists find reserves.
Wells are drilled.
Crude oil and natural gas are brought to the surface.
This is where molecules are discovered and produced.
2️⃣ Midstream (Transportation & Storage)
Pipelines, #LNG terminals, tankers, trucks.
Oil and gas are moved from fields to refineries or export hubs.
Storage smooths supply and demand imbalances.
This is where infrastructure creates leverage.
3️⃣ Downstream (Refining & Distribution)
Refineries transform crude into:
• Gasoline
• Diesel
• Jet fuel
• Petrochemicals
• Plastics
Finished products are distributed to consumers and industry.
Upstream finds it.
Midstream moves it.
Downstream monetizes it.
The value chain is integrated, capital-intensive, and strategic.
#oott#energy#NaturalGas
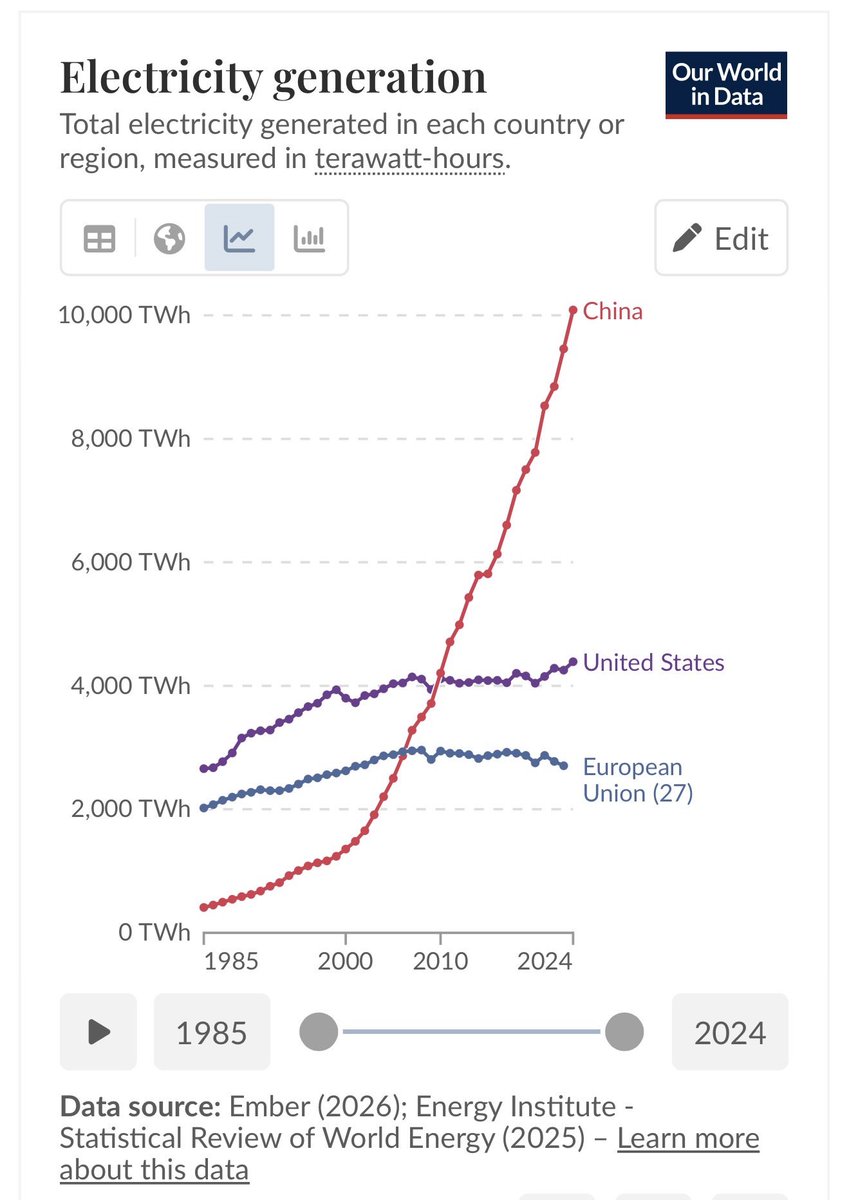
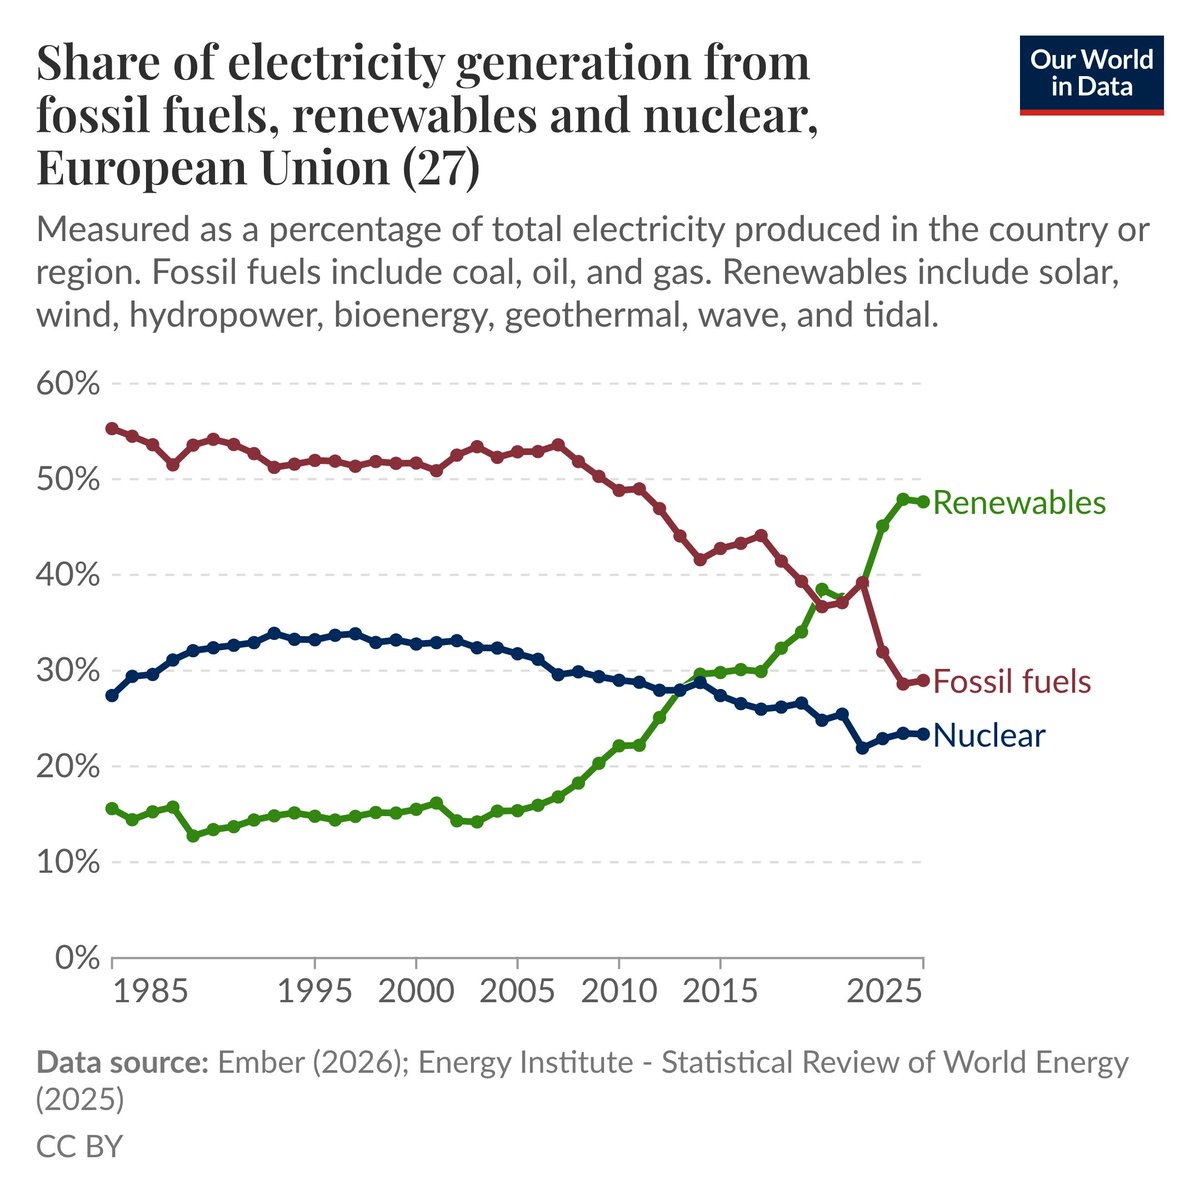
📊 Explore updated data on electricity production in Europe—
Electricity is one major part of how we use energy, alongside transport and heating.
From which sources are countries getting their electricity? Are countries moving away from fossil fuels and toward low-carbon sources like renewables and nuclear?
To help you track this, our colleague Pablo Rosado recently updated our charts with the 2026 European Electricity Review from @ember_energy, an energy think tank.
With this update, our charts now include 2025 data for European countries, including Turkey. We expect Ember’s *Global* Electricity Review for 2026 to be released later this spring.
Can nuclear get below 2 - 3 c/kWh?
Most people think it's impossible, so we built an interactive cost model to debate on a more granular level.
Here's what must be true, line by line, for < 3 c/kWh nuclear.
In my view it's surprisingly feasible... 👇🧵