
Here are the current top 5 largest holdings in the Energy Sector SPDR ETF $XLE
🥇 Exxon Mobil $XOM: 22.52%
🥈 Chevron $CVX: 16.75%
🥉 ConocoPhillips $COP: 6.89%
4. SLB $SLB: 4.60%
5. Williams Companies $WMB: 4.47%
English
IncomeETFs
96 posts

@IncomeETFDaily
Your #1 source for income ETF news, data, and distribution tracking | We track the ETFs that put money in your pocket every month


The 2x Cerebras ETF really launched this morning -- Ticker $CBRG. CBRS started trading at 1pm yesterday and we have a 2x ETF trading at 9:30 am the following morning. Crazy fast turnaround. Will likely see the same sort of turnaround for levered SpaceX, Anthropic, OpenAI etc
Updated weekly distribution announcement! IncomeSTKd 1x Bitcoin & 1X Gold Premium ETF $ISBG & IncomeSTKd 1X US Stocks & 1x Bitcoin Premium ETF $ISSB Distribution Per Share: $0.09 $ISSB Distribution Per Shares $0.085 $ISBG Thank you for your support!
🔥WEEKLY DISTRIBUTION declaration for $BTYB BitBonds™ 5 Yr Enhanced Weekly Option Income ETF 💰 $BTYB targets 8% annually paid WEEKLY 📈 Exposure= 80% 5 Year US Treasuries + 20% Bitcoin $0.03809 Per Share - Payable 5/19/2026 This Week's ROC: 68.34% Fund Disclosures & Distribution Information: vistashares.com/etf/btyb/
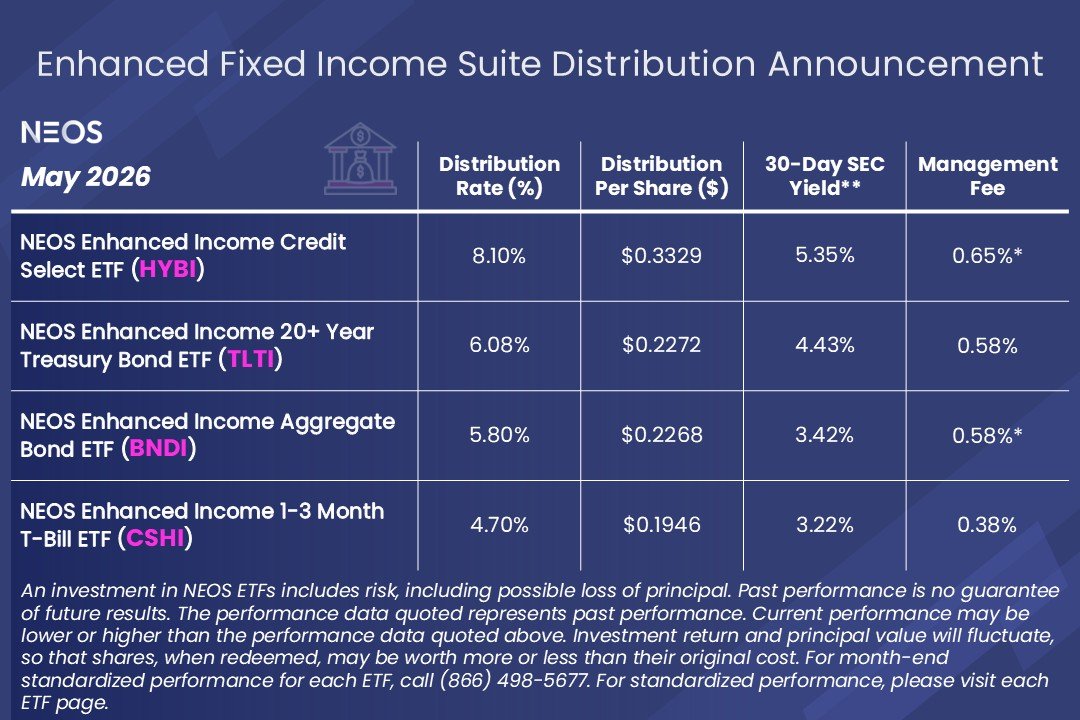
May 2026 Monthly Distribution Information for the NEOS Enhanced Fixed Income ETF Suite Important Disclosures: This material must be preceded or accompanied by a prospectus. To view the prospectus for each ETF, visit: www2.neosfunds.com/Enhanced-Fixed… ETF Fund Pages with Standardized Performance: neosfunds.com/BNDI neosfunds.com/HYBI neosfunds.com/CSHI neosfunds.com/TLTI Distributions made by the Funds have been classified as a return of capital and may be comprised of option premiums, dividends, capital gains, and interest payments. Please see the 19a-1 notices for an estimated breakdown of monthly distributions on each Fund's page. Distributions are not guaranteed. *The Advisor has contractually agreed to keep the net expenses of BNDI from exceeding 0.58% and HYBI from exceeding 0.68% of each Fund's average daily net assets through September 30, 2026, subject to approval of the agreement by the Board. Without the fee waiver, BNDI’s expenses would be 0.61% and HYBI’s expenses would be 0.72%. **30-day SEC Yield is calculation based on a formula mandated by the Securities and Exchange Commission (SEC) that calculates a fund's hypothetical annualized income, as a percentage of its assets. A security's income, for the purposes of this calculation, is based on the current market yield to maturity (in the case of bonds) or projected dividend yield (for stocks) of the fund's holdings over a trailing 30-day period. This hypothetical income will differ (at times, significantly) from the fund's actual experience; as a result, income distributions from the fund may be higher or lower than implied by the SEC yield. It is important to note that 30-Day SEC Yield does not include income received from option selling. The data reflects the most recent month-end (04/30/20-26). The Unsubsidized 30-day SEC Yield represents what a fund’s 30-day SEC yield would be had no fee waiver been in place over the reporting period. HYBI = 5.34% and BNDI = 3.39%. Distribution Rate: The annualized rate an investor would receive if the Fund’s most recent distribution remained constant. It reflects a single distribution, not the Fund’s total return, and is calculated by annualizing the most recent distribution (multiplying by 12) and dividing by the Fund’s most recent ex-date NAV.


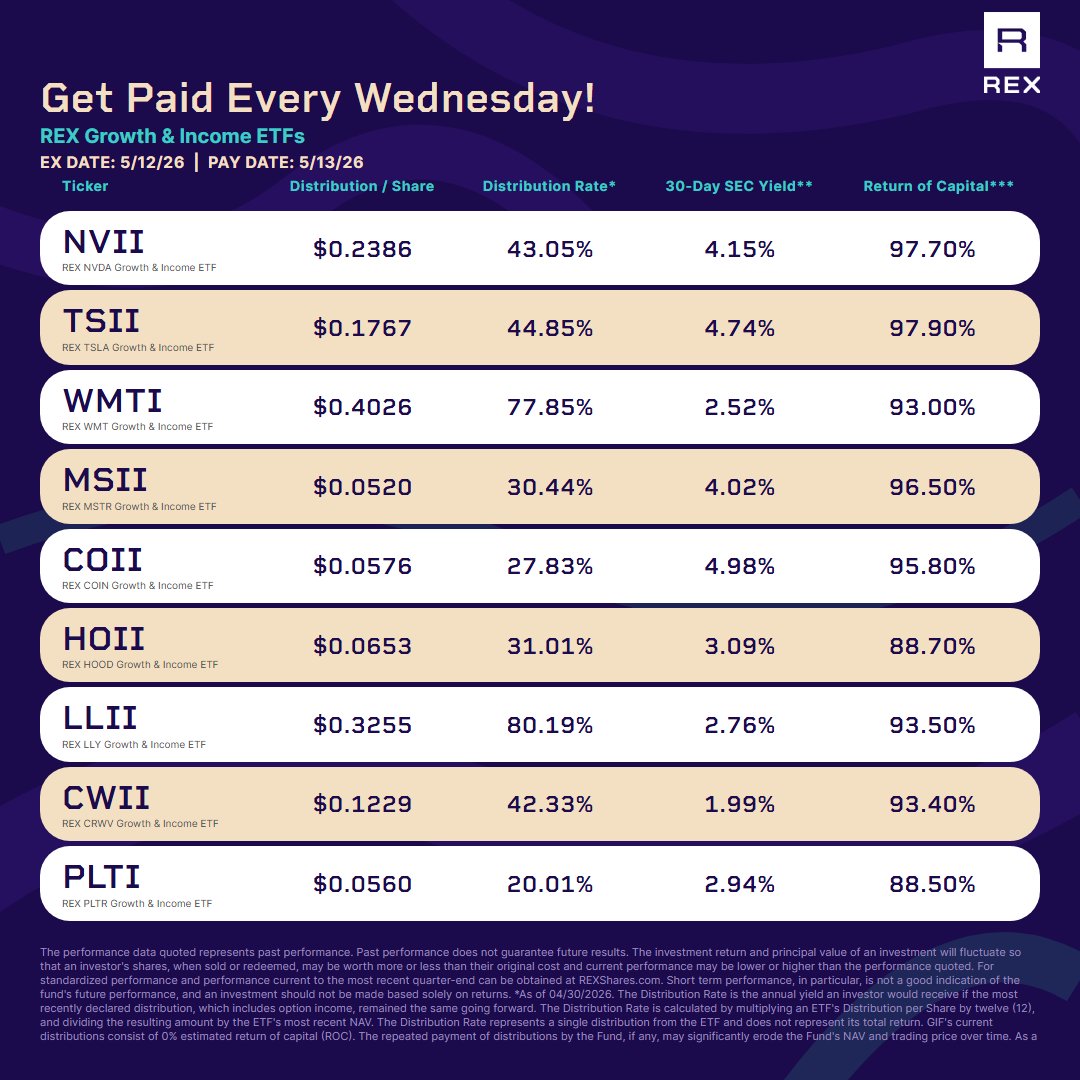
Another Wednesday. Another payout. Our Growth & Income Suite offers access to ETFs with the potential for income on a weekly distribution schedule. Annualized Distribution Rates: $NVII – 43.05% 30-Day SEC Yield: 4.15% Return of Capital (ROC): 97.70% $TSII – 44.85% 30-Day SEC Yield: 4.74% Return of Capital (ROC): 97.90% $WMTI – 77.85% 30-Day SEC Yield: 2.52% Return of Capital (ROC): 93.00% $MSII – 30.44% 30-Day SEC Yield: 4.02% Return of Capital (ROC): 96.50% $COII – 27.83% 30-Day SEC Yield: 4.98% Return of Capital (ROC): 95.80% $HOII – 31.01% 30-Day SEC Yield: 3.09% Return of Capital (ROC): 88.70% $LLII – 80.19% 30-Day SEC Yield: 2.76% Return of Capital (ROC): 93.50% $CWII – 42.33% 30-Day SEC Yield: 1.99% Return of Capital (ROC): 93.40% $PLTI – 20.01% 30-Day SEC Yield: 2.94% Return of Capital (ROC): 88.50% View each fund’s prospectus here: NVII, TSII, MSII, & COII Prospectus: rexshares.com/wp-content/upl… HOII, LLII, CWII, PLTI, & WMTI Prospectus: rexshares.com/wp-content/upl… NVII Fund Info and Standardized Performance: rexshares.com/nvii/ TSII Fund Info and Standardized Performance: rexshares.com/tsii/ MSII Fund Info and Standardized Performance: rexshares.com/msii/ COII Fund Info and Standardized Performance: rexshares.com/coii/ HOII Fund Info and Standardized Performance: rexshares.com/hoii/ LLII Fund Info and Standardized Performance: rexshares.com/llii/ CWII Fund Info and Standardized Performance: rexshares.com/cwii/ PLTI Fund Info and Standardized Performance: rexshares.com/plti/ WMTI Fund Info and Standardized Performance: rexshares.com/wmti/ *As of 5/11/26. The Distribution Rate is the annual yield an investor would receive if the most recently declared distribution, which includes option income, remained the same going forward. The Distribution Rate is calculated by multiplying an ETF’s Distribution per Share by fifty-two (52), and dividing the resulting amount by the ETF’s most recent NAV. The Distribution Rate represents a single distribution from the ETF and does not represent its total return. **As of 4/30/26. The 30-Day SEC Yield represents net investment income, which excludes option income, earned by such ETF over the 30-Day period, expressed as an annual percentage rate based on such ETF’s share price at the end of the 30-Day period. NVII, TSII, MSII, COII, HOII, LLII, CWII, PLTI, & WMTI's current distributions consist of 100% estimated return of capital (ROC). For full details on the composition of distributions, please refer to the latest 19a-1 notices. The REX NVDA Growth & Income ETF, the REX TSLA Growth & Income ETF, the REX MSTR Growth & Income ETF, the REX COIN Growth & Income ETF, the REX HOOD Growth & Income ETF, the REX LLY Growth & Income ETF, the REX CRWV Growth & Income ETF, the REX PLTR Growth & Income ETF, and the REX WMT Growth & Income ETF have a gross expense ratio of 0.99%. There is no guarantee that the Funds will be successful in their attempt to provide leveraged exposure to the underlying stocks or pay weekly distributions. The Funds are not suitable for all investors. These distribution rates caused by unusually favorable market conditions may not be sustainable. Such conditions may not continue to exist and there should be no expectation that this performance may be repeated in the future. The performance data quoted represents past performance. Past performance does not guarantee future results. The investment return their original cost and current performance may be lower or higher than the performance quoted. Performance current to the most recent month-end can be obtained by calling 1-844-802-4004. Short term performance, in particular, is not a good indication of the fund’s future performance, and an investment should not be made based solely on returns.
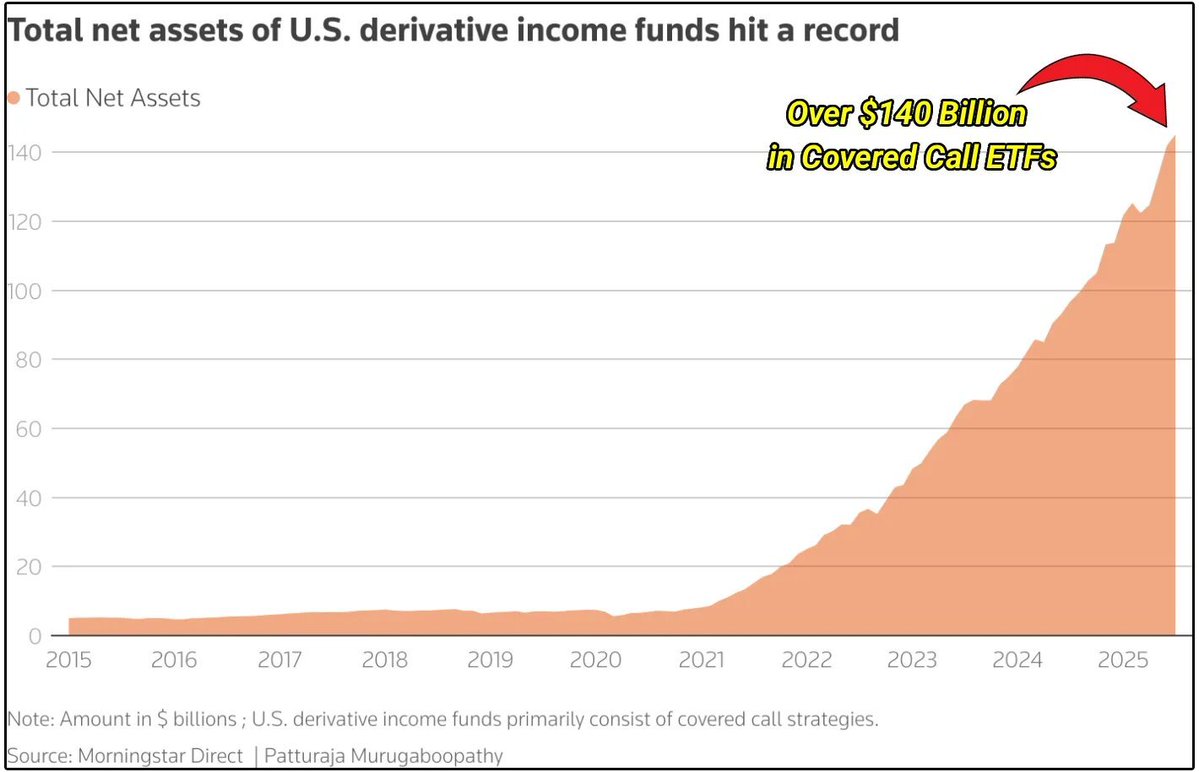
That AUM explosion in covered call ETFs shows no signs of slowing down! 🏎️


5 dividend ETFs other than $SCHD that you NEED to add to your watchlist👇 1. $DGRO iShares Core Dividend Growth ETF - Tracks the Morningstar US Dividend Growth Index. Screens for 5 consecutive years of dividend growth and a payout ratio under 75%. Yield: 2.1% 2. $VYM Vanguard High Dividend Yield Index ETF - Tracks the FTSE High Dividend Yield Index. No quality screen, no REITs, just market cap weighting across 600+ names. The most diversified high yield dividend ETF, and the cheapest at 0.04%. Yield: 2.3% 3. $FDVV Fidelity High Dividend ETF - Tracks the Fidelity High Dividend Index. Ranks stocks within each sector by yield, payout ratio, and dividend growth. One of the only dividend ETFs that holds NVIDIA, Apple, and Microsoft. Tech is ~25% of the fund. Yield: 2.8% 4. $FDL First Trust Morningstar Dividend Leaders - Tracks the Morningstar Dividend Leaders Index. Selects the highest yielding U.S. stocks with 5+ years of dividend growth. Heavily concentrated, top 10 holdings = 56% of assets, energy stocks ~26% of the portfolio. Yield: 3.9% 5. $GCOW Pacer Global Cash Cows Dividend ETF - Tracks the Pacer Global Cash Cows Dividend Index. Selects 100 large cap global stocks with the highest yields backed by strong free cash flow. Financials excluded, ~74% foreign holdings. Yield: 3.5%