Sabitlenmiş Tweet

Precise Market Analysis.
63 posts


AFTER 150 CHARTS, ONE THING IS CLEAR. I went through more than 150 charts today. One thing became very clear: Most of them currently fall into 2 categories. 1. Corrective Wave ABC wave These stocks have likely started a relief rally, but could still be setting up for a larger Wave C lower. How to identify? Look at the left side of the chart. If you already see two major peaks, with the second one higher than the first, be careful. The current rally could simply be building the right shoulder of a potential Head & Shoulders pattern before another decline. This is corrective wave ABC. 2. Wave 5 Continuation These are the charts that still look like they’re building for another impulsive move higher. Over the next few days, I’ll share examples of both. The goal isn’t just to show charts, it’s to help you learn how to tell the difference.
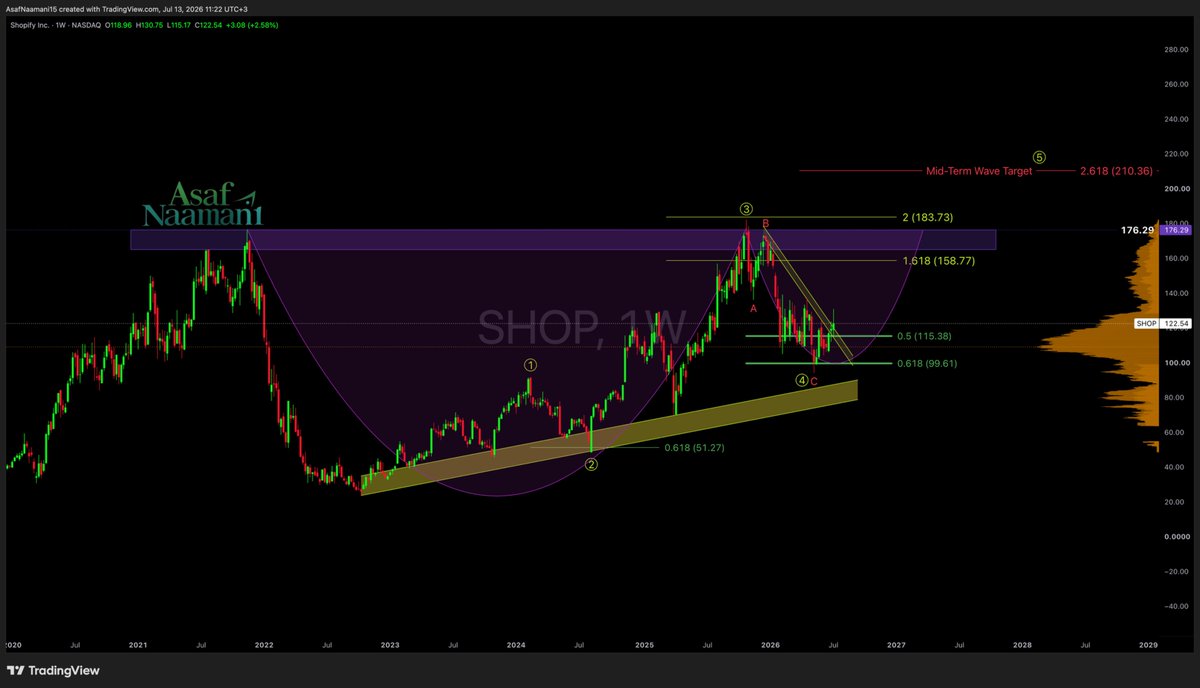
Downtrends end when sellers lose control. $SHOP | Weekly Chart After months of trading below the downtrend line, price is now attempting to break above it. This is the first meaningful sign that the correction may be ending and that buyers are starting to regain control.
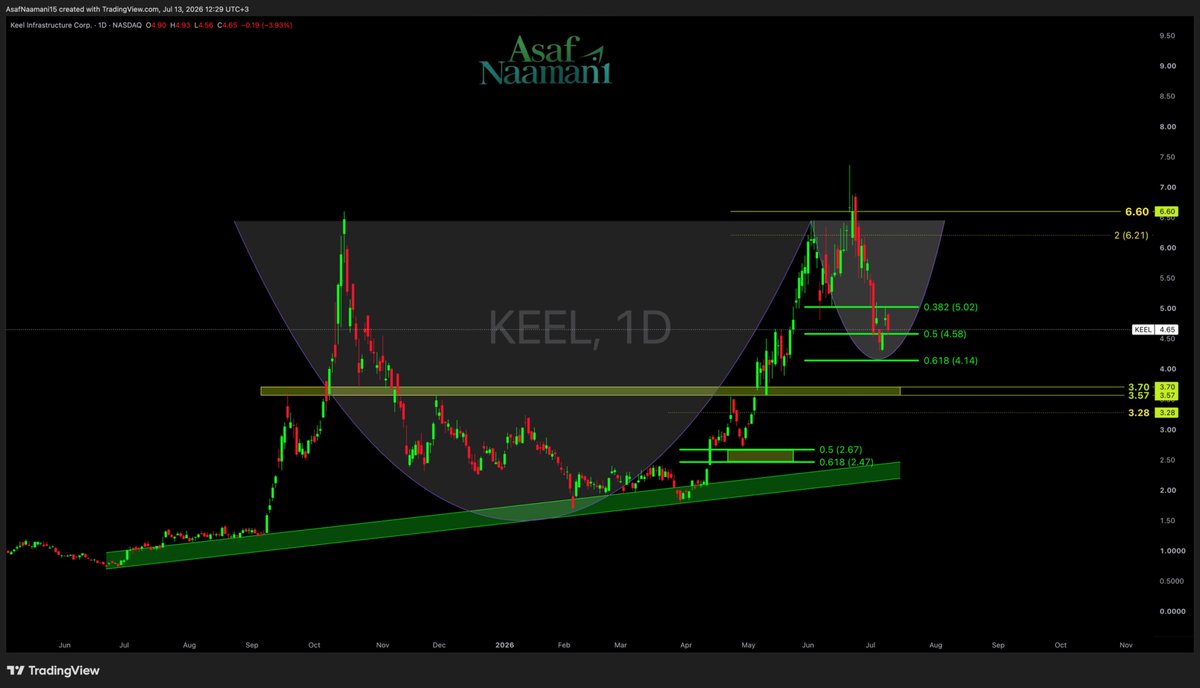
$KEEL | Update Price failed to break above the $6.60 resistance, and the pullback has started. I’m adding the next support level to watch. The blue line marks the daily MA50, which is another important area for buyers to defend.