Sabitlenmiş Tweet

CAUTION: BITCOIN Reaching Key Decision Zone ⨀
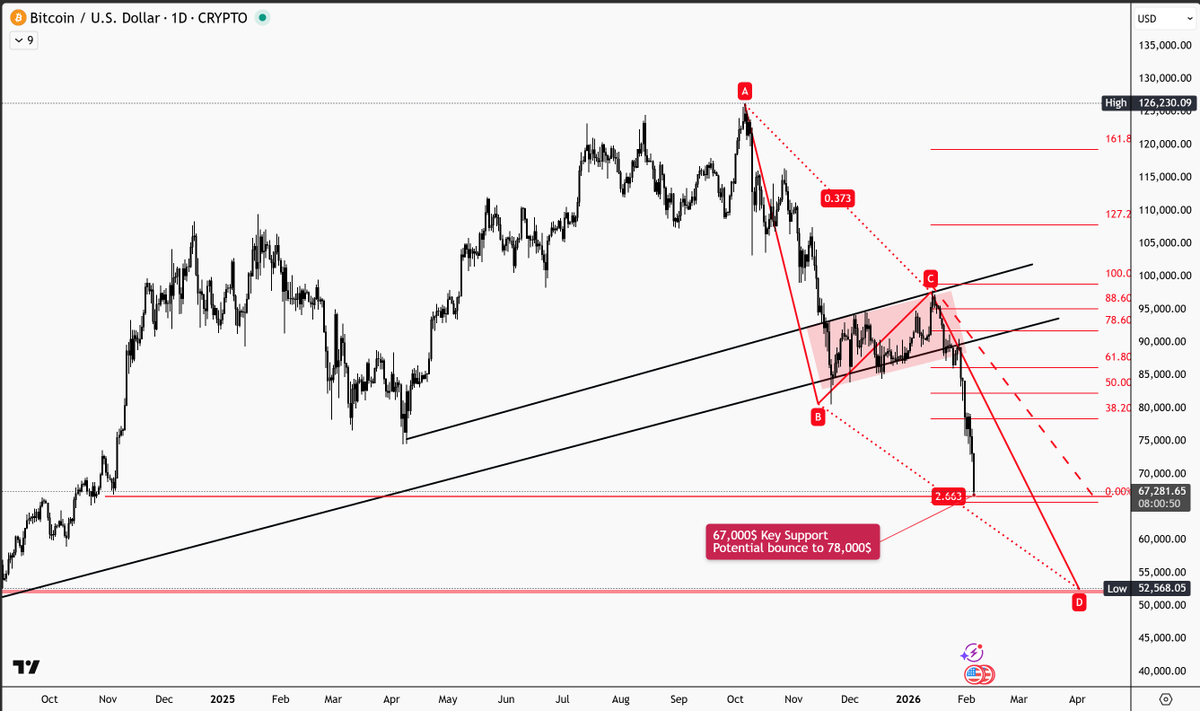
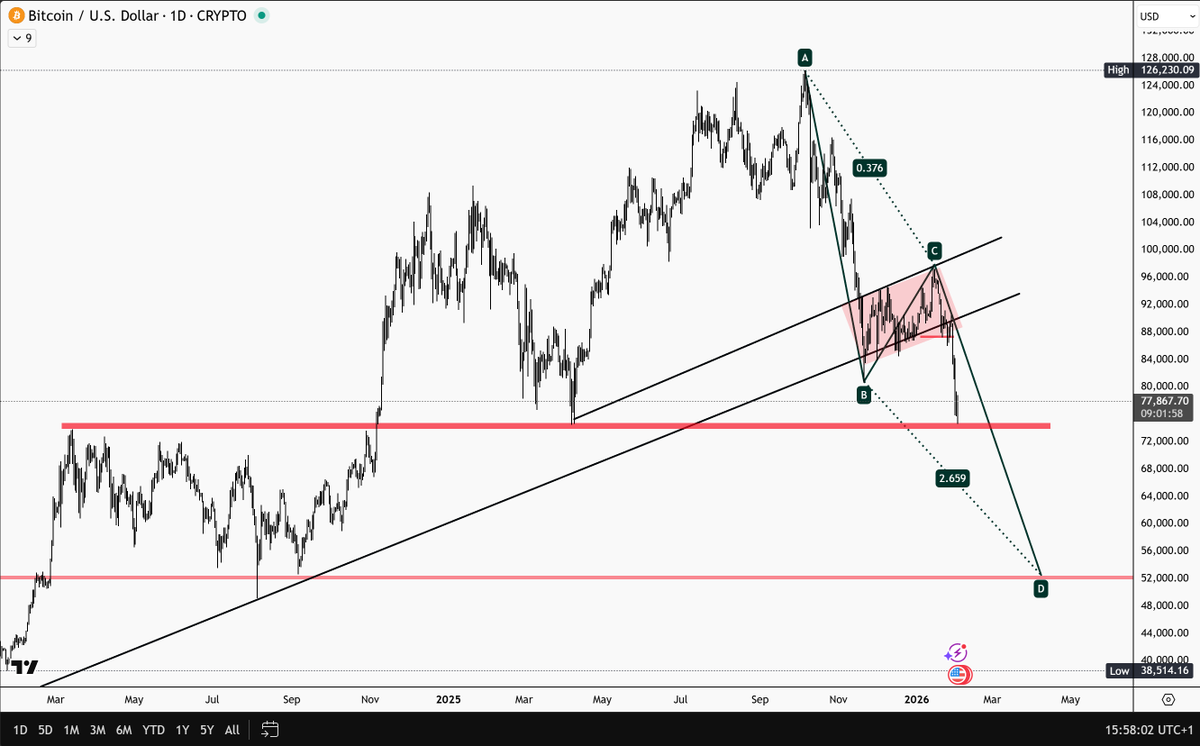
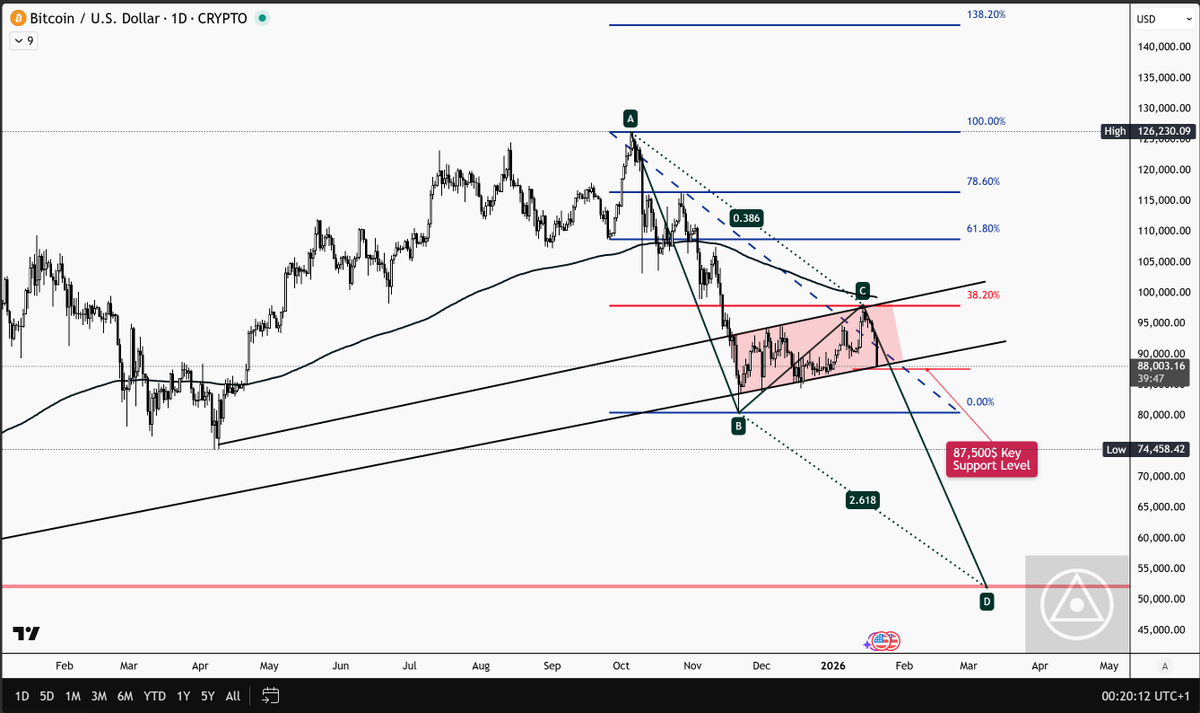
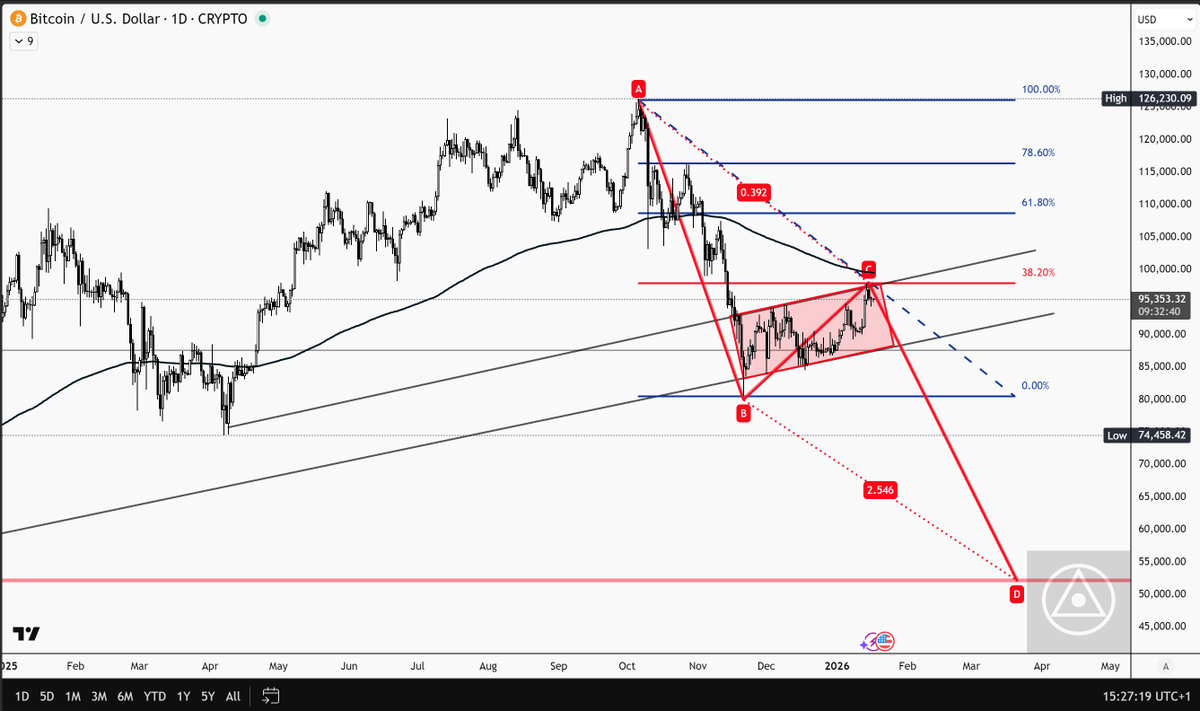
Bitcoin topped in October 2025.
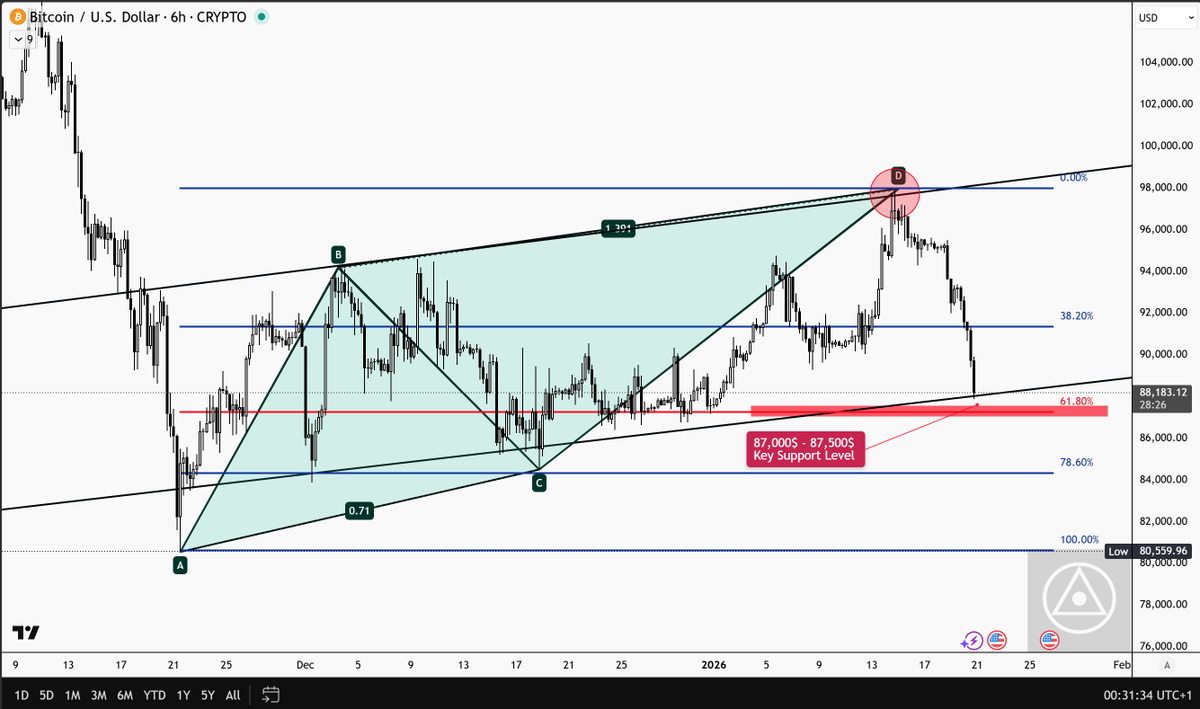
For the last two months it consolidated in a clear bearish flag.
Price is now below the 200 EMA (sitting right at the psychological 100K level).
This week it hit the 0.382 retracement from the all-time high — $97,800 — to the exact tick, then rejected hard.
Confluence is heavy: top of bearish flag + 0.382 Fib + 200 EMA + 100K psych barrier. If we hold below 100K, the next leg down looks likely — completing an ABCD pattern toward ~$52,000.
Fundamentals align: macro tightening (Fed still hawkish into 2026), profit-taking after the 2025 run, institutional rotation out of crypto, and regulatory/geopolitical uncertainty weighing on risk assets.
Your view on Bitcoin here?
Join the Circle ⨀ #Bitcoin #BTC #Crypto
English