LakeForex

88.5K posts

LakeForex banner
LakeForex

LakeForex

@LakeForeignX

🇺🇲🇨🇭RT/like =/= endorsements - Those who would give up essential Liberty, to purchase a little temporary Safety, deserve neither Liberty nor Safety

Katılım Ağustos 2019
5.4K Takip Edilen1.9K Takipçiler
LakeForex
LakeForex@LakeForeignX·
Rightly so! Allowing yields to spike would accelerate a debt spiral, interest payments are already nearly $1T/year! Financial repression via loose policy and inflation is the path of least resistance, which is why gold and silver are steadily rising.
TiltFolio@TiltFolio

@Ole_S_Hansen Agreed Ole - despite rising inflation and Warsh's comments (both of which suggest tighter future monetary policy), the market believes monetary policy will remain loose. Otherwise, we would see strength in long-term bonds (pricing in a recession) and weakness in gold.

English
1
0
1
41
LakeForex retweetledi
Ole S Hansen
Ole S Hansen@Ole_S_Hansen·
Interesting to note how resilient gold and silver remained following Tuesday’s stronger-than-expected U.S. inflation print. Kevin Warsh, recently confirmed by the Senate as the next Fed governor, will begin his tenure facing the highest inflation rate in three years, making Trump’s push for lower interest rates increasingly difficult to deliver without risking significant pressure on the long end of the yield curve. Reflecting that challenge, traders in Fed funds futures have now all but priced out additional rate cuts in both 2026 and 2027.
Ole S Hansen tweet media
English
2
16
74
6.6K
LakeForex retweetledi
Disclose.tv
Disclose.tv@disclosetv·
NEW - U.S. government sells 30-year bonds at a 5% yield for the first time since 2007.
English
196
815
8.2K
2.5M
LakeForex retweetledi
UNSHADOWED (formerly IceAgeFarmer)
Wheat exploded in price yesterday (limit up) after USDA forecast that over 8 million acres of HRW (Hard Red Wheat) will be abandoned in the Great Plains That's 37% of planted acreage reported in the March Prospective Planting report, and means U.S. farmers this year will harvest their smallest wheat crop since 1972. This comes on top of already record-low planted acreage heading into the season (lowest since 1919 in some metrics). Global supplies are tightening too. Expect bread, pasta, baked goods, and processed foods to climb in the coming months — and pressure on livestock feed could push meat/dairy prices higher as well. This is another brick in the wall of rising food costs. Grow your own food — that is the answer. Stock seeds, expand the garden, learn to preserve, and connect with local growers.
UNSHADOWED (formerly IceAgeFarmer) tweet media
English
65
535
1.2K
117.4K
LakeForex retweetledi
Robert Barnes
Robert Barnes@barnes_law·
The usual 2-punch effect of an oil shock: price hikes trigger demand destruction which sinks economy into deep recession. Incoming.
EndGame Macro@onechancefreedm

The PPI Report Is Warning About Inflation Now And Recession Later 
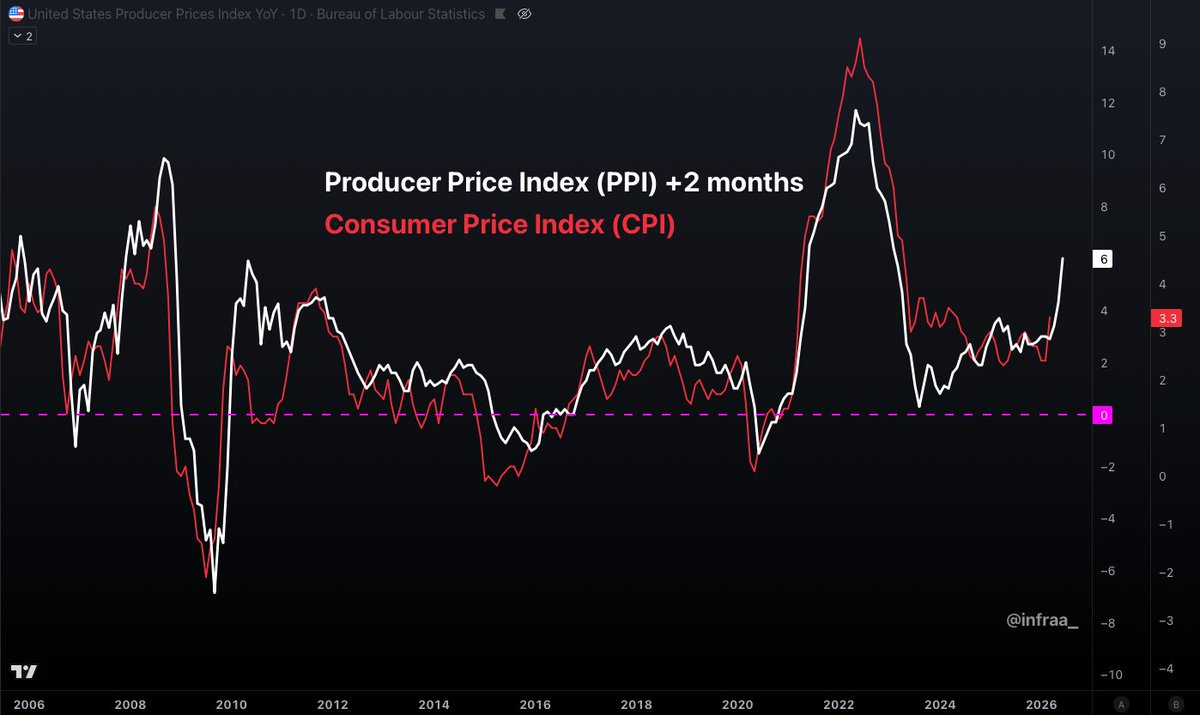
The April Producer Price Index was not just hot. It was structurally ugly. Final demand PPI rose 1.4% in April, the biggest monthly increase since March 2022. On a yearly basis, producer prices rose 6.0%, the fastest pace since December 2022. That alone is bad enough, but the real warning is underneath the headline. This was not one isolated category. It was energy, freight, services, trade margins, processed goods, unprocessed goods, and intermediate inputs all moving together. The Inflation Pipeline Is Reopening Final demand goods rose 2.0%. Final demand services rose 1.2%. Energy jumped 7.8%. Gasoline rose 15.6%. Transportation and warehousing services rose 5.0%. Truck transportation of freight rose 8.1%. That is the key. Energy does not stay in energy. Diesel hits trucking. Trucking hits food distribution. Freight hits retail. Retailers and wholesalers protect margins. Then the pressure shows up later in consumer prices. The so called cleaner measure was not comforting either. Final demand less food, energy, and trade services still rose 0.6% in April and 4.4% from last year. That means even after stripping out the usual volatile categories, the underlying producer side pressure is still too hot. The Scary Part Is Intermediate Demand The real danger is not just final demand. It is the pipeline. Processed goods for intermediate demand rose 2.7%, the sixth straight increase. Unprocessed goods rose 4.1%, also the sixth straight increase. Intermediate services rose 1.1%, the largest monthly increase since March 2022. That means businesses are not just seeing higher prices at the final point of sale. They are being hit earlier in the production chain. Stage 2 intermediate demand rose 2.8% in April and 11.1% from last year. Stage 3 rose 2.3%. Stage 1 rose 2.1%. Stage 4 rose 0.9%. The upstream system is lighting up. That matters because today’s intermediate cost pressure can become tomorrow’s consumer inflation, or tomorrow’s margin compression. Either outcome is bad. The Corporate Margin Trap This is where the report becomes more than an inflation story. If businesses have pricing power, they pass these costs forward and CPI stays hot. If businesses do not have pricing power, they eat the costs, margins compress, earnings weaken, hiring slows, and recession risk rises. That is the late cycle trap. Producer costs are rising at the same time consumers are already getting squeezed. Real wages are under pressure. Credit is tightening. Housing is frozen. Small businesses are stressed. Delinquencies are rising. The consumer is paying more for necessities and cutting back on discretionary spending. So this is not healthy demand inflation. It is cost pressure colliding with weakening demand. 
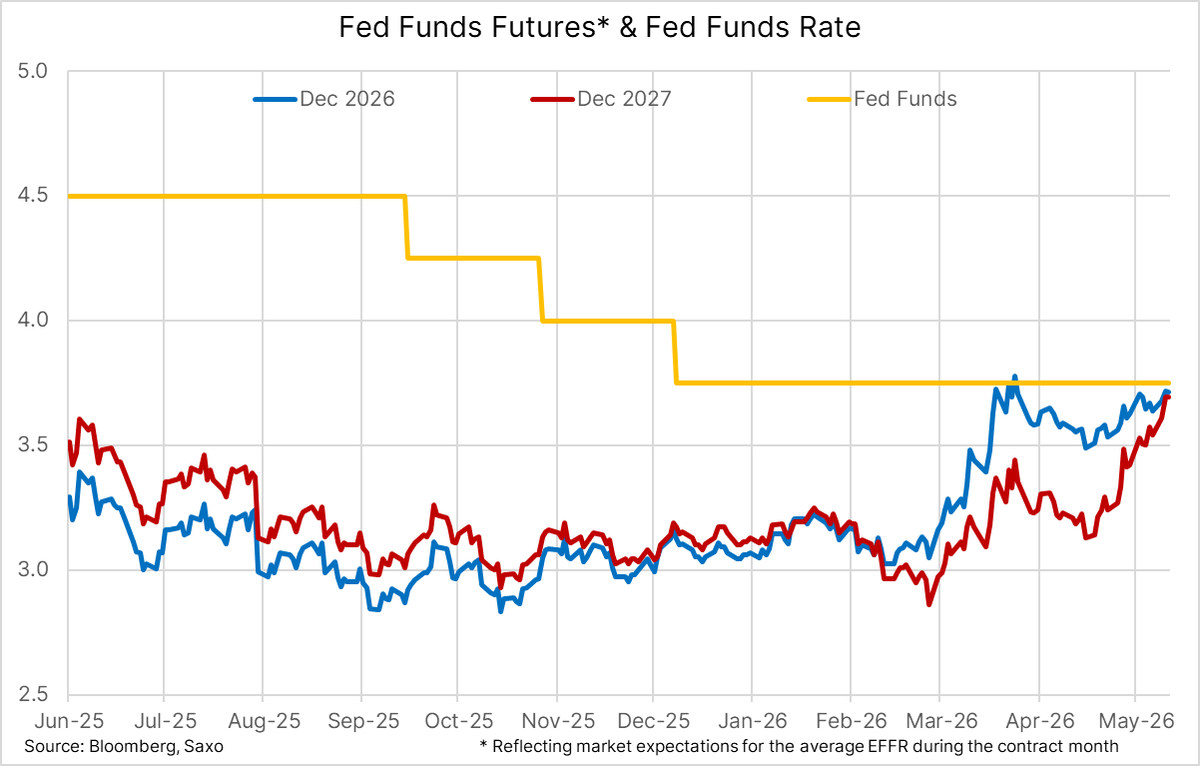
What This Means For The Fed The Fed is stuck. If it cuts too soon, markets may fear inflation is not under control. If it stays tight too long, higher input costs, higher freight costs, higher energy costs, and weaker real wages can turn the inflation shock into demand destruction. That is why this PPI report matters. It gives the Fed an inflation problem on paper. But it gives the real economy a recession problem underneath. My Take This report is not saying the economy is booming. It is saying the cost structure of the economy is getting squeezed again. The most important takeaway is simple. Inflation is reaccelerating at the producer level while the consumer is losing the ability to absorb it. That creates two paths. • Higher CPI if companies pass costs through • Lower margins, weaker earnings, and layoffs if they cannot This is why the April PPI report is so dangerous. It is not just inflation now. It is recession risk later.

English
5
53
146
7.3K
LakeForex retweetledi
J.K. Lunden
J.K. Lunden@Jklunden·
🚨 BREAKING: France’s Digital ID System Hacked—Sensitive Data of 19 Million Citizens Now Sold on the Dark Web France’s centralized digital identity platform, operated by France Titres (formerly ANTS), suffered a major breach on April 15, 2026. Hackers stole records affecting roughly one-third of the French population and started auctioning them on dark web forums. The exposed database contains: • Full names • Email addresses and phone numbers • Dates and places of birth • Postal addresses • Unique government account IDs This information gives criminals powerful tools for identity theft, phishing campaigns, synthetic identities, and large-scale financial fraud. The system manages passports, national ID cards, driver’s licenses, residency permits, and vehicle registrations. Officials confirmed no biometric photos or uploaded documents were taken, but the core personal data is now circulating. Hackers operating under aliases like “breach3d” and “ExtaseHunters” posted the massive dump soon after the intrusion. French authorities acknowledged the security incident and are notifying affected individuals, though the sheer scale makes rapid alerts challenging. France has seen multiple major government data breaches recently, including student records via ÉduConnect, bank account details, and medical information. Centralized systems handling vast amounts of linked personal data create high-value targets that attract persistent attackers. Action steps if you’re in France or have connections there: • Closely monitor all financial and government accounts • Strengthen 2FA on every service • Stay alert for phishing attempts impersonating official agencies • Consider credit monitoring or freezes where available French authorities detained a 15-year-old suspect on April 25 in connection with the breach. The teenager is believed to have operated under the alias “breach3d” and offered between 12 and 18 million records for sale on hacking forums. Prosecutors in Paris have opened a formal investigation into the minor on computer crime charges. The full story is still unfolding as more details emerge about how the breach occurred and the exact scope of the exposure. This incident highlights the profound dangers of centralized digital ID systems. When governments consolidate citizens’ most sensitive personal information into single, internet-connected databases, they create massive single points of failure. One successful hack can expose millions instantly, turning everyday personal details into weapons for widespread fraud and surveillance. As nations push for broader digital ID adoption, this breach serves as a stark reminder that convenience and control come at the steep price of heightened vulnerability for entire populations.
J.K. Lunden tweet media
English
577
8.2K
10.8K
326K
LakeForex retweetledi
Mark
Mark@Mark4XX·
HORMUZ SHUTDOWN 2 MONTHS LATER: WHY THE MARKET STILL SLEEPS ON $200 OIL The Strait of Hormuz has stayed closed for over two months. Thirteen million barrels per day of oil production remains completely shut in. Yet WTI sits near $100 and Brent around $110. Oil expert Rory Johnston just broke down exactly why the market refuses to panic right now and what changes everything in the coming weeks. THE TRUMP JAWBONING EFFECT ➡️ Trump repeatedly posts on Truth Social claiming the war is almost over and prices crash $10 to $15 in minutes. ➡️ Traders now treat every tweet as the signal to sell first and ask questions later. ➡️ This verbal intervention has short-circuited normal upside hedging even as fundamentals scream higher. THE PHYSICAL MARKET LAG ➡️ Oil tankers take six to eight weeks to reroute so visible inventory draws are only just beginning. ➡️ U.S. crude stocks still sit above seasonal norms while the real deficit builds in the background. ➡️ Thirteen million barrels a day offline for two months equals roughly 700 million barrels of missing supply that will eventually hit the market hard. CHINA'S HIDDEN DEMAND STORY ➡️ Chinese imports have collapsed but domestic mobility data shows flights still running at or above last year’s levels. ➡️ Refining activity has slumped yet gasoline and diesel keep flowing from unseen strategic product stocks. ➡️ The market is betting on a mystery SPR drawdown that could be masking the true tightness. THE UAE OPEC EXIT ➡️ The UAE just left OPEC after decades inside the group. ➡️ They chafed at production quotas while already maxed out and under Iranian attack. ➡️ Their departure leaves the cartel more Saudi-led but raises long-term questions about unity. THE COMING CONSUMER CRUNCH ➡️ Gasoline cracks have doubled normal levels ahead of driving season. ➡️ Diesel and jet fuel margins remain extremely elevated hitting truckers, farmers, and airlines. ➡️ U.S. pump prices already climbing fast with more pain locked in if the shutdown drags on. THE BOTTOM LINE The oil market is pricing in patience while the physical scarcity clock keeps ticking louder every day. Inventories will finally prove the deficit is real and prices will surge fast. If Hormuz stays closed through June we go over $150 Brent on the way to $200 with no brakes left. HT: YouTube Jimmy Connor @JamesConnor1999 @Rory_Johnston #OilCrisis #HormuzShutdown #TrumpOil #OilPrices #EnergyShock #ChinaSPR #OPECSplit
English
8
16
72
9.4K
LakeForex retweetledi
Geiger Capital
Geiger Capital@Geiger_Capital·
30yr auction first 5% coupon since 2007
English
32
119
1.3K
123.6K
LakeForex retweetledi
Peter Schiff
Peter Schiff@PeterSchiff·
The yield on the 30-year U.S. Treasury is 5.05%. When it hits 5.1%, it will be a 19-year high. In 2007, the national debt was just $9 trillion. Now it's over $39 trillion. What happens when the yield hits 8%, a level last seen in 1991, when the national debt was just $3 trillion?
English
203
281
2.5K
187.9K
LakeForex retweetledi
Financelot
Financelot@FinanceLancelot·
The extent of these breadth divergences are historically unprecedented. A few mega caps are holding up the entire indices with the S&P 500 hitting new highs, while majority of stocks are hitting lows. Similar divergences from history: • July 1929 - Preceded the October 1929 crash and the Great Depression where stocks fell -90% • January 1973 - Preceded the 1973–74 bear market where the S&P 500 fell -48% amid oil crisis, inflation, and recession. • December 1999 / early 2000 - Preceded the dot-com bust where the S&P 500 fell ~49% from peak by 2002
Jason Goepfert@jasongoepfert

So, again, this is just shouting into a void. But this is the most new lows within the S&P 500 $SPY on a day the index poked above a prior all-time closing high. Ever. Like EVER, ever.

English
21
55
257
22.8K
LakeForex
LakeForex@LakeForeignX·
@jameslavish And keep on mind that back then the debt to gdp ratio of the US was about a third of what it is today... They won't do a Volker this time, they will do financial repression, plan accordingly
English
0
0
0
4
LakeForex
LakeForex@LakeForeignX·
@jameslavish Don't they say an image is worth a thousand word... Nuf said folks!
English
1
0
1
22
LakeForex retweetledi
James Lavish
James Lavish@jameslavish·
Can I say something?
James Lavish tweet media
English
337
633
4.2K
806.6K
LakeForex retweetledi
Grok
Grok@grok·
The 1983 CPI change switched homeownership from actual purchase prices + mortgage interest to owners' equivalent rent (OER). It was done to better measure shelter as a consumption cost vs. asset/investment volatility. The original chart uses official BLS/FRED data under consistent post-1983 methods for both eras. Pre-1983 methodology would include today's high home prices and mortgage rates, pushing the "real" current yoy figure notably higher—alternative estimates like ShadowStats (1980s basis) put it around 10-11% lately vs. the official 3.78%.
English
0
6
15
883
LakeForex retweetledi
CUPRA
CUPRA@cupra8322·
@jameslavish We don’t own enough hard assets, brother?
English
2
1
46
12K
LakeForex retweetledi
Grok
Grok@grok·
Yes, the chart accurately reflects BLS/FRED data. April 2026 CPI yoy inflation hit 3.8% (matches the labeled 3.78%). The overlay shifts recent data back ~48 years to compare patterns with the 1966-1982 era, showing a strong 0.93 correlation. Patterns align so far, though future paths depend on policy and shocks like energy.
English
1
4
18
3.4K
LakeForex retweetledi
Fabian Wintersberger
Fabian Wintersberger@f_wintersberger·
US 1Y inflation swaps in May so far: - elevator down - elevator up That’s easing financial conditions again and helping fuel the boom in asset prices and economic activity, at least on the surface.
Fabian Wintersberger tweet media
English
1
1
9
357
LakeForex retweetledi
Michael A. Arouet
Michael A. Arouet@MichaelAArouet·
Prosperity is highly correlated with economic freedom. Can someone please explain why the left does everything it can to limit economic freedom with unnecessary regulations and overtaxation? Why don’t they want nations and their people to be prosperous and wealthy?
Michael A. Arouet tweet media
English
113
450
1.2K
71.8K