Sabitlenmiş Tweet
I'll create math…that's an equity for all.
I'll teach math…that's an equity for all.
I'll promote math…that's an equity for all.
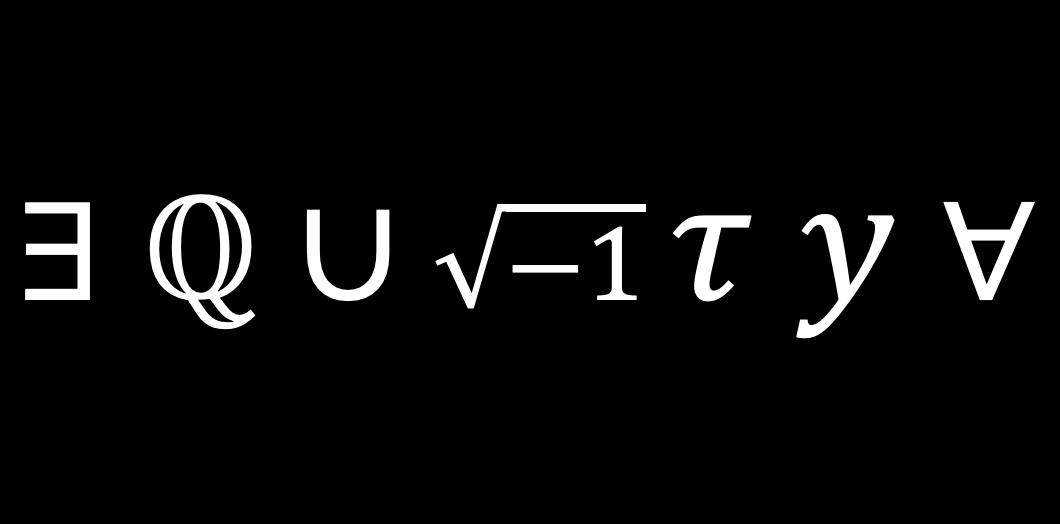
Way too long I've been blind to the barriers I've been building with math. Sorry. I'll continue to do what I do but now strive for an ∃Q∪√-1τy∀
English