Mike Paulenoff

2.8K posts

Mike Paulenoff

Mike Paulenoff

@MPTrader

35 Yrs on Wall Street, Macro & Behavioral Financial Market Strategist, Author, Columnist, Lawrenceville School, Georgetown Univ. SFS '79, Gtown Tennis '76-'79

NYC Katılım Mayıs 2009
1.4K Takip Edilen1.8K Takipçiler
Mike Paulenoff
Mike Paulenoff@MPTrader·
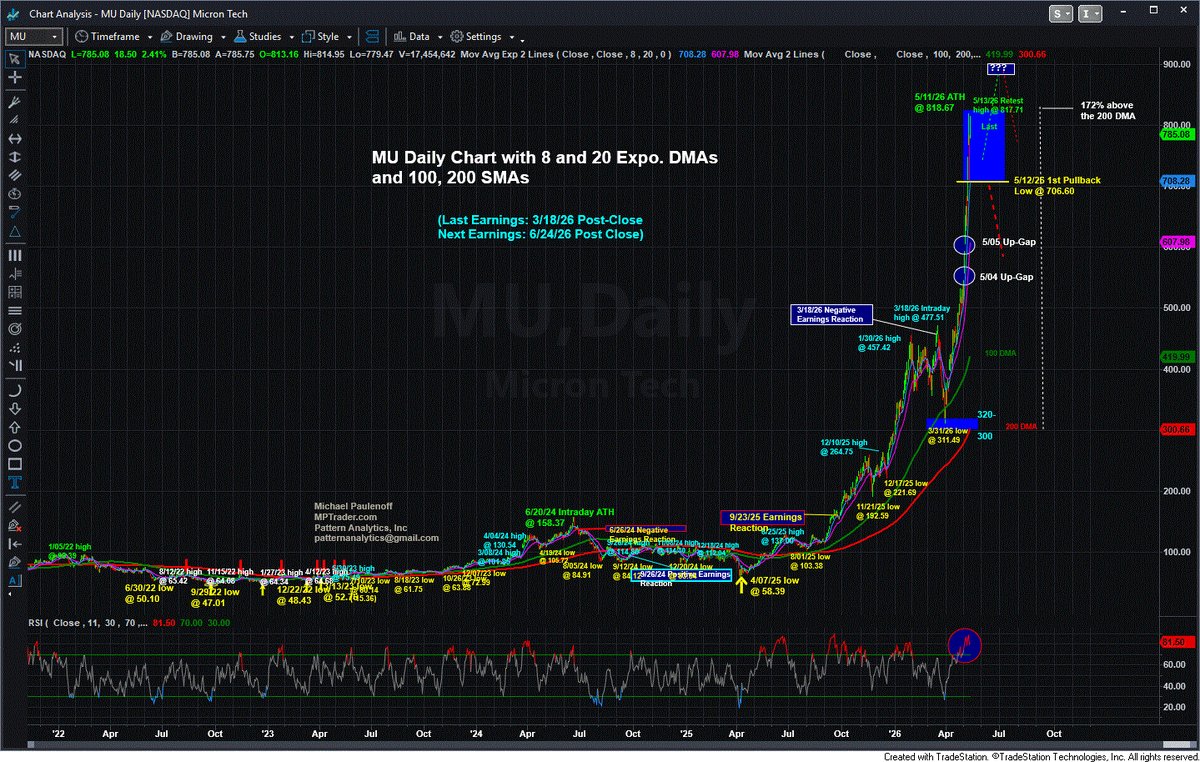
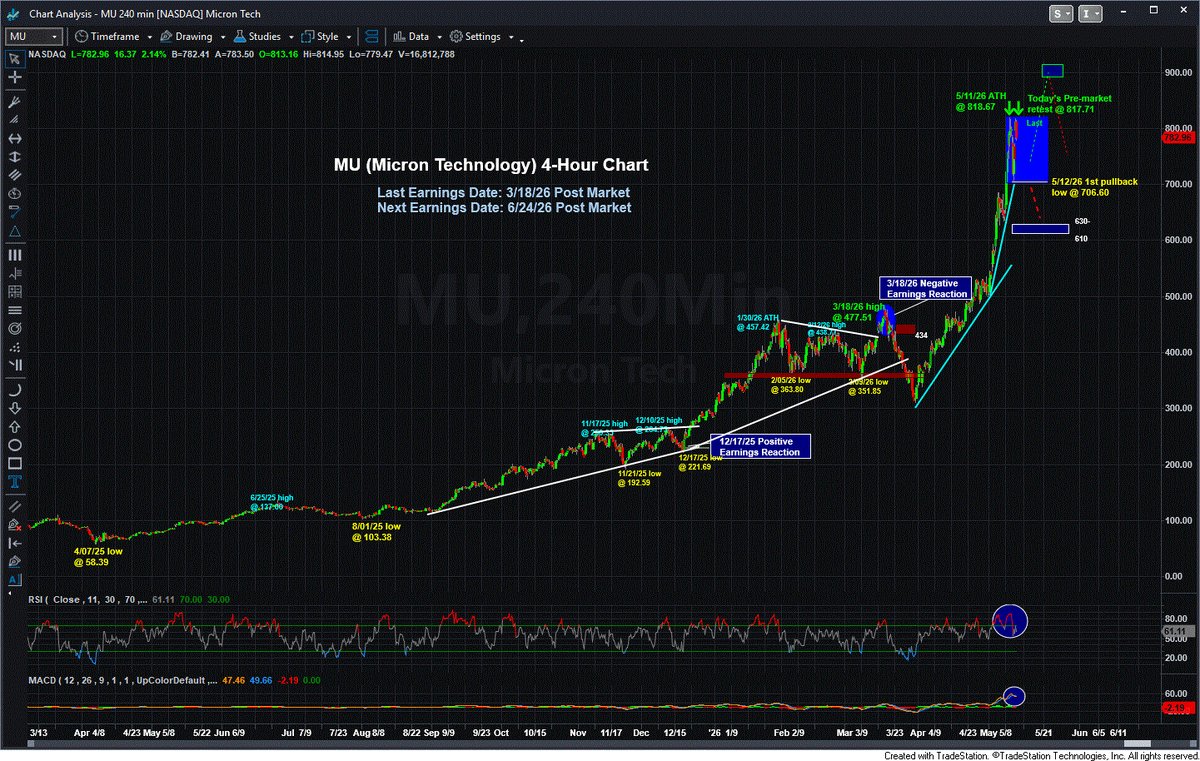
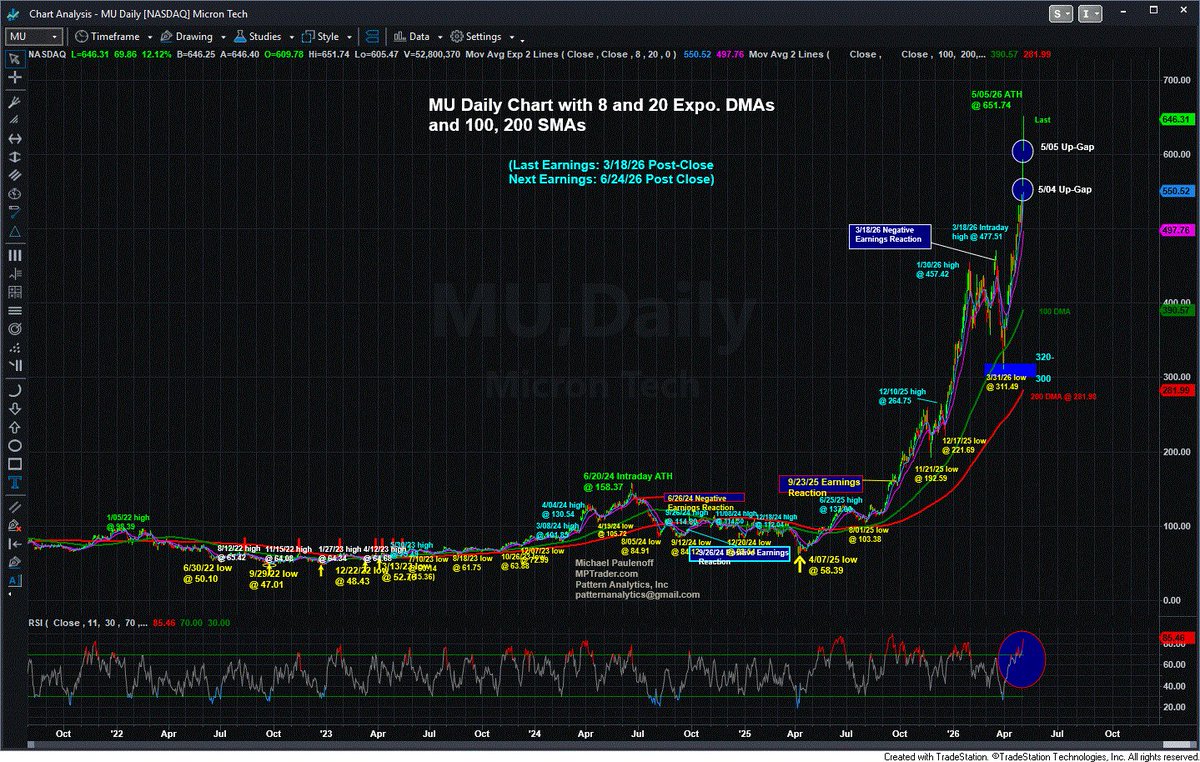
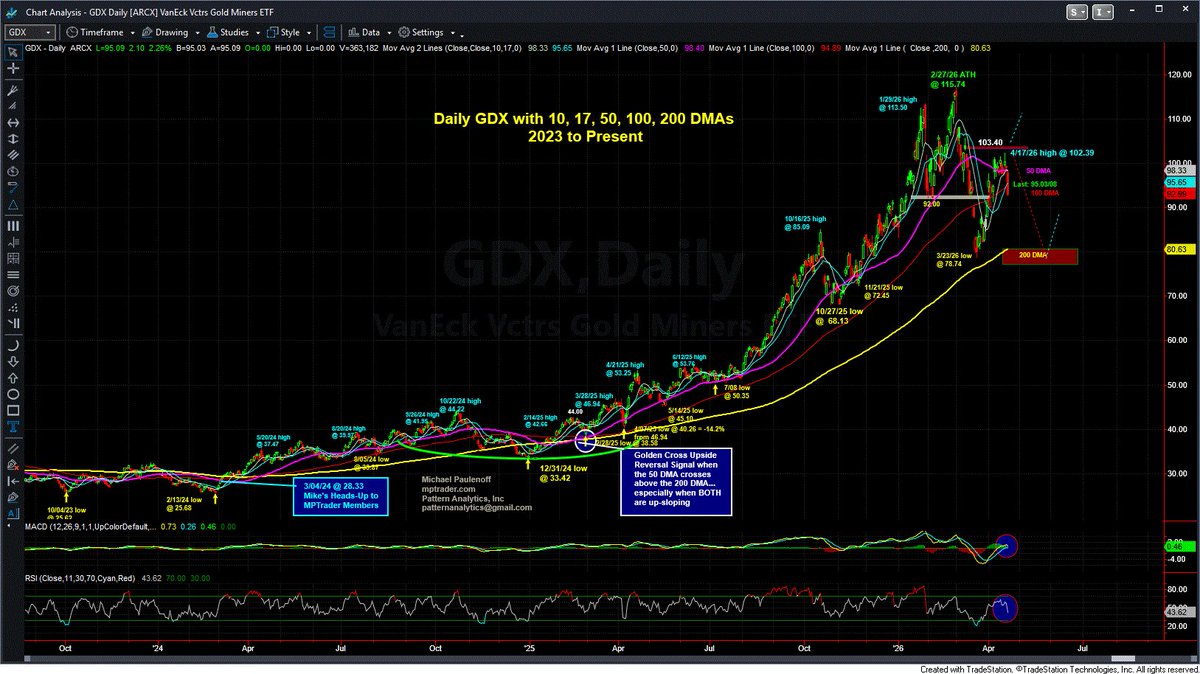
$MU rocketed to another new ATH at 1026.20 in today's pre-market trading, and higher after the open, BUT the new ATH represents the second consecutive UNCONFIRMED new high since the 5/11/26 CONFIRMED ATH. This sends another warning signal that MU is running out of gas (even if the price action doesn't appear that way at the moment). Consequential support resides from 965 down to 900, which should contain an initial pullback. Only a close below 900 compromises the otherwise bullish technical setup.
Mike Paulenoff tweet media
English
0
0
7
531
Mike Paulenoff
Mike Paulenoff@MPTrader·
Agreed, Stan, but give me the benefit of the doubt that MPTrader members who followed my technical work in SNOW had risk-management parameters and reentry levels. SNOW was and still is on my list of the best technical setups entering 2026, and despite its nosedive to 118 from 280.67, never broke its multi-year support 110-120. All the best, Mike
English
1
0
1
19
Stan Raksin
Stan Raksin@stanraksin·
@MPTrader Mike I love your work but 220 to 177 is draining 40% prior to the eps rip
English
1
0
0
18
Mike Paulenoff
Mike Paulenoff@MPTrader·
This is what we discussed with members yesterday morning about $SNOW ahead of Earnings: "The reaction to SNOW Earnings tonight has the potential to rocket the stock to and above the 200 DMA, now at 202.50, or to trigger a pullback toward 155-160 support, where my pattern work argues for the emergence of strong buying interest.  Bottom Line: In reaction to Earnings, SNOW either takes off to the upside or provides an opportunity to enter the stock lower-- as long as SNOW does NOT close beneath its 50 DMA, now at 153.08... Last is 177.30..." Fast-forward to this AM, we see that SNOW did, indeed, rocket in reaction to much better-than-expected Earnings, ripping higher from the 175-176 area to this AM's high at 244.05, likely en route to a confrontation with consequential resistance from 265 to 283. Forthcoming pullback weakness should find meaningful support from 225 down to 210... last is 239.02... SNOW is one of the MPTrader Baker's Dozen Best Technical Setups Entering 2026, first posted on 12/31/25 at 220.11.
Mike Paulenoff tweet media
English
1
0
1
185
Mike Paulenoff
Mike Paulenoff@MPTrader·
$SPY Update: As long as any SPY weakness is preserved above yest's pullback low at 748.50, the bulls will be in directional control -- albeit perhaps, in an increasingly exhausted condition. However, unless weakness inflicts some technical damage on a break of 748.50 that leaves SPY vulnerable to a press into the still UNFILLED up-gap from last Friday's final print at 743.73 to Tuesday's low at 748.80, the dominant near-term uptrend pattern from the May 19th low at 731.53 remains intact, and, as such, the bulls will be eying 758 to 760 next.
Mike Paulenoff tweet media
English
0
0
2
194
Mike Paulenoff
Mike Paulenoff@MPTrader·
I wish I could explain why $ONDS ripped from 8.65 to 12.12 in reaction to Earnings (5/14), and then relinquished nearly all of it, but I will take a pass on that, and instead, point out that the retracement of the post-Earnings advance held critical support just above the dominant up trendline from the July 2025 low at 1.78 (see my attached 4-Hour Chart), and now, with today's upside pop above 10, looks ready for strength that retests and takes out the plateau of multi-month highs lodged between 11.60 and 12.42. Doesn't the entire militarized world have to upgrade and replenish its drone stockpiles? All of the hotspots around the world are employing drone usage for both offensive and defensive military operations.
Mike Paulenoff tweet media
English
0
1
14
2.1K
Mike Paulenoff
Mike Paulenoff@MPTrader·
$RGTI, which we see on my 4-Hour Chart below, is reacting to news about the Trump Administration awarding $2 billion in grants to nine quantum-computing companies. Technically, I can make a compelling argument that all of the price action during the past 3-1/2 months has carved out a rounded bottom formation in the aftermath of a relentless bear phase that pummeled RGTI from its 58.46 ATH on 10/15/25 to a 12.53 low on 3/30/26-- a near-80% devaluation in the share price! That said, the multi-month base-accumulation period and pattern-- especially after this AM's pop in reaction to the Commerce Department news-- is putting upward pressure on key "upside breakout" resistance lodged between 20.90 and 22.11 that, if (when?) taken out, will trigger an intermediate-term upside reversal signal that projects to 35-38. Only a sharp downside reversal that retraces the upmove from the 5/19 pivot low at 15.46 to this AM's pre-market high at 20.29 will wreck the currently promising technical outlook. RGTI is one of the MPTrader Baker's Dozen Most Promising Technical Setups Entering 2026, first posted for members on 12/31/25 at 22.29.
Mike Paulenoff tweet media
English
2
1
7
1.6K
Mike Paulenoff
Mike Paulenoff@MPTrader·
Technically, $CAVA is in a very strong position as long as any forthcoming weakness is contained above or within support between 68 and 73. My attached 4-Hour Chart argues strongly that CAVA is carving out a 1-1/2 year accumulation period and pattern that has the potential to propel CAVA much higher in the weeks and months ahead, especially if and when CAVA takes out resistance from 94 to 101.
Mike Paulenoff tweet media
English
0
0
0
210
Mike Paulenoff
Mike Paulenoff@MPTrader·
Home Depot ($HD) made new multi-month lows this am after an unremarkable Earnings report. Technically, unless and until HD claws its way up and over 306.60 on a closing basis-- for starters-- the bears will remain in complete control of market direction, heading to a next immediate downside objective in the vicinity of 290. My optimal downside target window is 260 to 275 to end the bear phase off the Sep 2025 high at 426.75.
Mike Paulenoff tweet media
English
0
0
2
152
Mike Paulenoff
Mike Paulenoff@MPTrader·
We have introduced a new feature on MPTrader, where we provide periodic quick video spotlights on specific charts to watch. This weekend we highlighted the hourly charts of the Emini S&P 500 and cash SPX alongside the McClellan Oscillator, pointing out the highest-probability moves ahead. The video is publicly available: mptrader.com/videos/The-Wee…
English
0
0
2
121
Mike Paulenoff
Mike Paulenoff@MPTrader·
See our video chart analysis -- part of a new regular feature on MPTrader -- on $SLNH, which is approaching a key resistance plateau in front of earnings. mptrader.com/videos/SLNH-Ap…
English
0
0
4
402
Mike Paulenoff
Mike Paulenoff@MPTrader·
One of our MPTrader members writes the following this AM: "What do the charts say about $MU? Is there any retreat or exhaustion in the near future? Every dip is violently bought..." We can tell from my attached 4-Hour and Daily Charts that MU has morphed into a powerful, meteoric parabolic advance. Here is what my pattern work is telling me about the near-term price path: -- Yesterday's low at 706.60 off the ATH at 818.67 (5/11/26) represented a low-coordinate for a completed correction ahead of one more thrust to the 860-900 target window that will end the entire advance from 300... -- Only a bout of weakness that takes out 700 on a closing basis will indicate that the correction from 818.67 to 706.60 was the first downmove of a complex correction that remains in progress, and has a target support window closer to 610-630 prior to my expectation of another advance to 860-900 (probably into and/or in reaction to MU's 6/24/26 Earnings Report... -- From an intermediate-term perspective, however, the differential between the 200 DMA and where MU is trading 300.76 vs. 805 is historically (and hysterically) wide, and is BIG WARNING SIGN that MU needs a breather sooner or later (probably sooner), which means that MU either peaks and reverses into a scary decline that presses price closer to the 200 DMA, or MU trades in a range (700 to 800 for instance) for two weeks, allowing the 200 DMA to play catch-up. Right now, my preferred scenario argues for MU to make new ATH's and run closer to 860-900 before reversing sharply into a correction that could see 500 before its exhausted.
Mike Paulenoff tweet mediaMike Paulenoff tweet media
English
0
0
3
613
Mike Paulenoff
Mike Paulenoff@MPTrader·
As noted to members yesterday shortly before the market close: $TSLA continues to follow my post-Earnings scenario, heading for 420-430 next from its 4/27/26 Earnings spike low at 364.02.
Mike Paulenoff tweet media
English
0
1
6
299
Mike Paulenoff
Mike Paulenoff@MPTrader·
See on the chart below the $MU (Micron) parabolic up-move -- i.e., the extremely wide differential between the current price structure and the trailing 200 DMA, now at a 129% differential! Meanwhile, MU registered an upside exhaustion warning signal (13) DeMark on April 24th, with the price circling 500, or 28% below where MU is currently trading, which means, "upside exhaustion warnings" are just that: warnings. Unless and until MU rolls over into some weakness that inflicts technical damage (625 is my first support plateau), DeMark is just a condition, not a signal.
Mike Paulenoff tweet mediaMike Paulenoff tweet media
English
0
1
3
339
Mike Paulenoff
Mike Paulenoff@MPTrader·
$ARKG (ARK Genomic Revolution ETF) is one of our Baker's Dozen Most Promising Technical Setup Entering 2026 (posted to members on Jan 2nd at $29.17). Although ARKG hasn't moved much so far during 2026, it is positively positioned within a 4-year base-accumulation period and pattern that is exerting upward price pressure toward a challenge of near-term resistance at 31.50/80 and then from 32.00 to 34.80, that, if (when) hurdled, will unleash much higher intermediate-term projections. Only a bout of weakness that presses and closes beneath the 200 DMA, now at 28.43, will delay the anticipated upside breakout. I am particularly interested in ARKG because the companies in the ETF prioritize the use of AI for their drug research and analysis of their clinical studies.
Mike Paulenoff tweet media
English
0
1
4
258
Mike Paulenoff
Mike Paulenoff@MPTrader·
$META is the major casualty amid last eve's Mag7 Earnings reports. As we speak pre-market, META is down 9.3%, and at 607 has relinquished exactly 50% of its March-April advance. The March-April upleg from 520 to 691.52 exhibits bullish structure, and as such, wherever the META correction exhausts itself should resolve into another powerful advance that challenges and takes out 700. Although I won't be surprised if META bounces off 607, my near-term pattern work argues for additional weakness that presses the correction lower, closer to the 560-586 optimal target support window from where the pattern setup should pivot to the upside.
Mike Paulenoff tweet media
English
0
0
1
196
Mike Paulenoff
Mike Paulenoff@MPTrader·
$CAVA was trading at $60.90 on Jan 2nd when we included it was one of our MPTrader Baker's Dozen Best Technical Setups entering 2026. See our analysis then and now: mptrader.com/top-calls/NonA…
English
0
0
1
145
Mike Paulenoff
Mike Paulenoff@MPTrader·
Is Tesla’s Earnings Selloff a Buying Opportunity? $TSLA reported Earnings last Evening, and after an initial up-spike to 406.50 from yesterday's close at 387.51, the stock rolled over (see Seeking Alpha snippet below) into a nosedive that pressed the stock to a post-Earnings low at 373.55 (so far)... What now? You can tell from my Big Picture chart annotations that I remain very bullish about TSLA unless more acute weakness emerges that presses the stock below the January 2026 corrective pivot price of 337.25. Barring such a scenario, my interpretation of the price action for the past 17-months implores me to treat the entire period as a massive Cup and Handle formation that finished the "Handle" portion of the pattern at the January 2026 low, and as such, is in the early phase of a budding new upleg that projects TSLA to new ATHs... Nearer-term, the current post-TSLA weakness should (needs to) run its course on the downside between 350 and 365 (worst case pullback), from where I will be expecting a powerful upside reversal signal that initiates the next powerful upleg... Last is 376.60...
Mike Paulenoff tweet mediaMike Paulenoff tweet media
English
0
0
2
207
Mike Paulenoff
Mike Paulenoff@MPTrader·
My preferred scenario remains viable in $GDX. As long as any strength is contained beneath resistance at 102.39 (last week's March-April rally high) and 103.40 (my line-in-the-sand technical resistance level), my pattern and momentum work indicate that GDX is vulnerable to a bout of weakness that presses the price structure toward a retest of the March corrective low-zone from 85 down to 79, prior to my expectation of the emergence of a new, powerful advance.
Mike Paulenoff tweet media
English
1
0
2
288
Mike Paulenoff
Mike Paulenoff@MPTrader·
$TSLA reports Earnings tomorrow evening. My attached 4-Hour Chart argues that the 4/09/26 low at 337.25 ended the correction from the ATH at 498.83 (12/22/25), and initiated a new upleg phase that so far has climbed to last Friday's high at 409.28. My near-term pattern work exhibits bullish form from 337.25 to 409.28, which alerts me to the likelihood of upside continuation as long as any forthcoming weakness is contained above 374.60... My next upside target window is 420-430.
Mike Paulenoff tweet media
English
0
0
1
189