
BREAKING: Gold and silver posted their highest monthly closes ever in history, with gold at $5,278 and silver at $93.76. Gold jumped 7.83%, adding $2.68 trillion to its market cap in February. Silver surged 10%, adding $480 billion this month.
TrapMan13
1.1K posts


BREAKING: Gold and silver posted their highest monthly closes ever in history, with gold at $5,278 and silver at $93.76. Gold jumped 7.83%, adding $2.68 trillion to its market cap in February. Silver surged 10%, adding $480 billion this month.


Oil prices down by over 5%, with WTI Crude trading at $87 and Brent Crude at $99. Enjoy it while it lasts. Oil is going MUCH HIGHER.

PSA: Bitcoin ready for the next big leg down 🚨🚨🚨 Big BIG MASSIVE surprise ahead Sadly in the bear direction Not sadly if you know mechanical rules and can short THE GOOD NEWS IS THAT WE WILL BOTTOM LATER IN 2026!


You do not need to overcomplicate it. I don't understand why everyone finds its so hard to see these things. Well, I do, because emotions rule 99% of people. But anyone can line up these three fundamental macro charts and analyse where we are. It literally takes two minutes. 
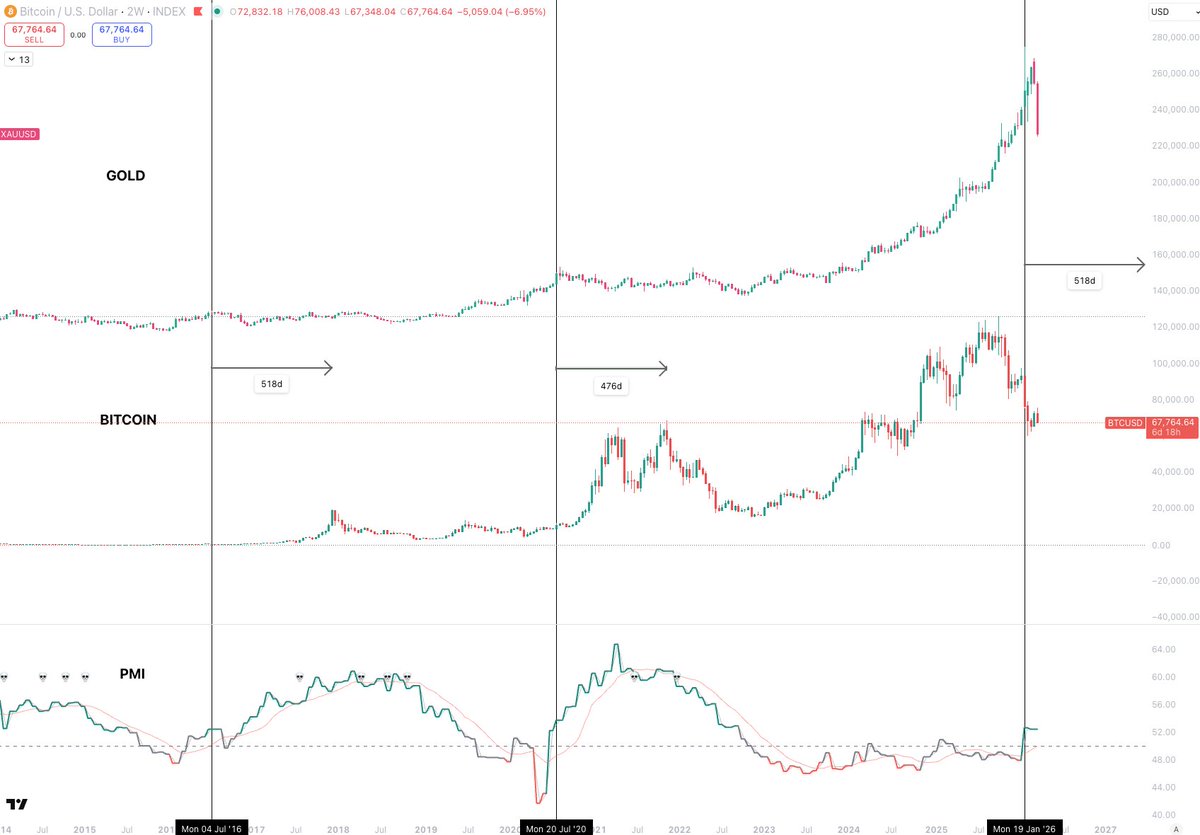
In every single cycle we have had: 1. GOLD tops as ISM moves into expansion 2. Bitcoin tops between 476d and 517d after It is very clear to see that. And it is not a coincidence this happens, it happens for fundamental macro reasons. GOLD is a strong risk off asset that performs well in economic and geopolitical uncertainty. When ISM breaks into expansion, that uncertainty is removed and GOLD finds its top, as ISM continues to expand. An expanding economy improves liquidity conditions and that is why Bitcoin then has its turn. Again, this is not a random chart that has no intrinsic link. These three charts represent different stages of a macro cycle and when you put them together, it becomes clear. Take a look at this again now... Do either GOLD or ISM look like they are anywhere near a position that signals Bitcoin having 9 months of a bear market left? Not at all.


The small European country of Slovenia has begun rationing fuel after panic buying driven by the Hormuz closure emptied gas stations and caused multi-hour lines to obtain petrol.


BREAKING: Gold just posted its biggest weekly drop in 43 years. Down 10.5% to $4,490 in a single week. You have to go back to 1982 to find a worse week for gold. But here is what makes this historically unusual. Every major gold crash in history happened for a clear fundamental reason. - 1982: Fed hiking rates to 20% to kill inflation. Fundamentally bearish for gold. - 2013: Fed signaling tapering. Bearish for gold. - 2022: Aggressive rate hikes. Bearish for gold. March 2026: War raging. Inflation rising. Oil refineries burning. Three US warships deployed. All of those are fundamentally bullish for gold. Yet gold just had its worst week since 1982. So what is actually happening? Three forces hitting simultaneously: - Dollar surging on safe haven flows, making gold more expensive for buyers outside the US - Commodity funds selling gold to cover losses on oil margin calls - CME raised gold margin requirements, forcing leveraged positions to liquidate The last time gold had a week this bad was 1982. Within 12 months, gold had rallied 50%. History does not guarantee a repeat. But 43 years is a long time between dips like this.


LATEST: Senate Majority Leader John Thune says the Clarity Act is unlikely to pass the Senate Banking Committee before April Source: Eleanor Terrett