Marius D

107 posts

Marius D

Marius D

@MariusDobra

Cluj-Napoca Katılım Kasım 2014
138 Takip Edilen91 Takipçiler
Marius D retweetledi
Mr. Anderson
Mr. Anderson@Truecrypto·
Let’s talk about the bull case for a minute. Not “this is the bottom.” Not “send it.” Just the bull case. Because, like it or not, BTC is sitting at support. Maybe it fails. Maybe this thing loses the floor, and we’re having a very different conversation soon. But we’re at the area now and I’m not going to pretend I haven’t seen this type of setup resolve bullish before. I have. 
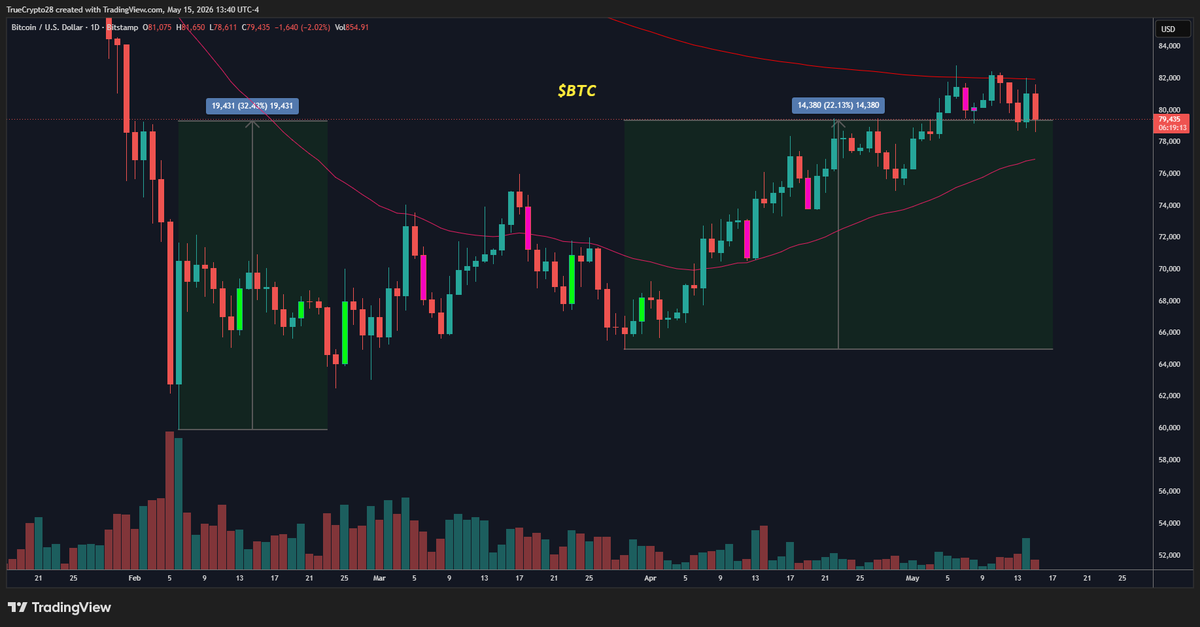
What caught my eye is how different this trip into the zone looks compared to February. Back then, once BTC lost the 80k area, it only took about 5-7 days to flush into the 60k zone. Fast move. Heavy volume. Real liquidation. This time, BTC got back near 82k, topped for a few days, and then took roughly 24 days to work its way back into the same general area. Yes, the last few days got ugly and that matters. But the entire trip back down was still slower, less violent, and a lot more controlled than the February flush. That’s interesting. From a Wyckoff angle, that’s basically effort vs result. In February, sellers hit hard and got paid immediately. This time, sellers got us back to the same zone, but it took almost a month. So now I’m asking a pretty simple question... Was Feb 5-6 stopping action? Was Feb 24 a secondary test? Was that February through April range some form of early accumulation? And is this just the market coming back into the same area to see if supply is actually dried up? That’s the bull case. Not confirmed. Not something to marry. Just something to respect. Because if that earlier range was real accumulation, then this is where the bigger hands should be interested again. They don’t need to defend my opinion. They need to defend price and that’s all that matters now. Do buyers show up? Do we get a spring and reclaim? Do late shorts get trapped? Can BTC bounce with some force, pull back, hold a higher low, and start taking levels back? That’s what I’d want to see for the Bull case. If price just sits here, fails to reclaim, and starts accepting lower, then forget the bull case. Then it was just a range inside a downtrend and the market is searching for value lower. Simple. But I don’t want to blind myself to one side just because the narrative is ugly. That’s how turns get missed. We’re all just studying footprints here. The bear case is easy. Lose this area, lose the February low, and lower value becomes the conversation. But the bull case is there too, fast liquidation into the zone in February, a much slower return into the same zone now, and one question left for the market to answer. Was that earlier range accumulation, or not? The next few days should tell us a lot. The missing piece in the bull case is demand and demand does not prove itself in a story. It proves itself here at this level. If that earlier range was real accumulation, this is where the bigger hands should start showing up again. This is where the theory has to become evidence.
Mr. Anderson tweet mediaMr. Anderson tweet media
English
16
19
217
18.5K
Popeye
Popeye@SailorManCrypto·
Time to vote for the next educational thread. You pick the topic. 1. Position Sizing Cheat Sheet: How to Size Every Trade From Your Stop 2. The Range Deviation Setup: Step by Step 3. When to Mark Lines and When to Mark Zones 4. The 5-Minute Rule: Wait Before You Click Reply with the number. Most votes wins. All my educational content is sponsored by @_WOO_X, where I trade crypto with zero fees on spot. Join here: wooxpro.com/en-US/invite/P…
English
105
2
73
9.3K
Marius D retweetledi
Popeye
Popeye@SailorManCrypto·
How I Decide What to Trade. My Top-Down Logic. Cheat Sheet You voted for it. Here is the framework I run before clicking on any chart. Seven steps, in order, every time. This educational thread is sponsored by @_WOO_X, where I trade crypto with zero fees on spot. What it is. Most traders open a chart, see candles, and form an opinion in three seconds. Bullish price action, they want long. Bearish price action, they want short. That is not analysis. That is reaction. Top-Down Logic is the opposite. You start at the highest level and zoom in, layer by layer, until the trade either survives every filter or gets thrown out. If a chart cannot pass the full seven-step funnel, you do not touch it. Why it matters. Random charts produce random results. A repeatable framework produces a repeatable edge. The framework also forces you to ignore charts you have no business trading. Most losses do not come from bad execution. They come from trading the wrong chart at the wrong time. The 7 steps. 1. Market phase. First question, always. Is this market in distribution, accumulation, or expansion? Distribution and accumulation are ranges. Expansion is trending. The setups that work in one phase do not work in the others. Wrong phase, wrong tools, wrong outcome. 2. HTF trend. Higher timeframe trend is your bias anchor. 1D, 4H, sometimes 1W. Is it up, down, or ranging? Trades aligned with HTF have a structurally better edge. Counter-trend trades have to clear a much higher bar to be worth taking. 3. LTF trend. Lower timeframe trend. 1H, 15m. The HTF tells you the direction. The LTF tells you the timing. The cleanest trades happen when LTF aligns with HTF, then breaks in the direction you already had a bias for. 4. Ranges. What are the ranges on each timeframe telling me? Where is price sitting inside the range? Top, middle, bottom? Ranges set the reference points for where you act and where you wait. No reference point, no trade. 5. Pick the level. Now you select the most interesting tradable level on this chart. Not just any level. The one that has the best confluence of HTF, LTF, range and structure. If no level stands out, the trade does not exist on this chart today. 6. Indicator confluence. Layer the indicators on last, not first. RSI, volume profile, fibs, whatever you use. Indicators are the final check, not the foundation. If the structure says no but the indicator says yes, you skip the trade. Structure leads. Indicators confirm. 7. Strategy match. Last filter. Do I have a strategy in my arsenal that fits this specific coin and this specific setup? If yes, I trade. If no, I do not. Every coin behaves differently. Range deviations work on some, breakouts work on others, mean reversion on a few. Knowing what plays on what is half the game. When NOT to follow this. You never skip steps. You can stop at any step if the answer kills the trade. But you do not jump ahead, you do not start from step 6 because the indicator looks tempting, and you do not click because the chart is moving and you feel left out. If you cannot complete the funnel cleanly, the trade is not yours. Wait for one that fits. The killer rule. The funnel is the trade. The click is the consequence. Most traders think trading is about the entry. Trading is about the seven decisions you made before the entry. If those are right, the click is automatic. If those are wrong, no entry tactic saves you. Build the funnel. Run it on every chart. Skip the ones that do not pass. That is how you stop trading random charts and start trading edge. Here below how it works on ranges and trends.
English
7
20
123
16.6K
Marius D retweetledi
Mr. VIX
Mr. VIX@yieldsearcher·
Global FX Reset: Thoughts going into the Long Wknd The new AI world mandates reshoring of manufacturing. That cannot be done under the current fiat petrodollar GRC regime, where the USD is perpetually bid up by foreign nations who must procure dollars to buy oil. The US must end the petrodollar regime and devalue the USD in the end, big time. But that can only be achieved without triggering mass capital flight if the US exerts leverage that the RoW cannot refuse. This is where the SoH closure comes in. Iran is a Kabuki theater, a distraction. The real targets are Europe and Asia. They will accept a major haircut on their dollar holdings. In return, (1) they will receive dollar liquidity access to orderly restructure financial systems devastated by incoming losses from USD devaluation, and (2) they will gain access to oil from the US which effectively controls Canada’s oil physically (it cannot go elsewhere) and Mexico/Venezuela’s politically. Refusal to cooperate will be met with the biggest dollar squeeze in modern history without dollar swap line, and the threat if delivered will cause DMs to face an FX crisis that makes the Asian Financial Crisis look like a child’s play. The petrodollar itself will be transformed into the very weapon that destroys it. Hence the pathway calls for massive dollar squeeze, then epic crash. What is coming is not Bretton Woods 3.0, but Plaza Accord 2.0. Every day without a peace deal increases the odds of this global currency reset. We are already too pregnant with the SoH closure and oil flow disruption to return to pre-2/27 world. The genie is out of the bottle. The only way out is through. And this reset will be the macro trade of our lifetime, far bigger than the current AI trade. Exactly when, not sure, but it will most likely happen before we run out of oil. The pathway is anyone’s guess, but the end destination is clear. And I do not intend to miss it.
오룡타이거@fivedragontiger

오일 가격 상승은 아시아에서 원유를 수입하는 국가들이 오일을 구입하기 위해서 더 많은 달러가 필요하다는 뜻 입니다. 전쟁이 길어질수록 외환보유고는 줄어들고 인플레는 증가하는 동시에 수요파괴가 일어나서 디스인플레가 발생합니다. 하지만 메모리칩 수출로 GDP는 상승한 것처럼 보여지나 국민다수는 가난해지는 K자 경제구조가 발생합니다. 아시아 fx 마켓에서 달러가 부족하면 외환위기에 빠질수 있고 그들은 이것을 막기 위해 보유한 금과 비트코인을 팔고 있습니다. AI제조국가는 버티고 있지만 그렇지 못한 인도네시아와 필리핀 등은 외환보유고가 급격히 줄고 있습니다. 한국, 일본, 대만도 자유롭지 못할 것입니다. AI 칩을 제조하는 아시아 국가들은 수출을 통해 달러를 많이 축척했고, 잉여 달러로 미국채와 금, 비트코인, 미증시에 투자했습니다. 이제 미국은 그들의 목줄을 조이고 있습니다. 왜 일까요? 아시아 국가들의 반도체 공장은 미국에 있어야 하는게 아닐까요? 아니면 태평양 넘어 작은 나라들의 화폐가치를 소각시켜 달러가치를 높이려는 잔인한 방법을 선택한걸까요? 메모리칩 가격 상승이 만든 인플레로 화폐가치 하락과 높은금리를 감당해야하는 국민들은 멍하게 대기업 성과급 잔치를 바라볼 수 밖에 없습니다. 그들이 고급자동차 매장에 갈때 우리는 자동차 할부 이자가 높아져 고통받습니다. 왜 국민들에게 알리지 않습니까!

English
25
44
153
24.9K
Marius D retweetledi
Mr. Anderson
Mr. Anderson@Truecrypto·
Perspective is everything. The S&P 500 is up nearly 18% from its March low, and people call it vertical. Bitcoin is up about 22% from its March low, and people call it muted. One is considered euphoric. The other is considered weak. Anyone who held the weak during this time outperformed the "euphoric" index. And that is using the friendliest comparison for the S&P. Use February 6th, and Bitcoin is up about 32% while the S&P is up about 9%. Price moves. Then people decide whether the move fits the story they already wanted to believe. Good traders do not get paid for naming the move. They get paid for reading the location, reaction, and acceptance, and for staying with the price while the crowd argues over what to call it and why it happened.
Mr. Anderson tweet mediaMr. Anderson tweet media
English
12
8
142
11.9K
Marius D retweetledi
Dario Perkins
Dario Perkins@darioperkins·
The dumb take is that Powell has lost control. The smart take is that this is the FOMC telling Warsh he wont have control...
English
17
47
580
54.4K
Marius D retweetledi
Stefan
Stefan@Stefan_B_Trades·
A lesson I’ve learned over the years is that once you’re in a trade you won’t just get wiser.. You won’t simply make good decisions; you’ll almost always make the worst possible ones. Observe your mistakes and you’ll improve a lot
English
3
2
96
5.3K