Mr.DataCenters™

1K posts

Mr.DataCenters™ banner
Mr.DataCenters™

Mr.DataCenters™

@MrDataCenters

Discussing all things data center-centric - AI, power, colocation, cloud, and development of the infrastructure that will support it all.

USA Katılım Temmuz 2024
65 Takip Edilen157 Takipçiler
Sabitlenmiş Tweet
Mr.DataCenters™
Mr.DataCenters™@MrDataCenters·
2026 is going to separate the teams who planned for AI-scale infrastructure from the teams who are still trying to “figure it out” in procurement meetings. 
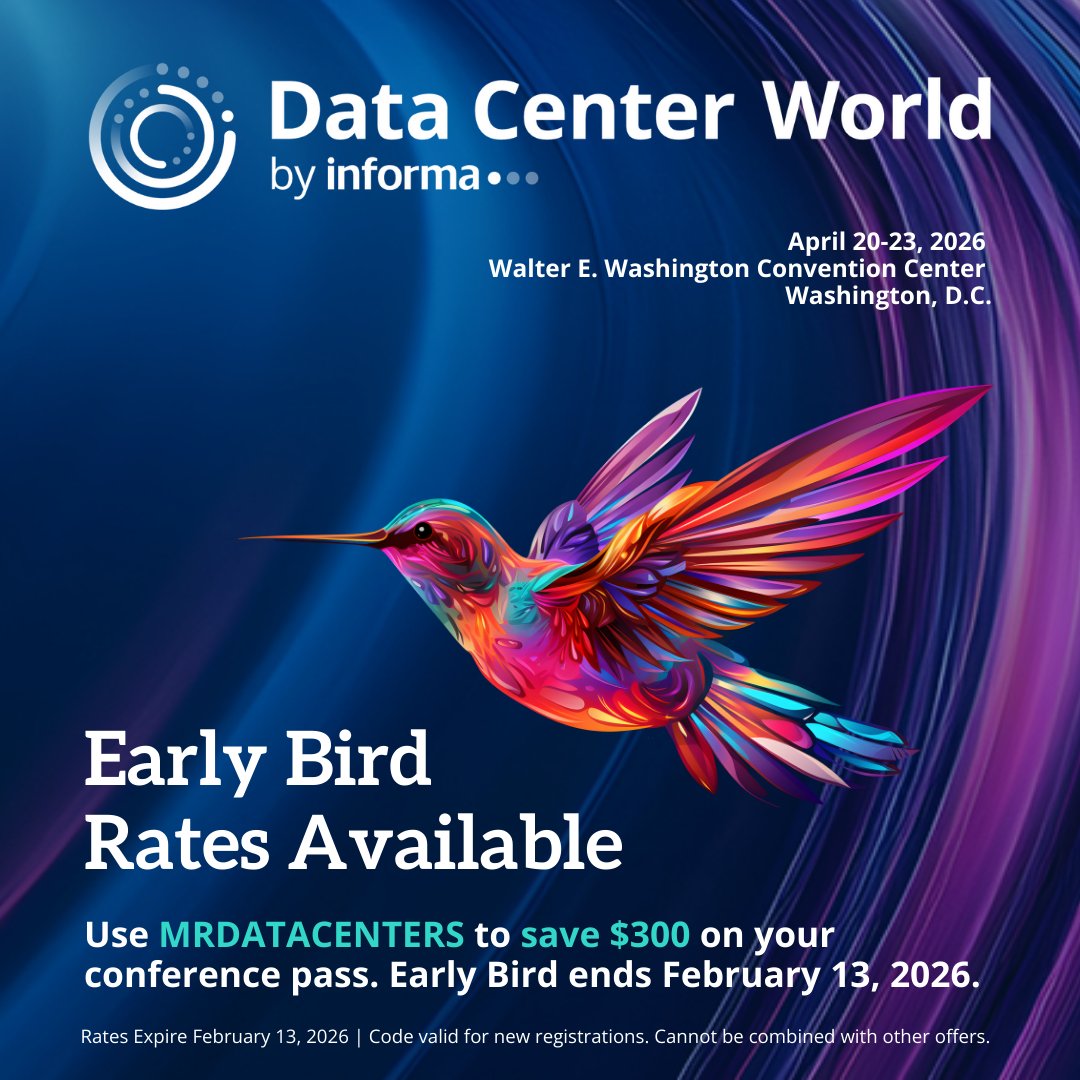
That’s why we’re heading to Data Center World (Apr 20–23 in Washington, D.C.), one of the best places to get out of the echo chamber and into the real conversations around power strategy, higher-density design, delivery timelines, and what’s actually moving projects forward. If you’re thinking about attending, the Early Bird offer runs through Feb 13 and you can save $300 on your conference pass with code MRDATACENTERS. Register here: datacenterworld.informaconnect.com/2026/registrat…
Mr.DataCenters™ tweet media
English
0
0
1
113
Mr.DataCenters™
Mr.DataCenters™@MrDataCenters·
The engineering required to build a 5 GW data center is forcing the industry to throw out its entire rulebook. IEEE Spectrum just published a detailed breakdown using Meta's Hyperion in Louisiana as the anchor. A few things that stand out: → A single Nvidia GB200 rack weighs 1,500kg and draws 120kW, forcing floors to handle loads that exceed international building codes for heavy industry. Nvidia expects future racks to hit 1 megawatt each. → Gas turbine wait times are now up to 7 years. Some operators are buying refurbished jet engines just to get turbines on any workable timeline. → Air cooling has hit its physical limits. Liquid cooling is now standard, requiring elaborate piping networks that are expensive to retrofit in anything built before 2023. → Construction timelines have compressed from 30-36 months to roughly 12 months at the most aggressive operators, but only when supply chains cooperate. The constraint is no longer capital or land. It's whether the physical supply chains for turbines, transformers, and cooling infrastructure can actually keep pace with the ambition. Sites with power infrastructure already in place aren't just saving time. They're sidestepping bottlenecks that no amount of budget can instantly fix.
Mr.DataCenters™ tweet media
English
0
0
1
19
Mr.DataCenters™
Mr.DataCenters™@MrDataCenters·
Memory is becoming one of the most important investment themes inside the AI buildout, and the numbers are moving faster than most expected. Memory is estimated to hit 30% of total hyperscaler capex in 2026, up from ~8% in 2023 and 2024. A near four-fold shift in three years that represents an enormous transfer of value toward Samsung, SK hynix, and Micron. A few things worth understanding: → HBM remains undersupplied through 2027, with meaningful new capacity from Micron and SK hynix not arriving until 2027-2028. The pricing environment for high-end memory stays favorable for suppliers for at least two more years. → Nvidia has secured preferential supply terms well below standard market rates, reflecting how strategically critical memory allocation has become at the highest levels of the industry. → Hyperscalers are absorbing memory cost inflation without slowing demand. When $700B in combined capex doesn't flinch at price increases, that tells you something important about how indispensable this infrastructure has become. The AI buildout has created a memory supercycle. The companies on the right side of that supply equation are going to look very well-positioned when the next earnings cycle lands.
Mr.DataCenters™ tweet media
English
0
0
0
25
Mr.DataCenters™
Mr.DataCenters™@MrDataCenters·
Data center incentives have quietly become a nine-figure budget line item in a bunch of states and in a couple of cases, a ten-figure one. Here are the most recently disclosed annual costs for programs over $100M/year: Texas: ~$1.016B (FY2025) Virginia: ~$732.8M (2024) Illinois: ~$370.6M (2023) Georgia: ~$296M (2025) With several more states clearing $100M. What’s the tell? Many are sales/use tax exemptions on equipment and because server fleets get refreshed every few years, the incentive behaves less like a ribbon-cutting perk and more like an ongoing operating advantage. Two takeaways I keep coming back to: 1. The real competition is shifting from “who gives the biggest tax break” to “who can deliver predictable time-to-power.” Incentives don’t fix interconnection queues. 2. Disclosure and guardrails are becoming part of site selection. Caps, sunsets, and clear reporting matter when the spend can swing fast. (Texas is the poster child for how quickly projections can jump.) If you’re building a shortlist of states/metros for 2026–2030, keep this table handy for the finance slide as it’s one of the clearest snapshots of where the “cost of winning” is headed.
Mr.DataCenters™ tweet media
English
0
0
1
41
Mr.DataCenters™
Mr.DataCenters™@MrDataCenters·
Google is nearing a deal to finance a $5B+ data center in Texas leased to Anthropic via Nexus Data Centers. 2,800 acres, 500MW by late 2026, with a long-term potential of 7.7 gigawatts. Two things stand out beyond the headline: The power strategy: the site sits near major gas pipelines, letting Nexus run its own gas turbines instead of waiting years for grid interconnection. Behind-the-meter generation is becoming the standard playbook for anyone building at gigawatt scale on a real timeline. The financial relationship: Google has already invested ~$3B in Anthropic, supplies TPU clusters via Google Cloud, and has a 1GW+ cloud capacity agreement in place. Adding construction financing means Google now has a material stake in Anthropic's infrastructure, revenue, and compute access simultaneously. That kind of vertical integration between an AI lab and its primary infrastructure backer is becoming a structural feature of how frontier AI gets built.
Mr.DataCenters™ tweet media
English
0
0
0
25
Mr.DataCenters™
Mr.DataCenters™@MrDataCenters·
The VC market has been contracting since 2022. AI is the only reason the headline numbers don't look worse.| Non-AI deal value has fallen more than 50% since Q1 2022, from $139.5B to roughly $60-66B per quarter. The inflection point that reversed AI's trajectory tracks almost exactly to ChatGPT's launch in November 2022. A few things worth noting beyond the surface: → AI is crowding out everything else. Capital that would have gone into fintech, SaaS, and consumer apps is being redirected toward infrastructure, foundation models, and AI-native applications → The green bars increasingly represent infrastructure bets, not software bets. CoreWeave, Nscale, and neocloud operators have absorbed billions that in prior cycles would have funded pure software companies → By Q4 2025, AI deals represent more than half of total global VC value, a concentration in a single technology theme with no modern precedent in venture history The next version of this chart will answer whether the non-AI market recovers, or whether AI continues absorbing an ever-larger share of a flat total.
English
0
0
0
12
Mr.DataCenters™
Mr.DataCenters™@MrDataCenters·
Stare at this chart of the OpenAI ecosystem capital flows map and you start to understand why the AI infrastructure buildout is unlike any investment cycle in history. Every arrow on this diagram is a financial relationship: customer contracts, revenue shares, equity investments, repurchase agreements, and vendor financing. The total committed capital flowing through this single ecosystem runs into the hundreds of billions, and most of it is circular. That circularity is the detail that deserves the most attention: → Microsoft has invested massively in OpenAI while simultaneously being one of its largest customers and infrastructure providers, meaning it is both funding the model and getting paid to run it → Nvidia sits at the center of nearly every hardware relationship on this chart, receiving capital from Oracle, Microsoft, and CoreWeave while supplying the chips that make all of OpenAI's output possible → CoreWeave raised $22.4 billion partly to buy Nvidia GPUs, partly financed by Microsoft, which then leases capacity back, a structure where the same dollars effectively travel in a loop → Oracle's $300 billion in committed infrastructure spend for OpenAI is the largest single arrow on the chart and also the one generating the most concern about Oracle's debt load and free cash flow sustainability → Amazon's $138 billion relationship reflects AWS as both an investor and infrastructure host, completing the picture of every major cloud provider having a stake in the outcome What this chart really shows is that the AI buildout is being financed by an ecosystem of deeply intertwined relationships where customers are investors, vendors are tenants, and competitors are partners simultaneously. The data center lease box sitting quietly in the corner of this chart is where the physical world intersects with all of it and why powered, entitled land remains the one input that none of these financial engineering structures can manufacture.
Mr.DataCenters™ tweet media
English
0
0
1
34
Mr.DataCenters™
Mr.DataCenters™@MrDataCenters·
The data center market is being redistributed in real time, and this chart shows exactly who is winning and losing market share between 2025 and 2028. Texas at +142% is the headline, projecting 40 GW of new capacity that would represent roughly 30% of the entire US total by 2028. But the more interesting story is what is happening to the states losing share, because some of those declines are happening even while capacity grows in absolute terms. Virginia losing 35% of its market share is the most counterintuitive data point on this chart. Northern Virginia remains the largest data center market on earth. It is being outpaced by markets that can still offer what Virginia increasingly cannot: ➡️ Available power at scale, without multi-year interconnection queues ➡️ Land that can be acquired and permitted without community opposition or zoning moratoriums ➡️ Utilities willing to work with developers rather than managing a grid already operating at its limits California at -50%, Oregon at -67%, Iowa at -60%, and Nebraska at -75% tell a similar story. These were early hyperscaler favorites chosen for cheap power and favorable tax treatment. That advantage has been arbitraged away as those grids filled up and new markets offered comparable or better economics. Georgia at +75% reflects Atlanta's emergence as a genuine Tier 1 market, a trend that began as an overflow valve for Northern Virginia and has since become a destination in its own right. The underlying principle the chart captures in its tagline is worth taking seriously: new data center growth is shifting to where power is cheaper, faster to secure, and easier to expand. That is a description of decisions already being made by people writing very large checks right now. The states not on this chart (Louisiana, Mississippi, North Carolina) are the ones to watch for the next version.
Mr.DataCenters™ tweet media
English
0
0
0
24
Mr.DataCenters™
Mr.DataCenters™@MrDataCenters·
Meta just increased its El Paso data center commitment from $1.5 billion to $10 billion. That is a 567% increase on a single facility that broke ground just five months ago. The facility is targeting 1 gigawatt of capacity by 2028, making it one of the largest single data center buildouts in the country. At peak construction, more than 4,000 workers will be on site. It is a mid-project recalculation that tells you something important about how AI infrastructure costs are moving relative to even the most aggressive internal forecasts made just months ago. A few things worth sitting with: → Meta has no cloud infrastructure business, meaning every dollar of this capex is being justified purely on the basis of internal AI demand for its own products: advertising, ranking, recommendation, and generative AI features across Facebook, Instagram, and WhatsApp. That is a different risk profile than hyperscalers who can sell excess capacity to third parties. → Meta's stock is down 17% year-to-date, yet the company is accelerating rather than pulling back. That conviction either reflects genuine demand signals that the market is not fully pricing, or a strategic bet that falling behind on infrastructure now is more costly than the short-term cash flow hit. → Meta also has projects under contract adding more than 5,000 MW of clean energy to the Texas grid, which reflects the broader lesson the industry has learned: you cannot build a gigawatt campus without also solving your own power supply. West Texas is emerging as a serious AI infrastructure corridor, and this commitment cements El Paso's position on the national data center map.
Mr.DataCenters™ tweet media
English
0
0
0
29
Mr.DataCenters™
Mr.DataCenters™@MrDataCenters·
Everyone wants to talk about AI engineers. One of the clearest labor signals from the AI boom is showing up somewhere else: utilities construction, electrical contractors, HVAC contractors, and commercial construction. That is what makes this chart so interesting. Since October 2022, employment in utilities construction is up by roughly 11.7%, while electrical contractors and HVAC contractors are each up about 8%. Commercial construction is also running well ahead of the broader market at roughly 7.4%, versus about 3.7% for the overall economy. Those reflect where capital is actually going. Research says construction jobs exposed to the data center buildout have increased by 216,000 since 2022. The firm also estimates that the U.S. will need roughly 500,000 net new jobs by 2030 to meet rising power demand. That tracks with the bigger infrastructure picture. It is also projected that U.S. data centers could reach 8% of total power demand by 2030, up from about 3% currently, and estimates about 47 GW of incremental generation capacity and roughly $50 billion of generation investment will be needed to support that growth. So yes, AI is a software story, but it is also a transformers, switchgear, substations, cooling systems, and skilled-labor story. The market may celebrate the model builders but the real bottleneck may be the people and infrastructure needed to make those models run in the physical world. That is where this gets real: the next phase of AI won’t be limited by imagination nearly as much as execution.
Mr.DataCenters™ tweet media
English
0
0
1
32
Mr.DataCenters™
Mr.DataCenters™@MrDataCenters·
This map shows data center demand capacity by county. The red clusters tell you where the grid is under pressure and the white space tells you where the next wave is going. The concentration around Northern Virginia, Dallas, Phoenix, Chicago, and Seattle reflects where the industry built over the past two decades. Those markets are now operating at or near capacity, vacancy below 1% in some submarkets, power queues stretching years, and permitting environments tightening in response to community pushback. What this map also reveals is how much of the country remains essentially untouched. That is an opportunity that the data point to directly: → Louisiana, Mississippi, and North Carolina have minimal existing demand capacity on this map, yet received some of the largest hyperscaler commitments of the past 12 months → The Midwest and Mountain West show scattered yellow dots where gigawatt-scale buildouts are now being announced → DOE sites marked for consideration represent federal land with existing transmission infrastructure and no community opposition, an increasingly valuable asset in a market where conventional development pathways involve years of queues and negotiation The red circles represent markets where development economics get harder every quarter. The white space represents markets where they get better, for whoever moves first with the right power access.
Mr.DataCenters™ tweet media
English
0
0
1
21
Mr.DataCenters™
Mr.DataCenters™@MrDataCenters·
Have an existing data center site or a site with data center potential? Let Mr. Data Centers help promote it at Data Center World April 20-23 in front of 5,000+ industry decision-makers. If you want your site seen by the right audience, let’s talk.
Mr.DataCenters™ tweet media
English
0
0
0
22
Mr.DataCenters™
Mr.DataCenters™@MrDataCenters·
→ 10,700+ public companies globally, yet a small cluster of mega-caps is capturing an outsized share of strategic relevance. Scale is concentrating fast. We're watching the market re-rate every company that either owns compute or enables compute at scale.
English
0
0
0
11
Mr.DataCenters™
Mr.DataCenters™@MrDataCenters·
→ This is a capex map disguised as an equity ranking. If chips, foundry capacity, and memory are soaking up this much value, the next-order beneficiaries are power, land, cooling, and data center locations. The valuation story and the infrastructure story are now the same story. → The stack is deeply physical and geopolitical: US platforms, Taiwanese manufacturing, Korean memory, Saudi energy. AI may feel software-led but the value chain is not.
English
1
0
0
19
Mr.DataCenters™
Mr.DataCenters™@MrDataCenters·
Public markets are now pricing control of the AI stack above almost everything else. Nvidia at $4.8T leads, but the real signal is underneath: TSMC, Broadcom, and ASML are all in the top 20. The market is rewarding bottlenecks. A few things stand out:
Mr.DataCenters™ tweet media
English
1
0
0
44
Mr.DataCenters™
Mr.DataCenters™@MrDataCenters·
Everyone talks about AI as chips, models, and data centers. But this cable map is the quiet part: connectivity is strategy. Beyond Google expanding routes between the U.S. and India, the bigger signal is redundancy: more direct paths, more diverse landing points, fewer “one-cut-and-you’re-dark” failures across the Atlantic, Africa, MENA, and the Indo-Pacific. AI doesn’t scale on compute alone. It scales on moving ridiculous amounts of data with low latency and high reliability, without a single choke point. India’s role is especially worth watching. It’s turning into a real intersection of cloud growth, enterprise demand, developer talent, and international bandwidth. Subsea cables now sit in the same stack as powered land, fiber corridors, and capacity planning. The AI race is also a race to own the routes that carry the world’s data.
Mr.DataCenters™ tweet media
English
0
0
1
21
Mr.DataCenters™
Mr.DataCenters™@MrDataCenters·
Visual Capitalist’s chart shows data center and AI infrastructure employment rising from roughly 280K in 2010 to nearly 500K in 2025, while its share of total U.S. employment climbed from about 0.22% to around 0.35%. That may still sound small but that is exactly the point. A relatively small slice of the workforce is now supporting one of the most important physical buildouts in the economy. Behind every AI headline is a very real race for power, land, fiber, and the people who know how to turn all of it into operating capacity. The next AI leaders won’t just be the ones with the best models but the ones building in the markets that can actually support them.
English
0
0
0
10
Mr.DataCenters™
Mr.DataCenters™@MrDataCenters·
What’s interesting is that each of these markets is winning for a different reason: ✔️ California reflects ecosystem density. ✔️ Texas looks like the clearest proof that power, land, and business climate can turn into infrastructure employment at scale. ✔️ Virginia continues to show how a market can stay strategically critical even when the story is bigger than simple headcount. ✔️ Washington’s showing reinforces how hyperscaler concentration can reshape an entire regional labor market. The longer trend matters even more.
English
1
0
0
11
Mr.DataCenters™
Mr.DataCenters™@MrDataCenters·
The AI infrastructure boom is usually talked about like a software story. This map shows it is just as much a jobs and geography story. The U.S. now has roughly 482,700 data center- and AI infrastructure-related jobs, and the distribution is far from even. California leads with 81.6K, followed by Texas at 48.0K. Florida and New York each sit at 27.8K, with Georgia (24.1K), Washington (23.6K), and Virginia (20.4K) not far behind.
Mr.DataCenters™ tweet media
English
1
0
1
23
Mr.DataCenters™
Mr.DataCenters™@MrDataCenters·
Everyone talks about the companies at the top of the AI supply chain map. The real story is everything below them. Memory (Micron, SK Hynix, Samsung) 🔴 — transformer lead times at 128 weeks, HBM allocated years in advance, hyperscalers designing their own silicon because merchant supply can't keep up. Network & optics (Broadcom, Marvell) 🟠 — medium constraint, which explains why these two companies have become more strategically important than most people realize despite rarely making AI headlines. Semiconductor equipment (ASML, Applied Materials, Lam Research) 🟢 — relatively healthy today, but also the exact layer geopolitical export controls are targeting most aggressively. Today's green could become tomorrow's red faster than most supply chain models assume. The AI buildout is constrained by a stack of physical supply chains, each with its own lead times, bottlenecks, and geopolitical exposure that no capex announcement can instantly resolve.
Mr.DataCenters™ tweet media
English
0
0
1
58