
NeetoPlaydash retweetledi

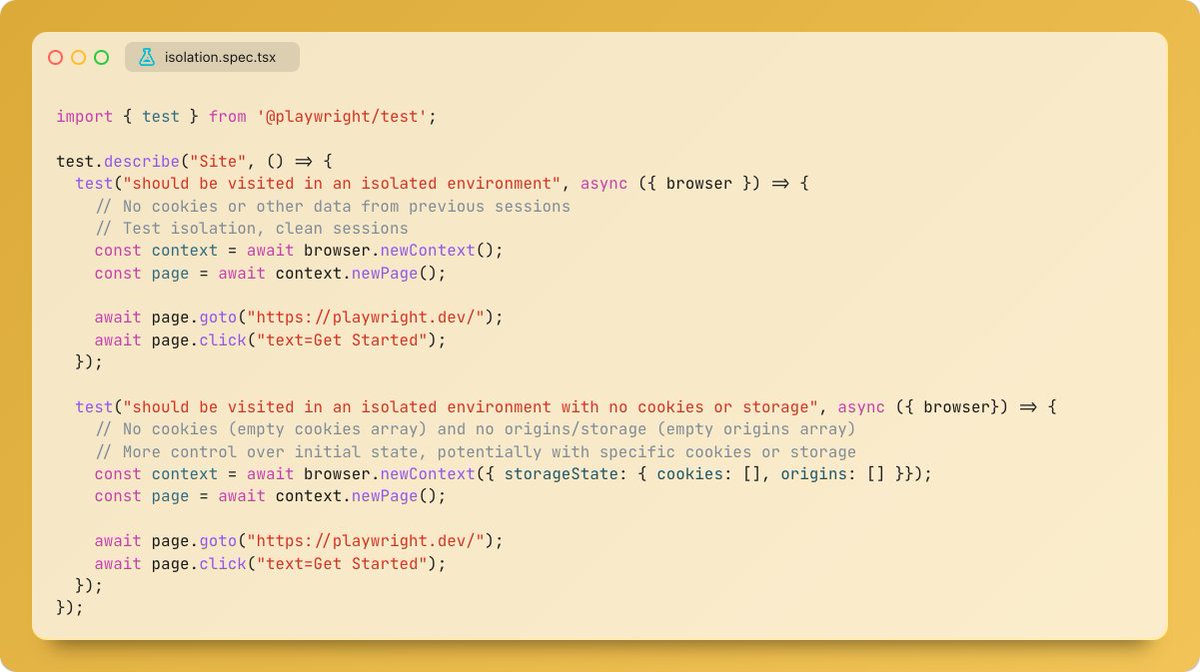
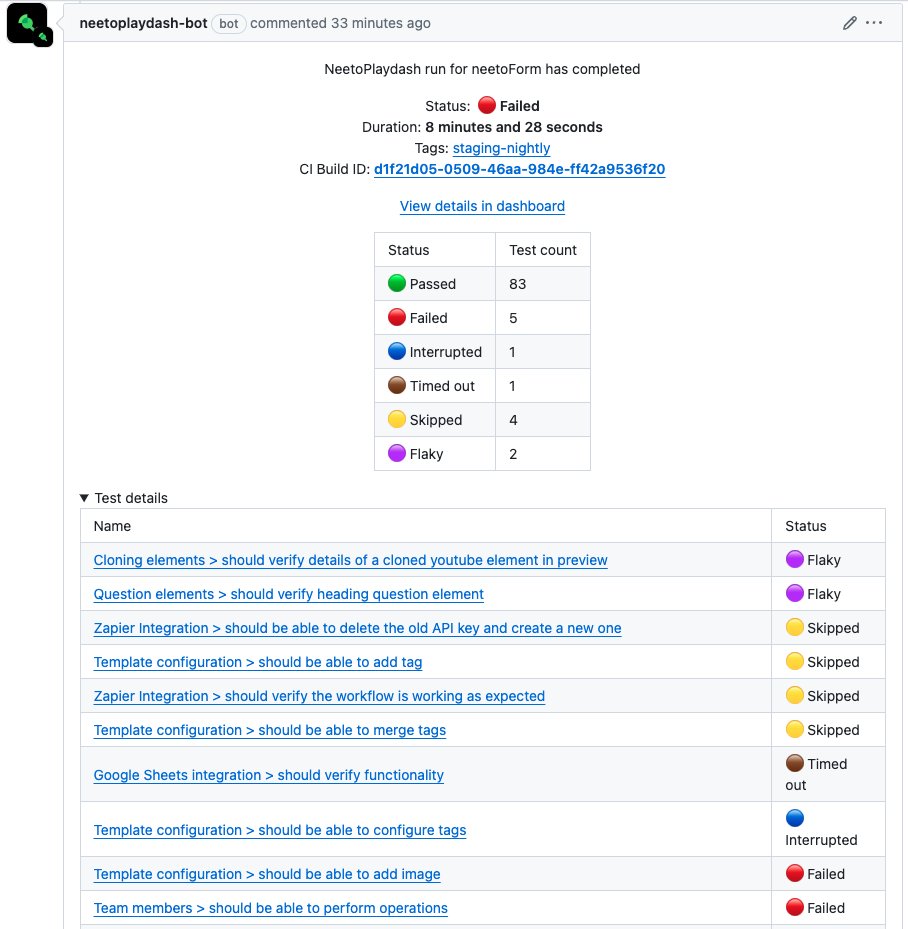
Playwright traces are like flight recorders for your tests - they capture every action, network request, DOM snapshot, and console log during test execution. When a test fails, especially in CI environments, traces become the most powerful debugging tool, providing a complete timeline of what happened and why.
We wrote a very detailed blog on how to analyze Playwright traces. @NeetoPlaydash can analyze Playwright traces.
This blog covers the trace viewer, the trace viewer interface, the execution timeline, the environment context, advanced debugging techniques, and some best practices.
As AI-assisted tools make it easier to ship code, the importance of having solid tests has increased. Over the years, we looked at Selenium, Cypress, and Playwright. We strongly believe Playwright is the best tool available today.
If anyone is interested in learning Playwright then you can checkout this tutorial that we maintain. courses.bigbinaryacademy.com/learn-qa-autom…
bigbinary.com/blog/how-to-an…
English