Sabitlenmiş Tweet

This is an updated list of peer-reviewed publications, conference presentations, video podcasts, and key blog articles explaining various aspect of our new climate-science paradigm currently known as the Nikolov-Zeller (NZ) Climate Concept.
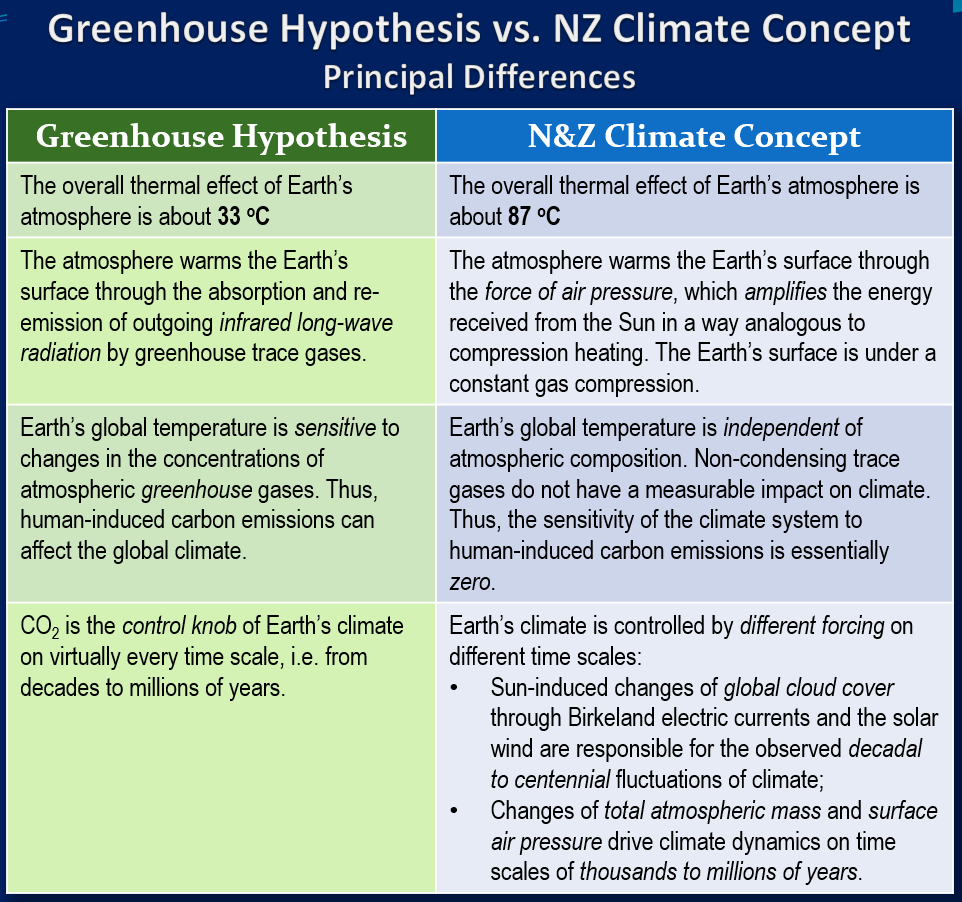
This full-fledged, physics-based and data-driven concept will eventually replace the "greenhouse theory" of climate change, which was proposed as a pure conjecture more than 120 years ago, and is now falsified by modern satellite observations from projects such as NASA CERES (ceres.larc.nasa.gov):
Peer-reviewed Scientific Papers:
- 2014. On the average temperature of airless spherical bodies and the magnitude of Earth’s atmospheric thermal effect: springerplus.springeropen.com/articles/10.11…
- 2017. New Insights on the Physical Nature of the Atmospheric Greenhouse Effect Deduced from an Empirical Planetary Temperature Model: omicsonline.org/open-access/Ne…
- 2024. Roles of Earth’s Albedo Variations and Top-of-the-Atmosphere Energy Imbalance in Recent Warming: New Insights from Satellite and Surface Observations: mdpi.com/2673-7418/4/3/…
Video Presentations & Podcasts:
- 2021. Demystifying the Atmospheric Thermal Effect. Toward a New Paradigm of Climate Science: vimeo.com/602819278
- 2021. Drivers of Earth's Paleoclimate, a New Paradigm of Understanding: youtube.com/watch?v=DpUkPP…
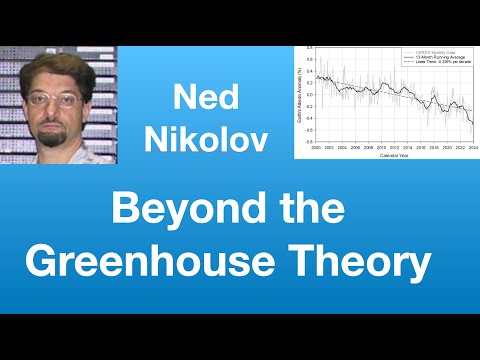
- 2024. Beyond the Greenhouse Theory: youtube.com/watch?v=L1GgmB…
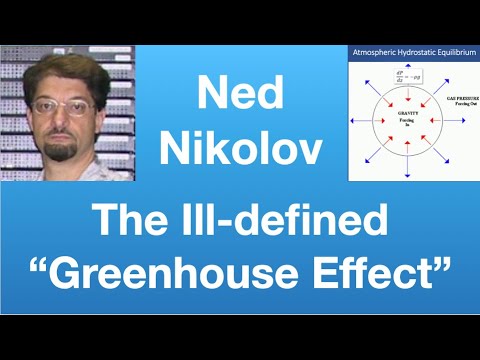
- 2025. The ill-defined “Greenhouse Effect” and Greenhouse-Gas "Radiative Forcing" youtube.com/watch?v=tTMEc5…
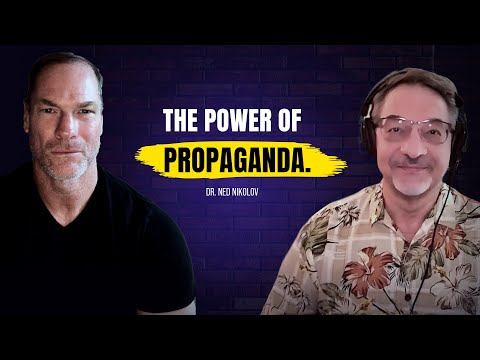
- 2025. What's the Truth? Unpacking Climate Science (Podcast with Dr. Shawn Baker): youtube.com/watch?v=-DhlH6…
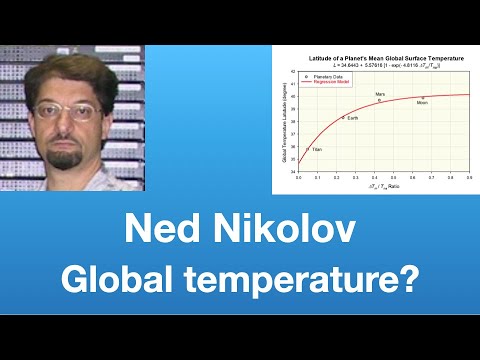
- 2026. Is the Global Mean Surface Temperature Physically Meaningful? youtube.com/watch?v=WqmxpW…
Blog Articles:
- 2022. Dispelling the Milankovitch Myth: Why were Ice Ages not caused by Orbital Cycles? tallbloke.wordpress.com/2022/01/03/ned…
- 2022. A Surface Solar Radiation Dataset exposes a major manipulation of Global Temperature Records between 1960 and 1980: tallbloke.wordpress.com/2022/07/11/ned…
- 2024. Misrepresentation of Critical Satellite Data by the IPCC 6th Assessment Report: tallbloke.wordpress.com/2024/07/26/nik…
- 2024. An Open Letter to IPCC discussing omissions & data misrepresentations in AR6: tallbloke.wordpress.com/wp-content/upl…
Spread the word about our new climate science, for it has the power to save the World through knowledge from a self-induced destruction caused by collective ignorance!
YouTube
YouTube
YouTube
YouTube
YouTube
English